Land Use Change Impacts on Ecosystem Services: Quantifying Risks and Informing Sustainable Strategies for Planetary Health
This article synthesizes the latest scientific research and methodologies for assessing the impacts of land use and land cover change (LULCC) on terrestrial ecosystem services.
Land Use Change Impacts on Ecosystem Services: Quantifying Risks and Informing Sustainable Strategies for Planetary Health
Abstract
This article synthesizes the latest scientific research and methodologies for assessing the impacts of land use and land cover change (LULCC) on terrestrial ecosystem services. It provides a comprehensive framework for researchers and scientists, exploring foundational concepts, advanced geospatial and modeling techniques like InVEST and CA-Markov, and strategies for troubleshooting model uncertainties. By integrating global case studies—from the highlands of Ethiopia to the Loess Plateau of China—and validating approaches through scenario analysis, this review highlights critical trade-offs and synergies. It further discusses the profound, yet often overlooked, implications of degraded ecosystem services for human well-being and, specifically, for the long-term security of biomedical research and drug discovery that depends on natural capital.
The Pressures of Change: How Land Use Transformation Drives Ecosystem Service Dynamics
The intricate relationship between Land Use/Land Cover Change (LULCC) and Ecosystem Services (ES) represents a critical interface in understanding how anthropogenic alterations to the Earth's surface directly impact the benefits that humans derive from ecosystems. LULCC refers to the human modification of Earth's terrestrial surface, encompassing both changes in the physical characteristics of the land (land cover) and the purposes for which land is used by humans (land use) [1]. These changes are recognized as primary drivers of alterations in ecosystem structure and function, subsequently affecting the provision of ES—defined as the various benefits that humans obtain from ecosystems [2]. The conceptual linkage between these domains forms a fundamental pillar for regional sustainable development, ecological management, and environmental planning, providing a framework for assessing the ecological consequences of human activities [3] [4].
The significance of this nexus has been amplified in recent decades due to unprecedented rates of global change. While human modification of land has occurred for millennia, contemporary LULCC exhibits greater intensity, extent, and velocity than historical changes, creating complex environmental challenges across local, regional, and global scales [3]. These changes function as driving forces for unprecedented transformations in ecosystem processes, often resulting in degraded habitat quality, biodiversity loss, and diminished capacity of ecosystems to provide essential services [1] [3]. A comprehensive understanding of the LULCC-ES relationship is therefore indispensable for formulating rational land use policies, designing effective ecological compensation mechanisms, and balancing economic development with environmental conservation [4].
Defining the Core Concepts: LULCC and Ecosystem Service Typologies
Land Use versus Land Cover
A precise distinction between "land use" and "land cover" is fundamental to systematic analysis. Land cover denotes the physical and biological characteristics of the Earth's surface, including vegetation types (forests, grasslands), soil properties, water bodies, and artificial structures [1]. In contrast, land use refers to human activities and management practices employed on a specific land area to achieve economic, cultural, or societal objectives [1]. This distinction is critical because changes in land cover (e.g., deforestation) may result from natural drivers or human intervention, whereas land use change inherently requires human agency [1].
Table 1: Key Definitions in LULCC and Ecosystem Services
| Term | Definition | Source |
|---|---|---|
| Land Cover | The physical and biological characteristics of the Earth's surface, including vegetation type, soil properties, and artificial structures. | [1] |
| Land Use | The human purposes and activities applied to a specific land area, encompassing economic, cultural, and management dimensions. | [1] |
| Ecosystem Services | The benefits people obtain from ecosystems, including provisioning, regulating, cultural, and supporting services. | [2] |
| Final Ecosystem Services | Components of nature directly enjoyed, consumed, or used by human beneficiaries without further transformation. | [5] |
| Intermediate Ecosystem Services | Ecological processes that contribute to the production of final ecosystem services but do not directly benefit humans. | [5] |
Ecosystem Service Typologies and Classification Systems
Multiple classification systems have been developed to categorize ecosystem services, with the Millennium Ecosystem Assessment (MA) framework representing one of the most widely adopted approaches. The MA categorizes ES into four broad groups:
- Provisioning Services: These represent the material products obtained from ecosystems, including food, water, raw materials, genetic resources, and medicinal resources [2].
- Regulating Services: These encompass the benefits obtained from ecosystem processes that regulate environmental conditions, including air and water purification, climate regulation, disease control, pollination, and flood protection [2].
- Cultural Services: These include non-material benefits that people obtain from ecosystems through spiritual enrichment, cognitive development, reflection, recreation, and aesthetic experiences [2].
- Supporting Services: These represent fundamental ecological processes necessary for the production of all other ecosystem services, including nutrient cycling, soil formation, and primary production [2].
A significant advancement in ES classification is the distinction between intermediate and final ecosystem services. Intermediate services represent input-output relationships within ecosystems (e.g., plant transpiration, cloud formation) that do not directly flow to people, whereas final ecosystem services (FES) are components of nature that flow directly to and are directly used or appreciated by humans [5]. This distinction is crucial for environmental accounting to avoid double-counting in economic valuation and for identifying metrics that matter most to people [5]. The United States Environmental Protection Agency's National Ecosystem Services Classification System Plus (NESCS Plus) builds upon this framework, providing a structured approach for identifying and categorizing FES [5].
Methodological Framework: Assessing LULCC Impacts on Ecosystem Services
Land Use/Land Cover Change Detection and Analysis
The accurate detection and quantification of LULCC form the foundational step in analyzing impacts on ecosystem services. Geospatial technologies, particularly remote sensing and Geographic Information Systems (GIS), have emerged as predominant methodological tools due to their accurate geo-referencing capabilities, digital format suitable for computer processing, and repetitive data acquisition [3]. The standard workflow involves multiple stages from data acquisition through final analysis.
Data Acquisition and Pre-processing: Multi-temporal satellite imagery (e.g., Landsat, SPOT) is acquired for the study period. Pre-processing steps, including geometric correction, radiometric calibration, and atmospheric correction, are essential to establish a direct relationship between the acquired data and biophysical phenomena [3]. Subsequent classification via supervised classification algorithms, such as the maximum likelihood algorithm, categorizes pixels into predetermined land cover classes (e.g., built-up area, agriculture, forest, water, barren land) [3].
Change Detection Analysis: The Post-Classification Comparison (PCC) method is widely recognized as one of the most accurate approaches for LULCC detection. This technique involves independently classifying images from different dates and then comparing the classifications to detect changes in land cover categories [3]. A key advantage of PCC is its capacity to minimize problems associated with analyzing multi-temporal images recorded under different atmospheric and environmental conditions, while providing explicit "from-to" change information that delineates the nature of conversions between land cover categories [3]. The results are typically expressed through a land use transfer matrix and the degree of land use dynamism (K), which quantitatively describes the rate and magnitude of land use changes [4].
Table 2: Core Methodologies for LULCC and ES Assessment
| Method Category | Specific Methods | Key Applications | References |
|---|---|---|---|
| LULCC Detection | Post-Classification Comparison (PCC), Image Differencing, Vegetation Index Differencing | Quantifying spatial and temporal dynamics of land use/cover changes | [3] |
| ES Valuation | Equivalence Factor Method, InVEST Model, ARtificial Intelligence for Ecosystem Services (ARIES) | Estimating Ecosystem Service Value (ESV) based on land use data and biophysical factors | [4] [6] |
| Spatial Analysis | Exploratory Spatial Data Analysis, Spatial Autocorrelation, Geographically Weighted Regression | Revealing spatial distribution patterns and relationships of ES | [4] [6] |
| Trade-off Analysis | Correlation Analysis, Regression Analysis, Bivariate Local Spatial Autocorrelation | Quantifying and visualizing trade-offs and synergies between different ES | [6] [7] |
Ecosystem Service Valuation and Assessment
The valuation of ecosystem services has evolved significantly, with several methodological approaches emerging to quantify ES provision in response to LULCC. The equivalence factor method, pioneered by Costanza et al. (1997) and subsequently refined by Chinese scholars for regional applications, has gained widespread attention due to its broad applicability and ease of use [4]. This approach assigns standardized value coefficients to different ecosystem types based on their capacity to provide services, with these coefficients often spatially adjusted to account for regional variations in ecological conditions using factors such as Net Primary Productivity (NPP), rainfall, soil erosion, and habitat quality [4].
Process-based models represent another important methodological strand. The InVEST (Integrated Valuation of Ecosystem Services and Trade-offs) model suite, for example, incorporates spatially explicit modules for quantifying specific ecosystem services such as water yield, carbon storage, soil conservation, and habitat quality [6]. The water yield module operates on the water balance principle, calculating the difference between input precipitation and output evapotranspiration to determine regional water yield [6]. Similarly, the ARIES (ARtificial Intelligence for Ecosystem Services) platform utilizes artificial intelligence approaches to model ecosystem service provision and flow [6].
Advanced analytical techniques are increasingly employed to understand the spatial dynamics of ES. Exploratory spatial data analysis methods, including spatial autocorrelation measures, help reveal the spatial distribution patterns of ES and identify clusters of high or low service provision [4]. Furthermore, researchers are placing greater emphasis on analyzing trade-offs and synergies between different ecosystem services, employing correlation analysis, regression techniques, and spatial statistics to quantify these complex relationships [6] [7].
Key Research Findings and Empirical Evidence
Documented Impacts of LULCC on Ecosystem Services
Empirical research across diverse geographical contexts has demonstrated profound impacts of LULCC on ecosystem service provision. A comprehensive study in the Huaihai Economic Zone (HEZ) of China revealed that between 1995 and 2020, regional ESV gains were primarily driven by the conversion of farmland, wetlands, and built-up land into water areas, whereas ESV losses mainly resulted from the conversion of farmland into built-up land and the transformation of woodland and grassland into farmland [4]. The study further quantified the sensitivity of ESV to different land use conversions using an improved cross-sensitivity coefficient (CICS), finding that regional ESV was most sensitive to the conversion of farmland to water areas and least sensitive to the conversion of woodland to built-up land [4].
Spatial patterns of ecosystem services exhibit significant heterogeneity in response to LULCC. Research in Hubei Province, China, demonstrated that ecosystem services displayed distinct spatial patterns, with high levels of soil conservation, carbon storage, and net primary productivity in western Hubei, while high food supply and water yield were concentrated in central and eastern regions [6]. This spatial heterogeneity underscores the importance of region-specific management approaches that account for local ecological contexts and service provision patterns.
The temporal dimension of LULCC-ES relationships has also been rigorously examined. Studies implementing long-term time series analysis have tracked the evolutionary trajectories of ecosystem services in response to cumulative land use changes. For instance, in the Waipaoa and Waiapu river systems in New Zealand, anthropogenic land-cover change triggered complete channel metamorphosis, transforming these rivers from single-thread, clear-flowing cobble-bedded systems to multi-thread, sediment-laden, rapidly aggrading rivers with significantly altered capacity to provide ecosystem services such as water purification, sediment regulation, and habitat provision [1].
Trade-offs and Synergies in Ecosystem Services
Understanding the complex relationships between different ecosystem services represents a critical research frontier in the LULCC-ES nexus. Empirical evidence consistently demonstrates that ecosystem services do not exist in isolation but rather exhibit intricate trade-offs (where one service increases at the expense of another) and synergies (where multiple services increase or decrease simultaneously) [6] [7]. Research in Hubei Province revealed notable synergies between carbon storage, soil conservation, and net primary productivity, while these services exhibited trade-offs with food supply [6]. This pattern reflects fundamental ecological constraints and competition for land resources between agricultural production and conservation-oriented ecosystem functions.
The mechanisms underlying these relationships are complex and often involve multiple pathways. A systematic review of ecosystem service trade-offs and synergies found that only 19% of assessments explicitly identified both the drivers and mechanisms leading to ecosystem service relationships [7]. This represents a significant research gap, as understanding these mechanistic pathways is essential for effective ecosystem management. Bennett et al. (2009) outlined four primary pathways through which drivers affect ecosystem service relationships: (1) direct effect on a single service with no effect on another; (2) effect on one service that interacts with another; (3) direct effect on two non-interacting services; and (4) direct effect on two interacting services [7].
Table 3: Documented Trade-offs and Synergies Between Ecosystem Services
| Ecosystem Service Pair | Relationship Type | Context and Drivers | Reference |
|---|---|---|---|
| Carbon Storage vs. Food Production | Trade-off | Land competition between forests and croplands; Afforestation policies | [6] [7] |
| Soil Conservation vs. Food Supply | Trade-off | Intensive agriculture reduces soil retention capacity; Land use intensification | [6] |
| Carbon Storage vs. Soil Conservation | Synergy | Forest conservation benefits both services; Shared ecological mechanisms | [6] |
| Water Yield vs. Carbon Storage | Context-dependent | Varies by ecosystem type and climate; Afforestation can reduce water yield in some systems | [6] |
| Cultural Services vs. Provisioning Services | Often Trade-off | Urbanization and infrastructure development replacing natural areas | [2] [6] |
Advancing research on the LULCC-ES nexus requires a sophisticated suite of data sources, analytical tools, and methodological approaches. The following table summarizes key resources that form the essential "research reagent solutions" for scientists in this field.
Table 4: Essential Research Reagents and Resources for LULCC-ES Studies
| Resource Category | Specific Tools/Datasets | Function and Application | Access/Source |
|---|---|---|---|
| Remote Sensing Data | Landsat Series, SPOT, Sentinel | Multi-temporal land cover mapping and change detection | USGS EarthExplorer, ESA Copernicus |
| Land Use/Land Cover Data | Chinese Academy of Sciences Data Center | Ready-made LULC classifications for specific regions | [4] [6] |
| Ecosystem Service Models | InVEST, ARIES, SoIVES | Quantifying and mapping ecosystem services | Natural Capital Project, ARIES Platform |
| Spatial Analysis Tools | GIS Software (ArcGIS, QGIS), Geoda | Spatial pattern analysis, autocorrelation, and visualization | Commercial and Open Source |
| Climate and Biophysical Data | WorldClim, HWSD, NPP Datasets | Spatial adjustment of ES valuation factors | Various Public Repositories |
| Classification Systems | NESCS Plus, CICES | Standardized frameworks for ES identification and classification | [5] |
| Statistical Analysis Tools | R, Python with spatial libraries | Correlation analysis, regression modeling, trade-off quantification | Open Source |
This overview has delineated the fundamental connections between Land Use/Land Cover Change and Ecosystem Service typologies, establishing a conceptual and methodological foundation for understanding this critical interface. The evidence demonstrates that LULCC serves as a predominant driver of changes in ecosystem service provision, with documented impacts across diverse geographical contexts and spatial scales. The distinction between land use and land cover, coupled with refined ecosystem service typologies that differentiate intermediate and final services, provides essential conceptual clarity for robust analysis.
Methodologically, the integration of geospatial technologies, process-based modeling, and advanced statistical analysis has significantly enhanced our capacity to quantify LULCC-ES relationships. The growing emphasis on trade-off and synergy analysis represents an important advancement, moving beyond single-service assessments to capture the complex interactions that characterize real-world ecosystems. Nevertheless, important research challenges remain, including the need for more explicit identification of drivers and mechanisms in ES relationships, improved temporal dynamics analysis, and enhanced integration of socio-economic dimensions into biophysical assessments.
Future research should prioritize several key directions: (1) developing more sophisticated approaches for projecting future LULCC impacts on ES under different scenarios; (2) enhancing the mechanistic understanding of how specific land use transitions affect different ecosystem services; (3) improving the integration of cultural ecosystem services into quantitative assessments; and (4) strengthening the science-policy interface to ensure research findings effectively inform land use planning and ecosystem management decisions. As human pressures on global ecosystems intensify, a comprehensive understanding of the LULCC-ES nexus will remain indispensable for navigating the path toward sustainable development.
Land use and land cover change (LUCC) represents one of the most significant direct human impacts on terrestrial ecosystems, with profound implications for ecosystem services (ES) that sustain global biodiversity and human well-being. This technical review examines two critical global hotspots—the Qinghai-Xizang Plateau (QXP) in Asia and the Ethiopian Highlands in Africa—where rapid environmental transformations provide crucial insights into the complex interplay between human activities and ecological functions. The QXP, often termed the "Third Pole" and "Water Tower of Asia," serves as an ecological security buffer for China, South Asia, Central Asia, and Southeast Asia, while the Ethiopian Highlands represent a vital agricultural region facing severe degradation challenges [8] [9]. Understanding the documented impacts in these regions is essential for developing effective conservation strategies and sustainable land management policies that balance ecological integrity with human development needs.
Qinghai-Xizang Plateau: A Fragile Ecological Barrier
Ecosystem Services and Pressures
The QXP provides essential ecosystem services that sustain global ecological security and the well-being of approximately two billion people through its function as a global climate regulation hub and the source of nine major Asian rivers [8]. This mega-ecosystem demonstrates extraordinary sensitivity to global climate change, serving as both a critical amplifier and early warning indicator of planetary environmental shifts. Over the past two decades, policy initiatives such as the "Western Development Strategy" and "Poverty Alleviation Campaign" have facilitated intensified human activities including urban expansion and infrastructure development, triggering considerable transformations in land use patterns and land cover characteristics [8].
Documented Changes and Impacts
Recent research utilizing 30-meter resolution remote sensing data reveals that approximately 7.5% of the total land area on the QXP underwent significant land use change between 2000 and 2020, with notable grassland degradation emerging as a primary concern [8]. The distribution of habitat quality (HQ)—a direct proxy for biodiversity integrity—exhibits a distinct "high edge-low northern" pattern, with forest land demonstrating the greatest impact on habitat quality changes [8]. Studies employing the InVEST model have further quantified these impacts, showing that despite minimal variation in HQ from 2000 to 2020, carbon storage experienced a slight decline while water yield and soil retention showed significant improvements [10].
Table 1: Documented Land Use Changes and Ecosystem Service Impacts on the Qinghai-Xizang Plateau (2000-2020)
| Indicator | Documented Change | Spatial Pattern | Primary Drivers |
|---|---|---|---|
| Land Use Change | ~7.5% of total area | Widespread across plateau | Urban expansion, infrastructure development, grassland degradation |
| Habitat Quality | Minimal overall variation | High edge-low northern pattern | Forest land changes most influential |
| Carbon Storage | Slight decline | Not specified | Land use conversions, vegetation changes |
| Water Yield | Significant improvement | Variation across watersheds | Climate factors, land management |
| Soil Retention | Significant improvement | Erosion-prone areas | Conservation measures, vegetation cover |
| Coordination-Conflict Ratio | 50:1 coordination to conflict | Cities & water source areas most dynamic | Natural factors (primary), socio-cultural factors (secondary) |
Multi-scenario simulations for the northeastern edge of the QXP project divergent futures under different policy approaches. The natural development scenario predicts construction land increases of 4,247.74 hectares primarily at the expense of forest land, while the cultivated land protection scenario anticipates farmland expansion of 2,634.36 hectares to maintain food security. In contrast, the ecological protection scenario shows notable forest expansion with restrained construction land development rates, resulting in an increased ecosystem service index across 26.07% of the region [10].
Ethiopian Highlands: Degradation and Restoration Challenges
Land Degradation Trends and Drivers
The Ethiopian Highlands represent a case study of severe land degradation, with approximately 50% of rural highland areas classified as degraded, resulting in the catastrophic loss of numerous ecosystem services for local communities [9]. Illegal logging, poor land management systems, overgrazing of pasturelands, population growth, insecure land tenure, poverty, and ineffective government policies remain the major drivers of this degradation, causing substantial losses in agricultural production and environmental unsustainability [9]. Population pressure has significantly reduced per capita land availability, with agricultural land per capita declining from 0.57 hectares in 1993 to 0.36 hectares in 2015, while forest land per capita decreased from 0.27 hectares to 0.12 hectares during the same period [9].
Case Study: Lake Tana Basin
The Lake Tana basin exemplifies the intense pressures facing Ethiopian ecosystems. Since 1989, cultivated land in this region has increased by 20%, now covering 68% of the Tana basin [11]. This agricultural expansion has triggered severe environmental consequences, including annual soil erosion ranging from 5 to 50 tons per hectare—representing a doubling of sediment transport from the 1980s to 2020s [11]. Water quality has simultaneously deteriorated, with phosphorus concentration in the lake increasing from 0.01 mg P/l in 2003 to approximately 1.8 mg P/l in 2020, and nitrogen concentration rising from near zero to 2 mg total N/l after 2016 [11]. These changes reflect the broader pattern of ecosystem service deterioration in regions where populations rely heavily on these services for survival.
Table 2: Documented Environmental Changes in the Ethiopian Highlands
| Parameter | Documented Change | Time Period | Implications |
|---|---|---|---|
| Cultivated Land in Lake Tana Basin | Increased by 20% to 68% coverage | 1989-present | Loss of natural habitats, increased runoff |
| Soil Erosion | 5-50 tons/hectare (doubled) | 1980s-2020s | Reduced agricultural productivity, sedimentation |
| Agricultural Land per Capita | 0.57 ha to 0.36 ha | 1993-2015 | Food security pressures, land fragmentation |
| Forest Land per Capita | 0.27 ha to 0.12 ha | 1993-2015 | Reduced ecosystem services, fuel scarcity |
| Phosphorus Concentration | 0.01 mg P/l to 1.8 mg P/l | 2003-2020 | Eutrophication, water quality degradation |
| Nitrogen Concentration | Near zero to 2 mg total N/l | Pre-2016 to present | Ecosystem imbalance, water hyacinth proliferation |
Methodological Approaches for Assessing Impacts
Integrated Modelling Frameworks
Research in both hotspots employs sophisticated integrated modelling approaches to quantify land use change impacts on ecosystem services. The InVEST (Integrated Valuation of Ecosystem Services and Tradeoffs) model has been widely applied to assess the distribution of key ecosystem service factors, particularly habitat quality (HQ) [8] [10]. This approach integrates biophysical and socioeconomic data to quantitatively evaluate service provision levels. In the QXP, researchers have coupled InVEST with the Patch-generating Land-Use Simulation (PLUS) model to predict land use patterns under multiple scenarios (natural development, cultivated land protection, and ecological protection) and evaluate consequent impacts on habitat quality, water yield, soil retention, and carbon storage [10].
Advanced Analytical Techniques
Recent studies incorporate machine learning approaches to identify driving mechanisms. The XGBoost-SHAP algorithm has been employed to determine the main factors affecting conversions between coordinated and conflicting areas of land use change and habitat quality [8]. This method helps explain complex non-linear relationships and identifies the relative importance of various drivers. Additionally, the four-quadrant diagram method has been proposed to quantitatively identify dynamic relationships between land use changes and habitat quality, revealing a 50:1 ratio of coordination to conflict evolution on the QXP over the past 20 years [8].
For spatial analysis, Geographically Weighted Regression (GWR) and Geodetector methods enable researchers to uncover spatially heterogeneous relationships between drivers and ecosystem services that traditional global models overlook [12]. These approaches are particularly valuable in arid regions like the Ili River Valley, where they have revealed that natural factors (precipitation, temperature, soil moisture) primarily drive water yield, carbon sequestration, and soil retention, while anthropogenic factors significantly influence habitat quality and water purification [12].
The Scientist's Toolkit: Essential Research Reagents and Materials
Table 3: Essential Research Materials and Analytical Tools for Ecosystem Service Assessment
| Category | Specific Tool/Dataset | Application & Function |
|---|---|---|
| Remote Sensing Data | China Land Cover Dataset (CLCD) - 30m resolution | Land use/cover change tracking with 79.31% accuracy [8] |
| Global Human Modification Datasets - 90m/300m resolution | Mapping cumulative human pressures on terrestrial ecosystems [13] | |
| Modeling Software | InVEST (Integrated Valuation of Ecosystem Services and Tradeoffs) | Quantifying ecosystem service provision levels [8] [10] |
| PLUS (Patch-generating Land Use Simulation) | Multi-scenario land use change projection [10] | |
| Analytical Frameworks | XGBoost-SHAP Algorithm | Explainable machine learning for driver identification [8] |
| Four-Quadrant Diagram Method | Quantifying coordination-conflict relationships [8] | |
| Geographically Weighted Regression (GWR) | Analyzing spatial non-stationarity in service relationships [12] | |
| Field Measurement | Soil erosion plots | Quantifying sediment transport rates [11] |
| Water quality sampling | Monitoring nutrient concentrations (N, P) [11] |
Restoration and Management Interventions
Ecological Protection Strategies
Research from both regions demonstrates that targeted interventions can mitigate ecosystem service degradation. On the QXP, ecological protection scenarios predict notable expansion of forest land accompanied by restrained development rates of construction land, resulting in increased ecosystem service indices [10]. Forest land and grassland have been identified as the primary contributors to ecosystem services, while construction land substantially impacts water yield [10]. In the Ethiopian Highlands, Sustainable Land Management (SLM) practices including biological and physical soil and water conservation measures, exclosure establishment, afforestation, and reforestation programs represent the most common interventions for preventing and restoring degraded lands [9]. Specific practices such as intercropping systems, composting, crop rotation, zero grazing, minimum tillage, agroforestry and rotational grazing have been implemented across the country with varying success [9].
Targeted Restoration Approaches
Research around Lake Tana demonstrates the importance of location-specific restoration strategies. Bahir Dar University studies reveal that restorative practices must be designed for specific locations and climates rather than applied as blanket actions [11]. For hillsides with hardpan, planting trees helps break the pan and allows water infiltration, while valley bottoms also require trees to transpire excess water [11]. Wetland rehabilitation through buffering zones and papyrus reed restoration helps remove nitrates and allows sediment and phosphorus to sink before entering water bodies [11]. Emerging approaches like Payment for Ecosystem Services (PES) schemes offer potential long-term solutions by identifying ecosystem service users and providers to establish financial incentives for conservation [11].
The documented impacts from the Qinghai-Xizang Plateau to the Ethiopian Highlands reveal both common patterns and distinct regional challenges in the relationship between land use change and ecosystem services. While both regions experience significant ecological pressures from human activities, the specific manifestations and appropriate management responses differ based on ecological, socioeconomic, and cultural contexts. The QXP demonstrates a general trend toward coordinated development between land use changes and habitat quality, albeit with specific hotspot areas experiencing conflict, particularly around urban and water source areas [8]. In contrast, the Ethiopian Highlands face more severe degradation trajectories requiring immediate intervention to maintain basic ecosystem functions [9] [11].
These case studies highlight the critical importance of region-specific, scientifically-informed management approaches that account for local ecological processes and socioeconomic contexts. The research methodologies refined in these global hotspots—including integrated modelling frameworks, advanced spatial analysis, and explainable machine learning—provide powerful tools for understanding and predicting ecosystem service responses to land use change globally. As human pressures on terrestrial ecosystems continue to intensify, the lessons from these regions will prove increasingly valuable for designing effective conservation and sustainable development strategies worldwide.
Ecosystem services, the critical benefits humans derive from nature, are traditionally categorized into provisioning services (e.g., food, water), regulating services (e.g., climate regulation, water purification), and cultural services (e.g., recreation, aesthetic values) [14]. The dynamics of these services are inextricably linked to land use and land cover change (LULC), which remains a primary driver of alterations in ecosystem service functions globally [15]. Within the context of a broader thesis on land use change impacts, understanding the historical quantification of these shifts is fundamental for informing sustainable landscape management and future policy directions. Rapid economic growth and population expansion have intensified human disturbances, leading to land degradation, vegetation cover reduction, and construction-land expansion, which profoundly affect regional biodiversity and socioeconomic activities [15]. This technical guide synthesizes advanced methodologies for quantifying historical trends in ecosystem services, provides a structured analysis of recorded changes, and outlines essential protocols for researchers engaged in this critical field. The focus on quantifiable data and standardized experimental protocols ensures that this review serves as a practical toolkit for scientists and development professionals aiming to measure, model, and mitigate the impacts of land use change on ecosystem service provision.
Methodological Approaches for Quantifying Ecosystem Service Trends
The accurate assessment of ecosystem services over time relies on a suite of sophisticated quantitative and geospatial techniques. The selection of an appropriate methodology depends on the specific service being evaluated, data availability, and the spatial and temporal scales of the analysis.
The Equivalent Factor Method for Economic Valuation
A widely adopted approach, particularly for regional and national-scale assessments, is the equivalent factor method. This method quantifies the Ecosystem Service Value (ESV) by translating ecological benefits into monetary terms based on standardized equivalency factors [4] [15]. The operational procedure is as follows:
- Land Use Classification: Utilize land use/land cover (LULC) data (e.g., from Landsat or Sentinel satellites) to classify the study area into categories such as farmland, woodland, grassland, water bodies, wetlands, and built-up land [4].
- Spatial Adjustment of Equivalence Factors: Apply a spatially adjusted value coefficient per unit area for each land use type. These coefficients are derived from benchmark values, often based on the economic value of food production per hectare, and are then adjusted for regional specificities using factors like Net Primary Productivity (NPP), rainfall, soil erosion data, and vegetation indices (NDVI) [4] [15].
- ESV Calculation: Calculate the total ESV and the value for individual services using the formula:
ESV = ∑(A_k * VC_k)whereA_kis the area of land use typekandVC_kis the value coefficient for that land use type [15]. - Profit and Loss Analysis: Dynamically analyze the impact of land use changes on ESV by constructing a profit and loss table that tracks the value changes resulting from conversions between different land use types [4].
Modeling and Machine Learning for Specific Service Assessment
For a biophysical assessment of specific services, model-based approaches are preferred. The InVEST (Integrated Valuation of Ecosystem Services and Tradeoffs) model suite is a prominent tool for this purpose [16].
- Water Yield (WY): The InVEST model estimates annual water yield based on a water balance principle, using inputs of precipitation, evapotranspiration, and soil properties [16].
- Carbon Storage (CS): This is quantified by modeling carbon stocks across four pools: aboveground biomass, belowground biomass, soil, and dead organic matter. Land use/cover maps are combined with carbon density data for each pool [16].
- Habitat Quality (HQ): The InVEST habitat quality model combines land use data with threat sources (e.g., urban areas, roads), their intensity, and the sensitivity of each habitat type to those threats to produce an index of habitat condition [16].
- Soil Conservation (SC): This service is calculated as the difference between potential soil loss (without vegetation) and actual soil loss, using the Revised Universal Soil Loss Equation (RUSLE) [16].
Recent advances integrate machine learning regression models (e.g., Gradient Boosting Models) with these traditional assessments. Machine learning excels at identifying non-linear relationships and complex interactions among drivers, such as land use, vegetation cover, and climate variables, thereby providing more accurate predictions of ecosystem service trends and their primary drivers [16].
Quantifying Cultural Services
Cultural ecosystem services, being non-material and normative, present unique quantification challenges. A robust method involves participatory mapping and economic valuation:
- Survey-Based Preferences: Conduct questionnaire surveys with tourists and local residents to gather data on preferences for specific landscape features and compositions. These preferences are linked to services like aesthetics, recreation, cultural heritage, and spirituality [17].
- Spatial Localization: Use Geographic Information Systems (GIS) to map these preferences, creating spatial hotspots of cultural service delivery [17].
- Economic Valuation: Assign a monetary value to these services using revealed preference techniques, such as the travel cost method, which estimates the value based on the cost people incur to visit a site, or stated preference techniques like willingness-to-pay surveys [17].
Assessing Trade-offs and Synergies
Understanding the historical interplay between services requires quantifying their relationships. The three primary approaches are [18]:
- Space-for-Time (SFT): Calculates the Spearman correlation coefficient between different ESs across spatial units (e.g., counties) for a single time point. A positive correlation indicates synergy, while a negative one suggests a trade-off.
- Landscape Background-Adjusted Space-for-Time (BA-SFT): Improves upon SFT by analyzing the difference between current ES values and a historical baseline, thereby accounting for landscape history.
- Temporal Trend (TT): Identifies relationships by comparing the long-term trends (increasing or decreasing) of various ESs over time within the same spatial unit.
Table: Comparison of Approaches for Quantifying Ecosystem Service Relationships [18]
| Approach | Core Principle | Data Requirement | Key Advantage | Key Limitation |
|---|---|---|---|---|
| Space-for-Time (SFT) | Spatial correlation at one time | Cross-sectional data for one year | Simple to compute with limited data | Assumes spatial and temporal changes are comparable, can misidentify relationships |
| Background-Adjusted SFT (BA-SFT) | Change from a historical baseline | Time series of spatial data | Accounts for landscape history | Requires multiple time points of data |
| Temporal Trend (TT) | Correlation of trends over time | Long-term time series data for each unit | Directly measures temporal co-variation | Requires extensive, long-term data records |
Documented Historical Trends and Quantitative Data
The application of the above methodologies across diverse global regions has revealed clear and quantifiable trends in ecosystem services, strongly tied to specific land use transitions.
Trends in the Huaihai Economic Zone and Huaihe River Basin (China)
Analysis of the Huaihai Economic Zone (HEZ) from 1995 to 2020 demonstrates that regional ESV dynamics were primarily driven by the conversion between farmland, water areas, and built-up land [4]. The most significant ESV gains were associated with the conversion of farmland, wetlands, and built-up land into water areas. Conversely, the most substantial ESV losses resulted from the conversion of farmland into built-up land and the transformation of woodland and grassland into farmland [4]. A study of the Huaihe River Ecological Economic Belt (HREEB) found that the overall ESV initially rose between 2000 and 2005 but decreased from 2005 to 2020, highlighting the non-linear and complex nature of these trends [15].
Table: Historical Ecosystem Service Value (ESV) Changes Linked to Land Use Change
| Region & Period | Key Land Use Change | Impact on ESV | Quantified ESV Data |
|---|---|---|---|
| Huaihai Economic Zone (1995-2020) [4] | Farmland → Water Area | Significant Gain | Regional ESV was most sensitive to this conversion. |
| Farmland → Built-up Land | Significant Loss | Primary driver of ESV loss. | |
| Woodland/Grassland → Farmland | Significant Loss | Major contributor to ESV reduction. | |
| Huaihe River Eco-Economic Belt (2000-2020) [15] | Farmland → Artificial Surfaces | Sustained Loss | Dominant land use trend causing ESV decline after 2005. |
| Achterhoek, Netherlands (2011) [17] | Preservation of 'Coulissen' Landscape | High Cultural Service Value | Tourism and recreation valuation based on travel cost and willingness-to-pay. |
Trends in the Yunnan-Guizhou Plateau (China)
Between 2000 and 2020, ecosystem services on the Yunnan-Guizhou Plateau exhibited significant fluctuations, driven by complex trade-offs and synergies [16]. The implementation of ecological restoration projects, such as the Karst Desertification Restoration Project, improved ecological quality in some areas. However, simultaneous rapid economic growth and human disturbance, including large-scale infrastructure construction and mining, created a complex pattern of trade-offs, for instance, between provisioning services (e.g., food from intensified agriculture) and regulating services (e.g., soil conservation and carbon storage) [16]. Land use and vegetation cover were identified as the primary factors affecting the overall bundle of ecosystem services in this sensitive karst region [16].
Experimental Protocols and Workflows
This section provides detailed, actionable protocols for key experiments and assessments cited in this guide.
Protocol for Assessing ESV Using the Equivalent Factor Method
Objective: To quantify the spatiotemporal change in the total economic value of ecosystem services in a region. Materials: LULC maps for at least two time points, regional grain yield and price data, NPP and rainfall data. Procedure:
- Data Preparation: Reclassify LULC raster data into major types: farmland, woodland, grassland, water, wetland, built-up land, and bare land.
- Calculate Base Equivalent Value: Determine the value of one standard unit equivalent factor based on the economic value of regional grain production per hectare [4].
- Spatial Adjustment: Develop adjustment coefficients for NPP (for organic matter production, gas regulation, etc.) and rainfall (for water-related services) to create spatially explicit value coefficients for each LULC type [4].
- Compute ESV: For each time point, calculate ESV using the formula
ESV = ∑(A_k * VC_k). Perform this calculation on a grid scale (e.g., 500m x 500m) for spatial explicitness [4]. - Change Analysis: Use a land use transfer matrix to track conversions between types and attribute ESV gains and losses to specific land use changes [4].
Protocol for Mapping Cultural Ecosystem Services
Objective: To spatially locate and economically value non-material benefits from a landscape. Materials: GIS software, demographic and preference survey data. Procedure:
- Stakeholder Survey: Administer a questionnaire to tourists and residents. Elicit preferences for landscape features (e.g., hedgerows, water bodies) and link these to cultural services (aesthetics, recreation, heritage) [17].
- Participatory GIS: Have respondents identify areas of high cultural value on maps or through GPS data.
- Spatial Regression: Use statistical models like Multiple Linear Regression to relate surveyed preferences to mapped landscape features and composition, creating predictive maps of cultural service supply [17].
- Economic Valuation: Employ the travel cost method by calculating the cost incurred by visitors to reach the site. Alternatively, use contingent valuation by analyzing survey responses about willingness to pay for landscape preservation [17].
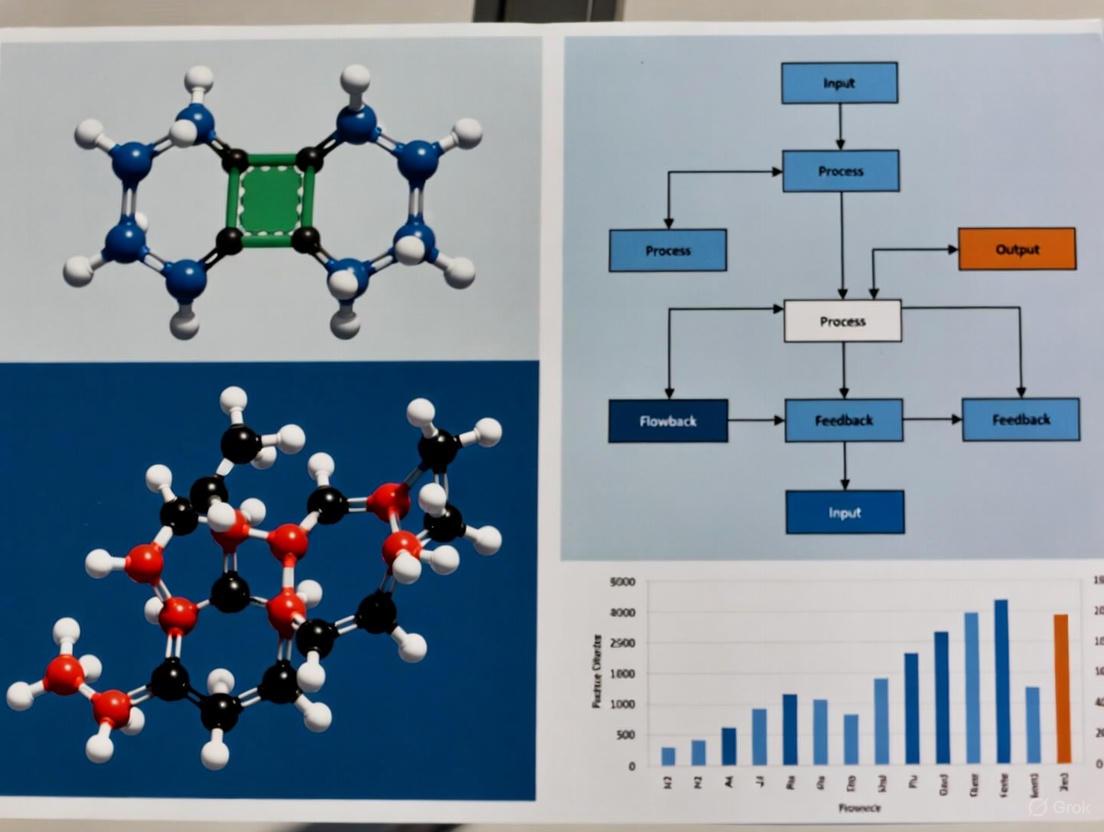
Visualization of Workflows and Relationships
The following diagrams, generated with Graphviz, illustrate core methodological workflows and conceptual relationships in ecosystem services research.
Ecosystem Service Assessment Workflow
Ecosystem Service Trade-offs and Synergies
The Scientist's Toolkit: Essential Research Reagents and Materials
Table: Key Research Reagents and Computational Tools for Ecosystem Services Research
| Item / Tool Name | Category | Critical Function in Research |
|---|---|---|
| Landsat/Sentinel Imagery | Data | Provides multi-spectral, multi-temporal satellite data for land use/cover classification and change detection. |
| InVEST Model Suite | Software | A suite of open-source models for mapping and valuing ecosystem services like carbon, water yield, and habitat quality [16]. |
| PLUS Model | Software | A patch-generating land use simulation model used to project future land use changes under different scenarios [16] [15]. |
| Google Earth Engine | Platform | A cloud-computing platform for planetary-scale geospatial analysis, enabling processing of long-term satellite data archives [18]. |
| R / Python with scikit-learn | Software | Programming languages and libraries used for statistical analysis, spatial data processing, and implementing machine learning algorithms to identify drivers of ES change [16]. |
| GIS Software (e.g., QGIS, ArcGIS) | Software | Essential for spatial data management, analysis, and cartographic visualization of ecosystem services. |
| Net Primary Productivity (NPP) Data | Data | A key biophysical parameter used to spatially adjust equivalent factors for ESV assessment, representing ecosystem productivity [4]. |
| Value Transfer Databases | Data | Pre-existing, published tables of ecosystem service value coefficients per unit area, used for initial ESV estimations [4] [15]. |
Land Use and Land Cover Change (LULCC) represents a critical environmental challenge with profound impacts on Earth's systems, ecosystem services, and human well-being. Understanding the complex interplay of forces driving these changes is essential for researchers, scientists, and policymakers working on sustainable land management and conservation strategies. This technical guide provides a comprehensive analysis of the key socioeconomic, political, and environmental drivers behind LULCC, framed within the context of ecosystem services research. Through structured data presentation, detailed methodological protocols, and visual synthesis of complex relationships, this whitepaper offers a scientific foundation for assessing LULCC impacts on ecosystem functions and biodiversity.
Socioeconomic Drivers of LULCC
Socioeconomic factors constitute primary drivers of LULCC globally, directly transforming landscapes through human activities and development patterns. These drivers operate across multiple scales, from local land management decisions to global market forces.
Table 1: Key Socioeconomic Drivers of LULCC
| Driver Category | Specific Mechanisms | Documented Impacts | Regional Examples |
|---|---|---|---|
| Population Growth & Urbanization | Settlement expansion, infrastructure development, peri-urban transformation | Settlements expanded from 2.5% to 46.9% (1993-2023); cropland decreased from 51.2% to 30.3% [19] | Burayu, Ethiopia [19] |
| Agricultural Expansion & Intensification | Cropland conversion, irrigation expansion, fertilizer application | 60% of land transformation (1982-2016) due to anthropogenic activities including cropland invasion [20] | Global [20] |
| Economic Development | Market integration, trade policies, consumption patterns | Per capita GDP growth correlates with agricultural management intensification and crop choice changes [21] | Global projections [21] |
| Infrastructure Development | Road construction, energy development, transport networks | Road density influences spatial patterns of land conversion and ecosystem service degradation [4] | Huaihai Economic Zone, China [4] |
Experimental Protocols for Socioeconomic Driver Analysis
Research on socioeconomic drivers employs rigorous methodological approaches to quantify relationships between human activities and land change:
Statistical Fixed-Effects Modeling: This data-driven approach utilizes historical panel data to project future agricultural land use under Shared Socioeconomic Pathways (SSPs). The protocol involves:
- Data Collection: Gather national-level time series data for harvested areas, urbanization levels, per capita GDP, farm size, mechanization ownership, irrigation extent, and nitrogen application rates from sources like FAOSTAT and World Bank Indicators [21]
- Model Calibration: Calibrate fixed-effects models on historical data (1961-2021) to establish relationships between socioeconomic drivers and agricultural outcomes
- Scenario Projection: Apply modeled relationships to future SSP scenarios (2020-2100) to project cropping patterns and management intensity [21]
- Validation: Compare projections with observed land use patterns and independent datasets
Participatory Land Use Mapping: This mixed-methods approach integrates geospatial analysis with local knowledge:
- Satellite Imagery Acquisition: Obtain multi-temporal satellite images (e.g., Landsat series) at 10-year intervals during dry seasons for cloud-free analysis [19]
- Ground Truthing: Collect Ground Control Points (GCPs) using GPS across various LULC categories for training and validation [19]
- Stakeholder Engagement: Conduct respondent interviews, focus group discussions, and field observations with local communities and development agents [19]
- Spatial Analysis: Perform supervised classification and change detection analysis using GIS and remote sensing techniques [19]
Political and Institutional Drivers
Political decisions, governance frameworks, and institutional arrangements significantly influence LULCC trajectories through land use policies, regulatory instruments, and management approaches.
Table 2: Political and Institutional Drivers of LULCC
| Driver Category | Specific Mechanisms | Documented Impacts | Case Examples |
|---|---|---|---|
| Land Use Policies & Planning | Zoning regulations, protected area designations, resource management plans | Revised resource management plans closed >1 million acres to drilling, designated 120,000 acres as Areas of Critical Environmental Concern [22] | Colorado River Valley, USA [22] |
| Energy & Extraction Policies | Leasing programs, permitting processes, environmental review standards | Streamlined permitting reduced environmental review times "from years to mere weeks" for oil, gas, and mineral extraction [23] | Western U.S. public lands [23] |
| Corporate Sustainability Targets | No-conversion commitments, land footprint reduction, landscape engagement | Companies commit to avoid conversion of natural ecosystems post-2020-2030, reduce agricultural land footprint [24] | Science Based Targets Network [24] |
| International Climate Agreements | Carbon sequestration initiatives, bioenergy expansion, REDD+ programs | Large-scale, land-based climate mitigation may increase competition for land, potentially raising food prices and impacting biodiversity [25] | Paris Agreement implementation [25] |
Methodological Framework for Policy Impact Assessment
Evaluating the effects of political drivers requires specific analytical approaches:
Policy Content Analysis Protocol:
- Document Collection: Gather policy documents, legislative texts, administrative orders, and management plans across multiple governance levels
- Coding Framework Development: Create standardized coding categories for policy instruments, stringency, implementation mechanisms, and targeted sectors
- Stakeholder Analysis: Identify key actors, institutions, and power relationships in policy formulation and implementation
- Comparative Analysis: Examine policy differences across jurisdictions and their correlation with divergent land use outcomes
Before-After-Control-Impact (BACI) Assessment:
- Treatment Identification: Define policy implementation as the "treatment" event with specific timing and geographical scope
- Control Selection: Identify comparable areas without policy implementation but similar socioeconomic and biophysical characteristics
- Time Series Data Collection: Acquire land use data for pre- and post-policy periods for both treatment and control areas
- Statistical Analysis: Use difference-in-differences or similar models to isolate policy effects from other drivers
Environmental and Climate Drivers
Environmental factors and climate change interact with human systems to shape LULCC patterns through both direct biophysical impacts and feedback mechanisms.
Table 3: Environmental and Climate Drivers of LULCC
| Driver Category | Specific Mechanisms | Documented Impacts | Confidence Level |
|---|---|---|---|
| Climate Change Impacts | Temperature increases, precipitation changes, extreme weather events | Land surface temperature increased 1.53°C (1850-1900 to 2006-2015), faster than global mean; altered growing seasons, reduced crop yields [25] | High confidence [25] |
| Biophysical Constraints | Soil quality, topography, water availability, ecosystem productivity | Net Primary Productivity (NPP), rainfall, and soil erosion significantly influence ecosystem service capacity and land suitability [4] | Well-established [4] |
| Carbon Fertilization | Atmospheric CO₂ concentration increases | Elevated CO₂ contributes to observed increases in plant growth and woody plant cover in grasslands and savannahs [25] | Medium confidence [25] |
| Climate Feedbacks | Albedo changes, evapotranspiration shifts, carbon cycle alterations | Land use contributes ~25% of global GHG emissions; ecosystems simultaneously uptake large carbon quantities [25] | High confidence [25] |
Integrated Environmental Assessment Methodologies
Earth System Modeling Integration:
- Scenario Development: Define Representative Concentration Pathways (RCPs) coupled with Shared Socioeconomic Pathways (SSPs) for consistent scenario framework [20]
- Model Coupling: Integrate computable general equilibrium models, climate models, and land system models to capture cross-system dynamics [26] [20]
- Spatial Downscaling: Apply patch-generating land use simulation (PLUS) models to allocate regional land use demands to 1km resolution grids [20]
- Uncertainty Analysis: Quantify uncertainty ranges through ensemble modeling and sensitivity analysis
Ecosystem Service Valuation Protocol:
- Biophysical Assessment: Measure ecosystem functions through indicators like NPP, water regulation, soil retention, and habitat quality [4]
- Equivalence Factor Development: Create spatially-adjusted equivalent factors for different ecosystem services based on local biophysical conditions [4]
- Economic Valuation: Apply benefit transfer methods with local calibration using regional crop prices and production data [19]
- Spatial Analysis: Calculate ecosystem service values (ESV) at grid scale to capture heterogeneity and analyze spatiotemporal patterns [4]
Visualizing Driver Interactions and Pathways
The complex interrelationships between socioeconomic, political, and environmental drivers of LULCC can be visualized through a systems diagram that highlights key feedback mechanisms and pathways.
Diagram 1: LULCC Driver Interactions and Feedback Pathways. This systems diagram illustrates how socioeconomic, political, and environmental drivers interact to influence Land Use and Land Cover Change, with critical feedback pathways affecting ecosystem services and climate systems.
The Researcher's Toolkit: Essential Methods and Reagents
Table 4: Essential Research Tools for LULCC and Ecosystem Services Analysis
| Tool/Category | Specific Components | Function/Application | Data Sources |
|---|---|---|---|
| Remote Sensing Platforms | Landsat Series (TM, OLI), MODIS, Sentinel | Multi-temporal land cover classification and change detection at various spatial resolutions (30m - 1km) [19] [20] | USGS Earth Explorer, NASA Earthdata |
| GIS & Spatial Analysis | ArcGIS, QGIS, GRASS GIS | Spatial data management, overlay analysis, suitability modeling, and map production [19] | Open-source and commercial platforms |
| Modeling Frameworks | GCAM, IMAGE, MAgPIE, PLUS, FLUS | Scenario-based projection of land use dynamics under alternative future pathways [20] [27] | Various open-source and proprietary platforms |
| Statistical Analysis | R, Python, STATA | Fixed-effects models, time series analysis, spatial econometrics, and multivariate statistics [21] | Open-source and commercial software |
| Ecosystem Service Assessment | InVEST, ARIES, benefit transfer methods | Quantification and valuation of ecosystem service flows and changes [19] [4] | Various modeling platforms |
| Climate Data | CRU TS, WorldClim, CMIP6 | Historical climate analysis and future climate projections [21] | Climate research organizations |
| Socioeconomic Data | FAOSTAT, World Bank WDI, national statistics | Demographic, agricultural, and economic indicator data [21] | International and national statistical agencies |
The drivers of Land Use and Land Cover Change operate through complex, interconnected pathways that transcend traditional disciplinary boundaries. Socioeconomic forces, particularly population growth, agricultural expansion, and urbanization, directly transform landscapes, while political and institutional factors shape the governance context within which these changes occur. Environmental drivers and climate change introduce additional complexity through biophysical constraints, direct impacts, and feedback mechanisms. Understanding these interactive dynamics requires sophisticated methodological approaches that integrate across spatial and temporal scales, modeling frameworks, and data sources. The tools and protocols outlined in this technical guide provide researchers with a comprehensive toolkit for investigating these critical relationships, ultimately supporting more effective land governance and ecosystem management in the face of global environmental change.
Human well-being is fundamentally interconnected with the flow of ecosystem services (ES)—the tangible benefits people obtain from ecological systems. Within the specific context of land use and land cover change (LULCC) research, understanding these connections becomes critical for predicting impacts of environmental decisions on human health and livelihoods. Land use change acts as a primary driver that modifies ecosystem structure and function, subsequently altering the capacity of landscapes to provide services upon which human communities depend [28]. Research demonstrates that LULCC can disrupt ES flows with direct consequences for material welfare, health security, and cultural fulfillment [29].
This technical guide examines the mechanistic pathways through which LULCC influences ES flows and, consequently, human well-being components. We synthesize interdisciplinary methodologies for quantifying these relationships, with particular attention to frameworks applicable to researchers and health professionals investigating environmental determinants of well-being.
Theoretical Frameworks: From Ecosystem Processes to Human Well-Being
The ES-Human Well-Being Cascade in Land Change Science
The relationship between LULCC and human well-being can be conceptualized as a cascading model: land use decisions alter ecosystem properties, which affect ecosystem service flows, which subsequently influence human well-being components. This chain involves both biogeophysical and socioeconomic processes requiring integrated assessment frameworks.
The Human Well-Being Index (HWBI) framework quantitatively defines these relationships, projecting how ES flows influence eight domains of well-being: Connection to Nature, Cultural Fulfillment, Education, Health, Leisure Time, Living Standards, Safety and Security, and Social Cohesion [29]. This framework enables researchers to model how LULCC impacts on ES indicators (e.g., water quality, air filtration, habitat provision) propagate through to multi-faceted well-being outcomes.
Carbon Flow as an Integrative Vector
Carbon flow presents a particularly valuable integrative vector for tracing ES-human well-being relationships because it physically connects natural and socioeconomic systems. Carbon serves as both a biogeochemical currency and an economic commodity, creating tangible flow pathways from ecosystems to human systems [30]. This approach enables researchers to quantify how LULCC-induced alterations in carbon sequestration, storage, and flows impact provision of essential services.
The diagram below illustrates the conceptual carbon flow pathway connecting ecosystems to human well-being:
Quantitative Approaches for Assessing ES-Human Well-Being Relationships
Ecosystem Service Valuation in Response to LULCC
Quantifying changes in ecosystem service value (ESV) provides a crucial metric for assessing LULCC impacts. The modified benefit transfer method applies per-hectare value coefficients to different land cover classes, enabling calculation of ESV changes over time [28]. Research in Ethiopia's Guna Mountain demonstrated this approach, revealing a dramatic decline in total ESV from USD 46.97×10⁶ in 1995 to USD 36.77×10⁶ in 2008 due to conversion of natural ecosystems to cropland and built-up areas [28].
Table 1: Ecosystem Service Value Changes by Service Category in Guna Mountain, Ethiopia (1995-2020)
| Service Category | ESV 1995 (USD ×10⁶) | ESV 2008 (USD ×10⁶) | ESV 2020 (USD ×10⁶) | Net Change (1995-2020) |
|---|---|---|---|---|
| Provisioning Services | 13.62 | 10.66 | 10.78 | -2.84 |
| Regulating Services | 19.73 | 15.44 | 15.62 | -4.11 |
| Supporting Services | 6.11 | 4.78 | 4.83 | -1.28 |
| Cultural Services | 7.51 | 5.89 | 5.96 | -1.55 |
| Total ESV | 46.97 | 36.77 | 37.19 | -9.78 |
Carbon-Based Assessment of ES and Human Well-Being
The carbon flow method enables direct quantification of ES contributions to human well-being by tracking carbon through socio-ecological systems. In the Manas River Basin, China, researchers measured per capita ecosystem services in carbon units (gC/person), finding that provisioning services increased over 400% from 1990-2015 due to agricultural intensification, while regulating, cultural, and supporting services declined significantly due to oasis expansion [30]. These changes reflected trade-offs between immediate material benefits and long-term regulatory functions with profound implications for community health and resilience.
Table 2: Carbon-Based Ecosystem Service and Human Well-Being Indicators
| Metric | Application | Measurement Approach | Relationship to Well-Being |
|---|---|---|---|
| Per Capita Provisioning Services | Manas River Basin, China | gC/person from food, fiber, water provision | Directly supports material living standards |
| Per Capita Regulating Services | Manas River Basin, China | gC/person associated with climate, water, disease regulation | Underpins health and security domains |
| Carbon Footprint | Multiple socioeconomic systems | Direct and lifecycle carbon emissions | Indicator of environmental impact on well-being |
| Carbon Storage Value | Regional ES assessments | Economic value of carbon sequestration | Contributes to wealth and economic security |
Methodological Protocols for ES-Human Well-Being Research
Land Use Change Analysis and Ecosystem Service Modeling
Protocol 1: Land Use/Land Cover Change Detection and Projection
- Data Acquisition: Obtain multitemporal land use/land cover data (minimum 2-3 time points) with sufficient spatial resolution (e.g., 30m Landsat imagery) [28] [15].
- Classification: Apply supervised classification algorithms (e.g., Random Forest in Google Earth Engine) using filtered sample points for training and validation [28].
- Change Detection: Conduct post-classification change detection to identify conversion patterns (e.g., forest to cropland, natural cover to built-up areas).
- Future Scenarios: Utilize simulation models (e.g., PLUS, CLUE-S, CA-Markov) to project future LULC under alternative scenarios (business-as-usual, ecological protection, economic development) [15].
- Validation: Assess model accuracy using observed vs. predicted LULC with metrics like Kappa coefficient and overall accuracy.
Protocol 2: Ecosystem Service Valuation Using Benefit Transfer
- Base Value Determination: Establish per-hectare ESV coefficients for different land cover classes using regionally-adjusted value transfer from established databases [28] [15].
- Spatial Allocation: Apply coefficients to spatially-explicit LULC data to calculate total ESV across the landscape.
- Temporal Analysis: Compare ESV across multiple time periods to identify trends and transitions.
- Trade-off Analysis: Identify ESV gains and losses associated with specific LULC conversions to highlight trade-offs.
Carbon Flow Assessment for Linking ES to Human Well-Being
Protocol 3: Carbon-Based Ecosystem Service and Human Well-Being Assessment
- Carbon Pool Quantification: Measure carbon stocks across different ecosystems (forests, agricultural lands, urban areas) using field measurements, remote sensing, and literature values [30].
- Carbon Flow Tracing: Track carbon movement from natural systems through socioeconomic systems using material flow analysis.
- Service Linkage: Associate carbon flows with specific ecosystem services (e.g., provisioning services via agricultural production; regulating services via carbon sequestration).
- Well-Being Connection: Correlate carbon-based service metrics with human well-being indicators (health, economic security, cultural values) using statistical analysis.
- Scenario Testing: Model how alternative land use scenarios would alter carbon flows and associated well-being outcomes.
The experimental workflow below illustrates the integrated methodology for assessing land use impacts on human well-being through ecosystem services:
The Scientist's Toolkit: Research Reagent Solutions
Table 3: Essential Research Tools for ES-Human Well-Being Studies
| Research Tool | Function | Application Context |
|---|---|---|
| Google Earth Engine | Cloud-based geospatial processing | LULC classification and change detection [28] |
| PLUS Model | Patch-generating Land Use Simulation | Projecting future LULC scenarios [15] |
| HWBI Framework | Human Well-Being Index assessment | Quantifying multi-domain well-being outcomes [29] |
| Carbon Flow Accounting | Tracking carbon through socio-ecological systems | Integrating natural and socioeconomic metrics [30] |
| Equivalent Factor Database | Standardized ES valuation coefficients | Regional ES assessment using benefit transfer [15] |
| Geographic Detector Model | Spatial stratified heterogeneity analysis | Identifying drivers of ESV variation [15] |
Understanding the mechanistic pathways from LULCC to human well-being via altered ES flows provides critical insights for sustainable land governance. The methodologies and frameworks presented enable researchers to quantify these complex relationships, projecting potential consequences of land use decisions across multiple well-being domains. This approach reveals that short-term economic gains from ecosystem conversion often come at the expense of long-term regulatory functions essential for community health and climate resilience [28] [30]. Future research should prioritize refining integrated assessment models that capture non-linear relationships and threshold effects in ES-human well-being systems, particularly focusing on health outcomes connected to environmental change.
The Modeler's Toolkit: Geospatial Analysis, AI, and Integrated Frameworks for ES Assessment
Land Use and Land Cover (LULC) mapping provides fundamental data for understanding human-environment interactions and their impacts on ecosystem services. Land use refers to human activities on the land, while land cover represents the physical attributes such as forests, water bodies, and other natural elements [31]. The analysis of LULC change constitutes a pivotal field of study that furnishes invaluable insights into evolving landscape patterns, playing a crucial role in informing sustainable land management practices and policies [31]. Changing patterns of land use are expected to impact ecosystem services, including water quality and quantity, buffering of extreme events, soil quality, and biodiversity [29]. Remote sensing and Geographic Information Systems (GIS) have revolutionized our capacity to monitor and analyze these changes across multiple spatial and temporal scales, providing critical data for environmental decision-making [32] [33].
The integration of advanced mathematical calculations and cloud computing platforms with traditional remote sensing and GIS-based techniques is increasingly transforming natural resource research [34]. Modern tools such as Google Earth Engine (GEE) provide access to cost-effective remote sensing and GIS tools with data at local, regional, and global scales, making LULC mapping more accessible and computationally efficient [34] [33]. This technical guide explores the fundamental principles, data sources, methodologies, and applications of GIS and remote sensing for LULC mapping within the context of ecosystem services research.
Fundamental Concepts: Remote Sensing and GIS for LULC Analysis
Remote Sensing Principles and Platforms
Remote sensing involves acquiring information about the Earth's surface from a distance, typically using sensors aboard satellites or aircraft [35]. These instruments detect and record reflected or emitted electromagnetic energy, providing a global perspective and wealth of data about Earth systems [35]. Space-based platforms operate in different orbits:
- Low-Earth orbit (approximately 160 to 2,000 km above Earth) is commonly used for Earth observation. Polar-orbiting platforms, like NASA's Aqua, are inclined nearly 90 degrees to the equatorial plane and travel from pole to pole as Earth rotates, enabling global coverage [35].
- Geostationary orbit (35,786 km above Earth) maintains position directly over the same place on Earth's surface, providing almost continuous coverage of one area [35].
Remote sensing instruments are categorized as either passive or active. Passive instruments, such as radiometers and spectrometers, measure natural energy from the Sun reflected from the Earth [35]. Active instruments, including radar and LiDAR, provide their own source of illumination to measure energy reflected back [35].
Table 1: Key Resolution Types in Remote Sensing
| Resolution Type | Definition | Importance for LULC Studies |
|---|---|---|
| Spatial | Size of each pixel within a digital image | Determines the level of detail and minimum mapping unit |
| Spectral | Ability to discern finer wavelengths | Enables differentiation between materials and land cover types |
| Temporal | Time it takes for a platform to revisit the same area | Determines frequency of monitoring and change detection capability |
| Radiometric | Amount of information in each pixel (number of bits) | Affects ability to distinguish subtle differences in energy |
Geographic Information Systems (GIS) in LULC Analysis
A GIS is a computer-aided system capable of collecting, storing, analyzing, and displaying spatially referenced digital data [32]. GIS technology has become an important tool for scientific investigation, resource management, and environmental planning [32]. For LULC studies, GIS provides essential capabilities for:
- Spatial data management and integration of multiple data sources
- Change detection analysis through temporal comparisons
- Spatial modeling of LULC change drivers and patterns
- Map production and visualization of LULC distributions
- Integration with statistical analysis for pattern quantification
Satellite Imagery Platforms
Multiple satellite platforms provide imagery suitable for LULC mapping at various spatial and temporal resolutions:
- Landsat Series: A joint NASA/USGS program providing moderate-resolution imagery (30-meter spatial resolution) with a 16-day temporal resolution. Landsat data are freely available through USGS EarthExplorer and other platforms [36].
- Sentinel-2: European Space Agency's mission with 10-60 meter spatial resolution and 5-day temporal resolution, particularly valuable for vegetation monitoring [34].
- MODIS (Moderate Resolution Imaging Spectroradiometer): Provides daily coverage with 250m-1km spatial resolution, suitable for large-area LULC mapping [35].
Table 2: Key Satellite Data Sources for LULC Mapping
| Satellite/Sensor | Spatial Resolution | Temporal Resolution | Key Applications in LULC |
|---|---|---|---|
| Landsat 8-9 OLI/TIRS | 30 m (optical), 100 m (thermal) | 16 days | Long-term land change studies, multi-decadal analysis |
| Sentinel-2 MSI | 10 m, 20 m, 60 m | 5 days | Vegetation monitoring, crop mapping, change detection |
| Terra/Aqua MODIS | 250 m - 1 km | 1-2 days | Continental-scale LULC, vegetation phenology |
| Commercial Very High Resolution | < 5 m | Variable | Urban mapping, infrastructure detection |
Digital Elevation Models (DEM)
DEMs provide critical topographic information that enhances LULC classification accuracy and enables analysis of terrain influences on land patterns:
- SRTM (Shuttle Radar Topography Mission): 30-meter resolution global DEM captured in February 2000 [37]. Provides elevation data with absolute vertical height accuracy of less than 16 meters [37].
- ASTER GDEM: Global digital elevation model with 30-meter resolution in the United States [37]. Has shown improvement over time with artifact corrections.
- ALOS World 3D: 30-meter resolution digital surface model (DSM) from JAXA, considered one of the most precise global-scale elevation datasets [37].
- LiDAR (Light Detection and Ranging): Provides high-accuracy elevation data through laser pulses to measure objects on the ground [37].
Methodological Framework for LULC Mapping
LULC Classification Workflow
The standard workflow for LULC mapping integrates remote sensing data processing, classification algorithms, and accuracy assessment, implemented through platforms like Google Earth Engine [34] [33].
Spectral Indices for Feature Enhancement
Spectral indices derived from satellite imagery bands enhance the discrimination between LULC classes. These indices highlight specific land cover properties and are calculated as ratios of different spectral bands [34].
Table 3: Essential Spectral Indices for LULC Classification
| Spectral Index | Formula | Application in LULC |
|---|---|---|
| NDVI (Normalized Difference Vegetation Index) | (NIR - Red) / (NIR + Red) | Vegetation health and density assessment |
| NDWI (Normalized Difference Water Index) | (Green - NIR) / (Green + NIR) | Water body detection and delineation |
| EVI (Enhanced Vegetation Index) | 2.5 * (NIR - Red) / (NIR + 6Red - 7.5Blue + 1) | Improved vegetation monitoring with atmospheric correction |
| BSI (Bare Soil Index) | ((Red + SWIR) - (NIR + Blue)) / ((Red + SWIR) + (NIR + Blue)) | Bare soil and agricultural land identification |
| NDBI (Normalized Difference Built-up Index) | (SWIR - NIR) / (SWIR + NIR) | Built-up area and urbanization mapping |
Machine Learning Classifiers for LULC Mapping
Machine learning algorithms have become standard for LULC classification due to their ability to handle complex, non-linear relationships in remote sensing data:
Random Forest (RF): An ensemble learning method that operates by constructing multiple decision trees during training and outputting the mode of the classes for classification tasks [34] [33]. RF is a supervised machine learning method based on a set of decision trees whose fundamental principle is "ensemble" or aggregation: it combines multiple decision trees constructed from different subsets of the data and predictor variables, randomly selected at each iteration [33].
Classification and Regression Trees (CART): A decision tree algorithm that creates a model predicting the value of a target variable by learning simple decision rules inferred from the data features [34].
Comparative studies have demonstrated the performance advantages of RF over CART, with RF achieving accuracy of 98% and kappa value of 0.97, while CART showed accuracy of 95% and kappa value of 0.94 in a western Oregon study [34]. The combination of vegetation indices with elevation data has proven particularly successful in determining areas where clear-cutting occurred in forests [34].
Accuracy Assessment Protocols
Rigorous accuracy assessment is essential for validating LULC maps. Standard practice involves:
- Using independent reference points collected through field surveys or high-resolution imagery
- Creating a confusion matrix (error matrix) to compare classified data with reference data
- Calculating overall accuracy, producer's accuracy, user's accuracy, and kappa coefficient
- The kappa index reports accuracy of LULC maps, with values above 85% considered acceptable for most applications [33]
Experimental Protocols for LULC Mapping
Case Study: LULC Mapping in Western Oregon Using GEE
A recent study demonstrated the application of Sentinel-2 imagery and machine learning for LULC classification in western Oregon, USA [34]:
Data Acquisition and Preprocessing:
- Sentinel-2 surface reflectance imagery from April 1 to July 31, 2023
- Cloud cover filter applied to include only images with less than 20% cloudy pixels
- Clouds and shadows masked using the QA60 band
- 48 images processed in GEE environment for mosaic creation
- SRTM elevation data integrated for topographic information
Classification Methodology:
- Five land classes defined: forest, agriculture, bare soil, water, and settlement
- Training data points: 75, 150, 300, and 2500 points used to test sensitivity
- Spectral indices composition: NDVI, NDWI, EVI, and BSI
- Comparative analysis of RF and CART classifiers
- Accuracy assessment using 500 independent reference points
Results:
- RF classifier with elevation data achieved overall accuracy of 92% and kappa coefficient of 0.90
- Different training point quantities affected model performance
- Combination of vegetation indices with elevation data successfully identified clear-cut areas
- Demonstrated utility for detecting storm damage, wind damage, insect defoliation, fire, and management activities in forest areas [34]
Case Study: Tropical Coastal Ecosystems in Southern Peru
A 2025 study analyzed LULC changes from 1990 to 2020 with projections to 2030 in the Ica region of Peru [33]:
Data and Methods:
- Landsat 5 and Landsat 8 imagery for 1990, 2000, 2010, and 2020
- SRTM digital elevation model for slope calculation
- Random Forest classification algorithm implemented in GEE
- Four LULC classes: desert, crops, urban, and continental water
- 200 training areas manually identified using high-resolution imagery
- Data split: 70% for model training, 30% for validation
Key Findings:
- Cultivated areas showed significant expansion: 48.9% (1990) to 75.72% (2020) in influence zones
- Urban development increased from 2.84% to 7.82% in the same period
- Transformation rates reached 53.1 ha/year to urban uses in coastal zones
- Projections indicated continued urban expansion along coast and major roads with reduction in natural cover by 2030
Table 4: Essential Research Reagents and Tools for LULC Analysis
| Tool/Platform | Function | Access |
|---|---|---|
| Google Earth Engine (GEE) | Cloud-based platform for planetary-scale geospatial analysis | Free for research and education |
| USGS EarthExplorer | Portal for downloading satellite imagery and DEM data | Free registration required |
| Random Forest Classifier | Machine learning algorithm for LULC classification | Available in GEE, R, Python |
| Sentinel-2 MSI Imagery | Multi-spectral imagery with high temporal resolution | Free via Copernicus Open Access Hub |
| Landsat Series | Moderate-resolution multi-spectral imagery archive | Free via USGS EarthExplorer |
| SRTM DEM | Global elevation data at 30m resolution | Free via USGS EarthExplorer |
| Normalized Difference Indices | Spectral transformations for feature enhancement | Calculated from satellite bands |
Linking LULC Change to Ecosystem Services
LULC changes directly impact ecosystem services, which include water quality and quantity, buffering of extreme events, soil quality, and biodiversity [29]. The Human Well-Being Index (HWBI) framework quantitatively defines relationships between ecosystem services and human well-being domains including Connection to Nature, Cultural Fulfillment, Education, Health, Leisure Time, Living Standards, Safety and Security, and Social Cohesion [29].
Scenario analyses that link impacts on ecosystem services to human well-being are valuable in anticipating potential consequences of land use change meaningful to local communities [29]. Ecological production functions (EPFs) can quantify likely changes in ecosystem services indicators resulting from changes in ecological condition, which can then be linked to human well-being through ecological benefits functions (EBFs) [29].
Studies have demonstrated that increasing rates of land development are almost universally associated with declines in ecosystem services indicators and associated indicators of well-being, as natural ecosystems are replaced by impervious surfaces that deplete the ability of ecosystems to buffer air pollutants, provide habitat for biodiversity, and retain rainwater [29].
GIS and remote sensing technologies provide powerful foundations for LULC mapping and analysis, enabling researchers to quantify spatial patterns, detect changes over time, and model future scenarios. The integration of machine learning classifiers like Random Forest with cloud computing platforms like Google Earth Engine has dramatically improved the accuracy and accessibility of LULC mapping. These geospatial approaches are essential for understanding the impacts of land use change on ecosystem services and human well-being, providing critical data to support sustainable land management decisions and policies. As remote sensing technologies continue to advance with higher spatial, temporal, and spectral resolutions, and machine learning algorithms become increasingly sophisticated, the capacity to monitor and analyze LULC dynamics will continue to improve, offering enhanced insights for ecosystem management and sustainability planning.
The InVEST (Integrated Valuation of Ecosystem Services and Tradeoffs) suite is a set of free, open-source software models developed by the Stanford Natural Capital Project to map and value the goods and services from nature that sustain and fulfill human life [38]. This spatially explicit modeling framework enables researchers and decision-makers to assess quantified tradeoffs associated with alternative land management choices by projecting how changes in ecological systems affect the flow of ecosystem services [38] [29]. The toolkit operates on production functions that define how changes in an ecosystem's structure and function affect service flows across landscapes, returning results in either biophysical terms (e.g., tons of carbon sequestered) or economic terms (e.g., net present value) [38]. Its modular architecture allows practitioners to select specific models relevant to their research questions without running the entire suite, making it particularly valuable for assessing land use change impacts on critical ecosystem services like habitat quality and carbon storage [39].
Model Fundamentals and Theoretical Framework
Core Conceptual Architecture
InVEST employs a spatially explicit modeling approach that uses maps as primary information sources and produces maps as outputs [38]. The framework operates on the fundamental principle that changes in land use and land cover (LULC) alter ecosystem structure and function, which in turn affects the capacity of ecosystems to provide services that benefit humans [29]. These relationships are quantified through ecological production functions that translate changes in ecological condition to changes in ecosystem services indicators [29]. The models further link these ecosystem services to human well-being through ecological benefits functions, allowing researchers to project potential impacts on multi-faceted components of human welfare, including living standards, health, cultural fulfillment, and connection to nature [29].
Key Model Components and Structure
All InVEST models share a consistent Python API architecture, with each model containing an execute function that accepts a single Python dictionary of arguments [40]. This standardized structure includes a mandatory workspace_dir parameter that points to the output directory, ensuring consistent file management across models [40]. The models are designed to function as standalone applications independent of specific GIS software, though basic to intermediate GIS skills are required to preprocess input data and interpret results [38]. This technical design enables integration with broader analytical workflows and scripting environments, supporting both one-time assessments and iterative scenario analyses that are essential for evaluating land use change impacts [40].
Carbon Storage and Sequestration Model
The Carbon Storage and Sequestration model quantifies carbon stocks and fluxes across landscapes based on LULC patterns and carbon pool inventories [41]. The model operates on the scientifically established principle that terrestrial ecosystems store substantial carbon across four fundamental pools: aboveground biomass, belowground biomass, soil, and dead organic matter [41]. This approach recognizes that terrestrial ecosystems collectively store more carbon than the atmosphere, making their management critical to climate regulation [41]. The model provides a spatially explicit method for estimating either current carbon storage (static assessment) or changes in carbon storage over time (sequestration analysis), with optional economic valuation of carbon sequestration benefits [41].
Technical Methodology and Input Parameters
The model applies carbon storage estimates to LULC classifications through a raster-based mapping process. For each LULC type, researchers must provide estimates of carbon stored in at least one of the four carbon pools, with more complete data yielding more accurate results [41]. The model aggregates these values across the landscape to produce comprehensive carbon storage maps. When both baseline and future LULC scenarios are provided, the model calculates net carbon sequestration or emissions over time through pixel-by-pixel comparison [41].
Table 1: Carbon Storage and Sequestration Model Input Requirements
| Input Parameter | Description | Format/Units | Requirement Level |
|---|---|---|---|
| Land Use/Land Cover Map | Baseline spatial data of LULC classes | Raster (GIS-compatible) | Required |
| Carbon Pool Table | Carbon estimates for each LULC class | CSV (metric tons/hectare) | Required |
| Aboveground Biomass Carbon | Living plant material above soil | Metric tons C/ha | At least one pool required |
| Belowground Biomass Carbon | Living root systems of plants | Metric tons C/ha | At least one pool required |
| Soil Organic Carbon | Organic component of soil | Metric tons C/ha | At least one pool required |
| Dead Organic Matter Carbon | Litter and standing dead wood | Metric tons C/ha | At least one pool required |
| Alternative LULC Scenario | Projected future land use map | Raster (GIS-compatible) | Optional (for sequestration) |
| Valuation Parameters | Carbon price, discount rate | Various currency units | Optional (for valuation) |
Experimental Protocol and Workflow
Implementing the Carbon Storage and Sequestration model follows a systematic protocol:
Land Cover Classification: Develop detailed LULC maps for the study area using remote sensing data or existing land cover datasets. For more accurate results, stratify broadly defined LULC classes (e.g., "forest") by relevant environmental variables such as elevation, climate zones, or time since disturbance [41].
Carbon Pool Estimation: Populate the carbon pool table using field measurements, literature values, or regional databases. Each LULC class must have associated values for the relevant carbon pools. Special attention should be given to carbon-dense ecosystems like forests, wetlands, and peatlands [41].
Scenario Development (Optional): Create alternative LULC scenarios representing potential future conditions under different management approaches or policy interventions [41].
Model Execution: Run the model through the InVEST API or graphical interface using the following standardized function call [40]:
Output Analysis: Interpret the resulting maps and summary statistics showing spatial patterns of carbon storage or sequestration potential.
Valuation Methodology
The model includes optional economic valuation of carbon sequestration using the equation [41]:
[value_seqx=V\frac{sx}{q-p}\sum^{q-p-1}_{t=0}\frac{1}{\left(1+\frac{r}{100}\right)^t\left(1+\frac{c}{100}\right)^t}]
Where:
- (V) = price per metric ton of carbon
- (s_x) = amount of carbon sequestered on parcel (x) (metric tons)
- (q) = alternate scenario year
- (p) = baseline year
- (r) = yearly market discount rate (%)
- (c) = yearly rate of change in carbon price (%)
This social cost of carbon approach estimates the damage avoided by not releasing carbon into the atmosphere, with values ranging from $9.55 to $84.55 per metric ton of CO₂ based on different economic assessments [41].
Habitat Quality Model
Ecological Foundations and Approach
While the search results do not contain specific technical details about the Habitat Quality model, it is a core component of the InVEST suite that assesses biodiversity support capacity based on habitat availability and landscape context [39]. The model evaluates how land use patterns and threats affect the ability of ecosystems to support native species, providing crucial information for conservation planning and impact assessment. This model is particularly valuable for understanding the biodiversity implications of land use change, complementing the carbon storage assessment to provide a more comprehensive picture of ecosystem service tradeoffs.
General Model Framework and Applications
The Habitat Quality model typically incorporates factors such as habitat extent, connectivity, and sensitivity to various anthropogenic threats (e.g., agriculture, urban development, infrastructure) [39]. By comparing current conditions with historical or potential future scenarios, researchers can identify areas of conservation priority and anticipate biodiversity losses from planned development. When combined with Carbon Storage assessment, this integrated approach reveals potential synergies and tradeoffs between climate mitigation and biodiversity conservation objectives, informing more sustainable land use decisions.
Integrated Modeling Approach
Multi-Service Assessment Framework
A principal strength of InVEST lies in its ability to assess multiple ecosystem services simultaneously, enabling researchers to identify co-benefits and tradeoffs across different management objectives [38] [29]. For example, a scenario that maximizes carbon storage might also enhance habitat quality for certain species, while other land use choices might create tradeoffs between these services. This integrated approach allows decision-makers to balance environmental and economic goals by providing a systematic framework for comparing alternative scenarios [38].
Linking Ecosystem Services to Human Well-Being
Advanced applications of InVEST can connect model outputs to human well-being through the Human Well-Being Index (HWBI) framework, which quantifies relationships between ecosystem services and multiple dimensions of human welfare [29]. This framework incorporates eight domains of well-being: Connection to Nature, Cultural Fulfillment, Education, Health, Leisure Time, Living Standards, Safety and Security, and Social Cohesion [29]. By quantifying these relationships, researchers can project how land use changes might ultimately affect community well-being, moving beyond biophysical or economic metrics to capture more holistic impacts [29].
Research Toolkit and Implementation Requirements
Essential Research Reagents and Data Solutions
Table 2: Essential Research Toolkit for InVEST Implementation
| Tool/Data Category | Specific Solutions | Function/Purpose | Data Format Requirements |
|---|---|---|---|
| Geospatial Data | Land Use/Land Cover Maps | Baseline ecological classification | Raster (GeoTIFF recommended) |
| Biophysical Tables | Carbon Pool Estimates | Quantify carbon in ecosystem pools | CSV with LULC codes |
| Habitat Parameters | Threat Sources & Sensitivities | Characterize habitat degradation | CSV tables |
| Climate Data | Precipitation, Evapotranspiration | Model water-related services | Raster layers |
| Economic Data | Carbon Price, Discount Rates | Economic valuation of services | CSV tables |
| Software Environment | Python 3.x | Model execution and scripting | Python environment |
| Spatial Analysis | QGIS, ArcGIS | Data preparation and result mapping | Various GIS formats |
Successful implementation of InVEST requires appropriate technical infrastructure and data management practices. The software operates independently of specific GIS platforms but produces outputs compatible with major GIS software for visualization and further analysis [38]. For large study areas or high-resolution analyses, substantial computational resources may be required, particularly for running multiple scenarios or model combinations. Researchers should establish systematic data management protocols for organizing input datasets, model parameters, and output files, leveraging the consistent API structure that all InVEST models share [40].
Limitations and Methodological Considerations
Key Model Limitations and Simplifications
While powerful for scenario analysis and tradeoff assessment, InVEST models incorporate important simplifications that researchers must consider when interpreting results. The Carbon Storage and Sequestration model uses a static pool approach that assumes LULC types are at fixed storage levels unless they transition to another class [41]. This means pixels that do not change LULC type will show zero sequestration, potentially underestimating carbon accumulation in regenerating forests. The model also simplifies the carbon cycle, excluding biophysical complexities like growing trees, evolving soil chemistry, or climate effects [41]. Additionally, the model assumes instantaneous carbon release from disturbances and uses linear sequestration rates for valuation, which may not capture non-linear accumulation patterns [41].
Data Quality and Uncertainty Considerations
Model outputs are highly dependent on the accuracy and resolution of input data, particularly LULC classifications and carbon pool estimates [41]. The "garbage in, garbage out" principle strongly applies, as coarse LULC classifications may mask important variation within classes. Researchers can address this by creating more detailed LULC schemes that stratify by environmental variables or disturbance history [41]. Uncertainty analysis and sensitivity testing are recommended, especially when models inform consequential decisions. The transparency about these limitations appropriately frames InVEST as a valuable tool for exploring scenarios and tradeoffs rather than generating precise predictions [41] [29].
The InVEST suite provides a powerful, open-source framework for assessing how land use changes affect ecosystem services like habitat quality and carbon storage. Its spatially explicit models enable researchers to quantify tradeoffs, identify synergies, and communicate the societal implications of alternative management scenarios. While subject to important limitations and simplifications, these models offer valuable approaches for integrating ecological science into decision-making processes. As part of a broader thesis on land use change impacts, InVEST can help structure research questions, generate testable hypotheses, and provide systematic methods for evaluating the ecosystem service consequences of landscape transformation.
Predictive modeling of land use and land cover (LULC) change is a critical component of environmental research, providing valuable insights into future landscape patterns and their potential impacts on ecosystem services. These models serve as essential tools for researchers and policymakers seeking to understand the consequences of anthropogenic activities and climate change on ecological functions [42]. Within the broader context of land use change impacts on ecosystem services research, predictive models enable the quantification of how alternative development pathways might affect the provision of services such as carbon storage, water purification, biodiversity conservation, and climate regulation [29] [43].
The integration of these land change models with ecosystem service assessment tools has revolutionized our ability to project the environmental outcomes of current decisions. As demonstrated in the Yunnan-Guizhou Plateau, such integrated approaches allow for "the projection of changes in ecosystem services under various future development scenarios, providing robust theoretical guidance for enhancing ecosystem management and decision-making processes" [16]. These methodologies are particularly valuable for assessing progress toward international sustainability targets, such as the United Nations' goal of a land degradation-neutral world by 2030 [44].
This technical guide examines three prominent modeling approaches—CA-Markov, Land Change Modeler (LCM), and Patch-generating Land Use Simulation (PLUS)—focusing on their theoretical foundations, implementation protocols, and applications within ecosystem services research.
Model Foundations and Comparative Analysis
Theoretical Underpinnings of Predictive Models
CA-Markov Model: This hybrid model combines cellular automata's spatial dynamics with Markov chain's temporal stochastic processes. The Markov chain computes transition probabilities between land classes over time, while cellular automata spatially allocate these changes based on neighborhood relationships [44] [42]. The model's strength lies in its ability to "simulate complex LULC patterns" by "considering spatial and temporal LULC dynamics" simultaneously [42]. It has been successfully applied in diverse regions, including the Upper Zambezi Basin, where it predicted a net reduction of approximately 3.2 million hectares of forest cover between 2023 and 2043 [44].
Land Change Modeler (LCM): Integrated within the TerrSet software suite, LCM employs a multi-layer perceptron neural network to model transition potentials. It analyzes driver variables to establish relationships with historical changes, then projects these relationships into the future [43]. In the Hillsborough River Watershed, Florida, LCM projected that urban areas could occupy nearly half of the watershed by 2050, with substantial implications for ecosystem services [43].
PLUS Model: The Patch-generating Land Use Simulation model incorporates a Land Expansion Analysis Strategy and a cellular automata-based model based on multi-type random patch seeds. This architecture enables it to "simulate complex land-use dynamics at a fine spatial scale," providing "significant advantages for forecasting both land-use quantities and spatial distributions over extended time series" [16]. The model has demonstrated superior prediction accuracy when coupled with multiple linear regression, achieving a Figure of Merit of 0.244 compared to 0.146 without regression in the Fujian Delta region [45].
Comparative Model Characteristics
Table 1: Comparative Analysis of CA-Markov, LCM, and PLUS Models
| Characteristic | CA-Markov | LCM | PLUS |
|---|---|---|---|
| Core Methodology | Markov chain transitions + Cellular Automata spatial allocation | Multi-layer perceptron neural network + Markov chain | Land Expansion Analysis Strategy + Random patch seeds |
| Spatial Capability | Moderate, limited by neighborhood rules | High, neural network captures complex patterns | High, excels at simulating patch-level changes |
| Temporal Projection | Discrete time steps based on transition matrices | Continuous projection based on driver variables | Flexible time steps with patch dynamics |
| Scenario Flexibility | Moderate, typically limited to business-as-usual | High, can incorporate multiple driver scenarios | High, integrates well with SSPs and policy scenarios |
| Key Strengths | Simplicity, ease of implementation, GIS compatibility | Robust handling of complex driver relationships, integrated platform | Fine-scale spatial accuracy, patch-generation capability |
| Primary Limitations | Limited capacity for complex driver integration | Dependency on quality and quantity of driver variables | Computational intensity for large regions |
| Ecosystem Service Integration | Often coupled with InVEST or equivalent models post-simulation | Can be directly linked with InVEST within analytical workflow | Compatible with InVEST and other assessment tools |
Experimental Protocols and Methodological Workflows
Generalized Predictive Modeling Workflow
The following diagram illustrates the comprehensive workflow for predictive modeling of land use change and ecosystem service impact assessment:
CA-Markov Implementation Protocol
Data Requirements and Preprocessing:
- Time-series LULC maps (minimum two periods) derived from satellite imagery such as Landsat, Sentinel, or commercial high-resolution data [44] [42]
- Accuracy assessment of historical classifications (minimum 85% accuracy recommended)
- Transition probability matrix calculation from historical changes
- Suitability maps based on driver variables (e.g., distance to roads, elevation, slope)
Model Calibration Steps:
- Transition Area Matrix: Calculate using Markov chain analysis between two historical dates
- Transition Suitability Map: Develop using multi-criteria evaluation or machine learning approaches
- CA Filters: Define neighborhood configuration (typically 5×5 or 3×3 cells)
- Model Validation: Simulate a known year and compare with actual map using validation metrics [42]
Projection and Analysis:
- Execute the CA-Markov model for future time points
- Implement scenario modifications through adjustment of transition probabilities and constraints
- Analyze projected patterns using landscape metrics
- Quantify ecosystem service impacts using additional models
In the Upper Awash Basin, researchers employed this protocol to project "substantial cropland and urban area expansion, increasing from 8472.45 km² (71.97%) in 2015 to 9159.21 km² (77.71%) in 2060" under a business-as-usual scenario [42].
PLUS Model Implementation Protocol
Data Requirements:
- LULC maps for multiple time points
- Driver variables: natural environment (topography, climate), socioeconomic (population, GDP), and proximity factors (distance to roads, water)
- Exclusion constraints: protected areas, steep slopes, water bodies
Land Expansion Analysis Strategy:
- Extract land use changes between two historical periods
- Use random forest algorithm to determine contributions of driving factors to each land use type's expansion
- Generate development probability for each land use type
Patch-Generation Simulation:
- Calculate required land use type areas using Markov chain or other demand models
- Apply multi-type random patch seeds mechanism to generate new patches
- Implement adaptive inertia factors to control competition among land use types
In the Fujian Delta region, this approach successfully projected landscape ecological risk for 2050 under different Shared Socioeconomic Pathways, with the PLUS model demonstrating higher prediction accuracy when coupled with multiple linear regression [45].
Ecosystem Service Assessment Protocol
Model Integration Framework:
- Land Change Projection: Utilize CA-Markov, LCM, or PLUS to generate future LULC scenarios
- Ecosystem Service Quantification: Employ models like InVEST to calculate service levels
- Economic Valuation (optional): Assign monetary values to ecosystem services using benefit transfer or primary valuation methods
Key Ecosystem Service Metrics:
- Carbon Storage: Estimated based on land cover-specific carbon densities
- Water Yield: Calculated using the water balance approach
- Sediment Retention: Modeled using soil erosion and deposition processes
- Habitat Quality: Assessed based on land cover intensity and threat sources
Table 2: Ecosystem Service Impacts of Land Use Change Documented in Case Studies
| Study Region | Model Used | Projected Change | Ecosystem Service Impact |
|---|---|---|---|
| Hillsborough River Watershed, Florida [43] | LCM + InVEST | Urban expansion (+30% by 2023, nearly 50% by 2050) | 11.8% reduction in carbon storage, 4.6% reduction in runoff retention, 9.4% increase in sediment export |
| Yunnan-Guizhou Plateau, China [16] | PLUS + InVEST | Varies by scenario (natural development, planning-oriented, ecological priority) | Ecological priority scenario demonstrated best performance across all services |
| Upper Zambezi Basin [44] | CA-Markov | 3.2 million hectare reduction in forest cover (2023-2043) | Land cover degradation driven by forest reduction for grassland, settlements, and cropland |
| Fujian Delta Region [45] | PLUS | Continued urban expansion westward and northward by 2050 | Increased landscape ecological risk, particularly from cropland to urban conversion |
Table 3: Essential Tools and Platforms for Land Change Modeling and Ecosystem Service Assessment
| Tool/Platform | Function | Application Context | Access |
|---|---|---|---|
| TerrSet/IDRISI | Integrated GIS with LCM module | Land Change Modeler implementation; CA-Markov simulations | Commercial |
| InVEST | Ecosystem service quantification | Modeling carbon storage, water yield, habitat quality, sediment retention | Open Source |
| QGIS with Trends.Earth | Land degradation assessment | Monitoring and projecting land degradation; SDG 15.3.1 reporting | Open Source |
| ARIES | Artificial Intelligence for Ecosystem Services | Rapid ecosystem service assessment and valuation | Open Source |
| Google Earth Engine | Cloud-based remote sensing platform | Land cover classification; time-series analysis | Freemium |
| R with raster/terra | Statistical analysis and spatial modeling | Driver analysis; model validation; data preprocessing | Open Source |
Scenario Design and Analysis Framework
Developing Plausible Future Scenarios
Scenario-based modeling represents a critical advancement beyond simple trend extrapolation, allowing researchers to "assess how LULC dynamics affect the future ecosystem" and "gain a deeper understanding of anthropogenic disturbance and conservation" [42]. Effective scenario design incorporates both quantitative projections and qualitative narrative elements.
Common Scenario Archetypes:
- Business-as-Usual: Extends current trends without major policy interventions
- Economic Development: Prioritizes growth, urbanization, and infrastructure
- Environmental Conservation: Implements protective measures and restoration
- Sustainable Planning: Seeks balance between development and conservation
In the Upper Awash Basin, the Governance scenario was "designed based on the 'Green Legacy Initiative', a government plan for conserving forest cover," while the Business-as-Usual scenario reflected a "national development policy named 'Path to Prosperity' that promoted new cities, industrial parks, and massive infrastructure construction" [42].
Integrating Shared Socioeconomic Pathways
The PLUS model has been effectively coupled with SSPs to enhance scenario consistency. In the Fujian Delta region, researchers "employed PLUS model coupled with multiple linear regression and a Markov chain model to project the landscape patterns in 2050" under localized SSP scenarios, finding that "localized SSP1 was projected to have the minimal risk, while the largest in SSP4" [45]. This integration provides a standardized framework for incorporating socioeconomic drivers into land change projections.
Predictive modeling using CA-Markov, LCM, and PLUS models provides powerful capabilities for projecting future land use changes and their impacts on ecosystem services. Each model offers distinct strengths: CA-Markov for its simplicity and ease of implementation, LCM for its robust neural network-based transition modeling, and PLUS for its fine-scale patch simulation capabilities. The integration of these land change models with ecosystem service assessment tools creates a comprehensive framework for evaluating the potential consequences of different development pathways.
As demonstrated by numerous case studies, these approaches enable researchers and policymakers to anticipate trade-offs between development and conservation objectives, providing critical insights for sustainable land use planning. The continued refinement of these models, particularly through incorporation of machine learning techniques and improved representation of human decision-making processes, will further enhance their utility in addressing the complex challenges of land use planning and ecosystem management in an era of global environmental change.
The analysis of driving forces behind land use changes and their impact on ecosystem services has entered a new era with the integration of advanced machine learning techniques. Among these, the combination of eXtreme Gradient Boosting (XGBoost) and SHapley Additive exPlanations (SHAP) has emerged as a powerful framework for quantifying complex, nonlinear relationships in ecological systems. This approach addresses critical limitations in traditional statistical methods, which often struggle to capture the intricate interactions between natural and anthropogenic factors that govern ecosystem service dynamics [46]. The "black box" nature of conventional machine learning models has historically impeded their application in ecological research, where understanding causal mechanisms is as important as prediction accuracy. The XGBooot-SHAP framework effectively bridges this gap by delivering both high predictive performance and transparent interpretability, enabling researchers to uncover the directional influences and threshold effects of various drivers on ecosystem services [8].
The application of this integrated framework is particularly valuable in land use change research, where complex interactions between climatic variables, socioeconomic factors, and ecosystem responses create challenges for traditional analytical approaches. By leveraging the strengths of XGBoost for handling complex, high-dimensional datasets and SHAP for generating human-interpretable explanations, researchers can now move beyond simple correlation analyses to identify causal pathways and nonlinear thresholds that dictate ecosystem behavior [47] [48]. This technical guide provides a comprehensive overview of the XGBoost-SHAP methodology, its implementation for driving force analysis in land use change studies, and its practical application within the broader context of ecosystem services research.
Theoretical Foundations and Technical Mechanisms
XGBoost: Architecture and Optimization
XGBoost (eXtreme Gradient Boosting) represents an advanced implementation of gradient boosted decision trees, engineered for computational efficiency and model performance. At its core, XGBoost utilizes an additive training strategy that sequentially builds an ensemble of weak prediction models (typically decision trees) to create a strong learner. Each subsequent tree aims to correct the residuals of the combined previous models, progressively minimizing a defined loss function through gradient descent. The algorithm's distinctive advantage lies in its regularization approach, which incorporates both L1 (Lasso) and L2 (Ridge) regularization terms within the objective function to control model complexity and prevent overfitting [46].
The mathematical formulation of the XGBoost objective function is as follows:
In this equation, L represents the differentiable loss function measuring the difference between the predicted (ŷᵢ) and actual (yᵢ) values, while Ω denotes the regularization term that penalizes model complexity. The parameters T and w refer to the number of leaves and leaf weights respectively, with γ and λ as configurable regularization parameters. This structured approach enables XGBoost to effectively handle diverse data types, missing values, and complex nonlinear relationships commonly encountered in land use change datasets [8] [47].
SHAP: Game-Theoretic Interpretability
SHAP (Shapley Additive exPlanations) provides a unified framework for interpreting machine learning model predictions based on cooperative game theory. The SHAP approach assigns each feature an importance value for a particular prediction, representing the feature's marginal contribution to the prediction outcome averaged across all possible feature combinations. The fundamental SHAP value calculation for a feature i is given by:
Where N is the set of all features, S is a subset of features excluding i, M is the total number of features, and f represents the model prediction. This formulation ensures that feature importance is allocated fairly according to each feature's marginal contribution across all possible coalitions [47]. For tree-based models like XGBoost, the TreeSHAP algorithm provides polynomial-time computation of SHAP values by leveraging the tree structure to efficiently evaluate feature subsets, making it computationally feasible for high-dimensional ecological datasets [46] [47].
XGBoost-SHAP Integration Synergy
The integration of XGBoost with SHAP creates a synergistic analytical framework that combines predictive power with interpretability. While XGBoost effectively captures complex nonlinear relationships and interaction effects between drivers of land use change, SHAP elucidates these relationships by quantifying and visualizing feature importance and directionality. This integration is particularly valuable for identifying threshold effects and nonlinear responses in ecosystem services, where small changes in driving factors can trigger disproportionate impacts once critical thresholds are exceeded [46]. For example, research on the Qinghai-Xizang Plateau demonstrated that interactions between temperature and precipitation exhibited positive effects on ecological environment quality, with SHAP interaction values increasing with rising precipitation levels [47].
Table 1: Key Advantages of XGBoost-SHAP Integration in Land Use Change Research
| Capability | Technical Benefit | Ecosystem Research Application |
|---|---|---|
| Nonlinear Pattern Recognition | Automatically captures complex relationships without pre-specified functional forms | Identifies threshold effects in ecosystem service responses to land use change |
| Feature Interaction Analysis | Quantifies higher-order interactions between driving factors | Reveals synergistic/antagonistic effects between climate and human activity drivers |
| Missing Data Robustness | Handles missing values through built-in imputation strategies | Accommodates common data gaps in long-term ecological monitoring datasets |
| Multi-Scale Analysis | Maintains performance across spatial and temporal scales | Enables cross-scale comparison of driving mechanisms from local to regional levels |
| Uncertainty Quantification | Provides confidence intervals for both predictions and explanations | Supports risk assessment in ecosystem management decisions |
Experimental Protocols and Implementation Framework
Data Preparation and Preprocessing
The implementation of XGBoost-SHAP for driving force analysis requires systematic data collection and preprocessing to ensure robust and interpretable results. Essential data inputs for land use change impact analysis typically include land cover classifications, climate variables, topographic data, soil properties, and socioeconomic indicators [8] [47]. Remote sensing data from platforms like Landsat, Sentinel-2, and MODIS provide critical input for deriving land use/land cover (LULC) maps and associated ecosystem service indicators. For example, studies on the Qinghai-Xizang Plateau utilized the China Land Cover Dataset (CLCD) with 30m spatial resolution, which demonstrated superior accuracy (79.31%) compared to other commonly used datasets like MCD12Q1 and ESACCCI_LC [8].
Key preprocessing steps include:
- Spatial harmonization: All raster datasets should be reprojected to a consistent coordinate system (e.g., UTM zones) and resampled to a uniform spatial resolution appropriate for the study scale (typically 1km for regional analyses) [47].
- Temporal alignment: For time-series analyses, data should be aggregated to consistent temporal intervals (annual, seasonal) across all variables.
- Missing data imputation: Gaps in temporal sequences should be addressed through appropriate interpolation methods (temporal linear interpolation, spatial kriging).
- Feature normalization: Continuous variables should be normalized or standardized to ensure comparable scales, particularly when using Euclidean distance-based algorithms.
Specialized preprocessing for ecosystem service assessment often involves calculating specific ecological indices such as the Remote Sensing-based Ecological Index (RSEI), which integrates greenness, humidity, dryness, and heat indicators through Principal Component Analysis [47]. The normalization formula for these indices follows: Nᵢ = (X - Xₘᵢₙ)/(Xₘₐₓ - Xₘᵢₙ), where Nᵢ represents the normalized value for the i-th index, X is the original value, and Xₘᵢₙ and Xₘₐₓ denote the minimum and maximum values respectively [47].
Model Training and Validation Protocol
The implementation of XGBoost requires careful configuration of hyperparameters to optimize model performance while avoiding overfitting. The following protocol outlines the key steps for model training and validation:
Data partitioning: Split the dataset into training (70%), validation (15%), and testing (15%) subsets using stratified sampling to maintain representative distribution of ecosystem service values across partitions.
Hyperparameter tuning: Utilize Bayesian optimization or grid search with k-fold cross-validation (typically k=5) to identify optimal hyperparameter combinations. Critical hyperparameters include:
- Learning rate (eta): Typically set between 0.01-0.3
- Maximum tree depth: Range of 3-10 depending on dataset size
- Subsample ratio: 0.7-0.9 for controlling overfitting
- Regularization parameters (lambda, alpha): 1.0-5.0
Model training: Implement the XGBoost algorithm with early stopping based on validation set performance to prevent overfitting. Monitor performance metrics (RMSE, MAE, R²) across training iterations.
Model validation: Assess predictive performance on the held-out test dataset using appropriate evaluation metrics. For ecological applications, spatial cross-validation is recommended to assess model generalizability across geographic regions [8].
SHAP value calculation: Apply the TreeSHAP algorithm to the trained XGBoost model to compute SHAP values for each observation in the dataset. This provides both global feature importance and local explanation capabilities.
The validation process should include sensitivity analysis to assess model robustness to input data uncertainty, particularly for ecological variables derived through remote sensing with inherent classification errors [8].
Interpretation Framework for Driving Force Analysis
The interpretation of XGBoost-SHAP results involves multiple analytical perspectives to comprehensively understand driving mechanisms:
Global feature importance: Calculate mean absolute SHAP values across the dataset to rank drivers by their overall contribution to ecosystem service variations.
Directionality analysis: Examine the relationship between feature values and their SHAP values to determine whether influences are positive, negative, or nonlinear.
Interaction effects: Compute SHAP interaction values to identify and quantify feature interdependencies using the following formulation:
ϕᵢ,ⱼ = Σ_{S ⊆ N\{i,j}} [|S|!(M-|S|-2)!/2(M-1)!] δᵢⱼ(S)whereδᵢⱼ(S)represents the interaction effect when both featuresiandjare present [47].Threshold detection: Identify critical thresholds in driving factors by analyzing abrupt changes in SHAP value relationships, such as the precipitation threshold of 17mm identified for WY-SC trade-offs in Wensu County [46].
Spatial explicit interpretation: Map SHAP values geographically to visualize spatial variations in driver influences, enabling identification of region-specific mechanisms.
Figure 1: XGBoost-SHAP Analytical Workflow for Driving Force Analysis
Applications in Land Use Change and Ecosystem Services Research
Case Study Applications
The XGBoost-SHAP framework has demonstrated significant utility across diverse ecological contexts, providing insights into the complex drivers of ecosystem service dynamics. In Wensu County, Xinjiang (China), researchers applied this approach to analyze trade-offs and synergies between key ecosystem services from 1990 to 2020 [46]. The study revealed that water yield (WY) and soil conservation (SC) exhibited an inverted "N"-shaped downward trend, while windbreak and sand fixation (WS) showed an "N"-shaped increase. The XGBoost-SHAP analysis identified land use type, precipitation, and temperature as dominant drivers of these trade-offs, demonstrating nonlinear responses and threshold effects. Specifically, WY-SC trade-offs intensified when precipitation exceeded 17mm, while temperature thresholds governed transitions between trade-off and synergy relationships in WY-HQ interactions [46].
On the Qinghai-Xizang Plateau, the framework was employed to examine impacts of land use and cover changes on habitat quality (HQ) [8]. The study found that approximately 7.5% of the land area underwent significant transformation, with notable grassland degradation. Forest land was identified as having the greatest impact on habitat quality changes through XGBoost-SHAP analysis. The relationship between land use changes and habitat quality showed a trend toward coordinated development, with a 50:1 ratio of coordination to conflict evolution. Natural factors emerged as primary drivers of these relationships, followed by socio-cultural factors [8].
Another application on the Tibetan Plateau utilized XGBoost-SHAP to analyze ecological environment quality (EEQ) dynamics from 2000 to 2022 [47]. The Remote Sensing-based Ecological Index (RSEI) served as the response variable, with analyses revealing temperature, soil moisture, and precipitation as the most influential factors based on their SHAP values. The interaction between temperature and precipitation showed positive effects on RSEI, with SHAP interaction values increasing with rising precipitation levels [47].
Table 2: Key Findings from XGBoost-SHAP Applications in Ecosystem Services Research
| Study Area | Ecosystem Services Analyzed | Primary Drivers Identified | Threshold Effects Discovered |
|---|---|---|---|
| Wensu County, China [46] | Water yield, Soil conservation, Windbreak/sand fixation, Habitat quality | Land use type, Precipitation, Temperature | Precipitation >17mm intensified WY-SC trade-offs; Temperature thresholds governed WY-HQ relationships |
| Qinghai-Xizang Plateau [8] | Habitat quality, Land use functions | Forest cover, Elevation, Temperature, NDVI | Coordination-conflict transitions driven by natural factor thresholds |
| Tibetan Plateau [47] | Ecological Environment Quality (RSEI) | Temperature, Soil moisture, Precipitation | Positive temperature-precipitation interactions with increasing precipitation |
| Heihe River Basin [48] | Production, Living, Ecological functions | DEM, Temperature, NDVI, Precipitation, Land use intensity | Interactions between NDVI, temperature, DEM and land use intensity most substantial |
Comparative Analysis with Traditional Methods
The XGBoost-SHAP framework offers significant advantages over traditional statistical approaches commonly used in land use change research. Conventional methods such as correlation analysis, redundancy analysis, and geographic detectors have limitations in capturing complex nonlinear relationships and interaction effects among driving factors [46]. While correlation methods (Spearman's, Pearson's) are widely used to identify trade-offs and synergies between ecosystem services, they generally fail to control for the effects of other variables and are sensitive to nonlinear relationships and outliers, potentially leading to spurious correlations or inaccurate causal judgments [46].
Partial correlation analysis offers some improvement by examining relationships between two correlated variables while controlling for other factors, enabling more objective analysis of trade-off synergies between ecosystem services [46]. However, this approach still struggles with the complex, high-dimensional interactions characteristic of socio-ecological systems. Similarly, the root-mean-square deviation (RMSD) method can consider interactions between multiple ecosystem services while addressing uneven co-directional changes, but provides limited insight into the underlying driving mechanisms [46].
In contrast, XGBoost-SHAP simultaneously addresses multiple analytical challenges: (1) automatically capturing nonlinear relationships without pre-specified functional forms; (2) quantifying interaction effects between multiple drivers; (3) providing both global and local interpretations of driving mechanisms; and (4) identifying critical thresholds in driver-response relationships. This comprehensive capability makes it particularly suitable for analyzing the complex, multifactorial processes governing land use change impacts on ecosystem services [46] [8] [47].
Data Acquisition and Processing Tools
Successful implementation of XGBoost-SHAP for driving force analysis requires access to diverse data sources and specialized processing tools. The Google Earth Engine (GEE) platform has emerged as a critical resource for large-scale ecological analyses, providing capabilities for remote sensing data acquisition, cloud removal, image mosaicking, clipping, resampling, and projection [47]. For land cover classification, several pretrained deep learning models are available through ArcGIS Living Atlas, including models optimized for high-resolution imagery (NAIP), medium-resolution (Sentinel-2 at 10m), and low-resolution (Landsat 8 at 30m) data [49].
The China Land Cover Dataset (CLCD) provides a valuable resource for studies in Asian regions, offering 30m spatial resolution with continuous coverage spanning three decades and an overall accuracy of 79.31% [8]. For ecosystem service assessment, the InVEST (Integrated Valuation of Ecosystem Services and Tradeoffs) model provides specialized modules for quantifying habitat quality, water yield, soil conservation, and other key services [8].
Table 3: Essential Research Reagents and Computational Tools for XGBoost-SHAP Implementation
| Tool Category | Specific Solutions | Primary Function | Application Context |
|---|---|---|---|
| Remote Sensing Platforms | Google Earth Engine, ArcGIS Living Atlas | Large-scale geospatial data processing and analysis | Acquisition and preprocessing of land use/cover data and ecological indices |
| Land Cover Datasets | China Land Cover Dataset (CLCD), MODIS Land Cover, National Land Cover Database (NLCD) | Providing historical and current land use/land cover classifications | Baseline data for assessing land use change and its impacts |
| Ecosystem Service Models | InVEST HQ module, RSEI calculations | Quantifying habitat quality and other ecosystem services | Generating response variables for driving force analysis |
| Machine Learning Libraries | XGBoost Python package, SHAP library | Implementing the core analytical algorithms | Model training, prediction, and interpretation |
| Spatial Analysis Tools | ArcGIS, QGIS, GDAL | Geographic data manipulation and visualization | Spatial data preprocessing, analysis, and result mapping |
| Climate Data Sources | WorldClim, CHIRPS, TerraClimate | Providing precipitation, temperature, and other climatic variables | Key explanatory variables in ecosystem service drivers |
Computational Implementation Considerations
The computational implementation of XGBoost-SHAP requires careful consideration of several technical factors. For regional-scale analyses, spatial resampling to 1km resolution typically provides an optimal balance between computational efficiency and ecological relevance [47]. The XGBoost algorithm efficiently handles missing values through its built-in sparsity-aware split finding, reducing the need for extensive imputation during preprocessing. However, for time-series analyses of land use change, careful temporal alignment of all variables is essential to ensure valid causal inferences.
For large-scale analyses, such as those encompassing the entire Tibetan Plateau, the dataset may comprise over 10,000 sample points [47]. In such cases, distributed computing approaches or sampling strategies may be necessary to manage computational demands. The TreeSHAP algorithm, while computationally efficient compared to other SHAP approximation methods, still requires significant processing time for large datasets with many features and interactions.
Visualization of results represents another critical implementation consideration. SHAP summary plots, dependence plots, and interaction plots provide powerful tools for communicating findings to diverse audiences. For spatial explicit interpretations, mapping SHAP values enables identification of geographic patterns in driver influences, facilitating region-specific policy recommendations [8] [47].
Figure 2: XGBoost-SHAP Interpretation Mechanics and Output Generation
The integration of XGBoost and SHAP represents a significant advancement in driving force analysis for land use change and ecosystem services research. This powerful combination addresses fundamental limitations of traditional statistical methods by simultaneously providing high predictive accuracy and human-interpretable explanations of complex ecological processes. The ability to identify nonlinear relationships, interaction effects, and critical thresholds in driver-response relationships offers unprecedented insights for ecosystem management and land use planning.
Future developments in this field will likely focus on several key areas: (1) enhanced temporal dynamics modeling to better capture lagged effects and feedback loops in land use-ecosystem service relationships; (2) integration with process-based ecological models to combine mechanistic understanding with data-driven pattern recognition; (3) improved uncertainty quantification for both predictions and explanations to support risk-aware decision making; and (4) development of more efficient computational approaches for ultra-high-resolution analyses across large spatial extents.
As ecological datasets continue to grow in size and complexity, the XGBoost-SHAP framework provides a robust analytical foundation for unraveling the multifaceted drivers of ecosystem change. Its application to pressing environmental challenges, from biodiversity conservation to climate change adaptation, will undoubtedly yield critical insights for designing sustainable land management strategies in an increasingly human-modified world.
This technical guide provides researchers and environmental professionals with a comprehensive framework for applying the TEEB (The Economics of Ecosystems and Biodiversity) database and Ecosystem Service Value (ESV) coefficient methods in land use change impact research. As global ecosystems face unprecedented pressure from anthropogenic activities, quantifying the economic value of ecosystem services has become critical for sustainable decision-making. This whitepaper synthesizes current methodologies, datasets, and analytical protocols for integrating economic valuation into ecosystem service assessments, with particular emphasis on spatial and temporal analysis of land use change impacts. We present standardized approaches for value transfer applications, biophysical modeling integration, and trend analysis to support evidence-based policy development in conservation and resource management.
Ecosystem services refer to the direct and indirect benefits that humans receive from natural ecosystems, including provisioning services (e.g., food, water), regulating services (e.g., climate regulation, water purification), cultural services (e.g., recreation, aesthetic values), and supporting services (e.g., nutrient cycling, soil formation) [50]. The conceptual foundation for ecosystem service valuation emerged from the recognition that these critical benefits are typically excluded from traditional economic accounting systems, leading to their systematic undervaluation in policy decisions. The TEEB initiative (2008-2010) formally established a global framework for addressing this "economic invisibility of nature" by developing standardized approaches to ecosystem service valuation.
Within land use change research, ecosystem service valuation provides a critical mechanism for quantifying the trade-offs associated with converting natural landscapes to anthropogenic uses. By assigning economic values to ecosystem services, researchers and policymakers can more effectively evaluate how alterations to terrestrial and aquatic ecosystems impact human well-being through changes in service provision [29]. The TEEB database and ESV coefficient methods represent two complementary approaches for integrating economic considerations into environmental impact assessments, development planning, and natural resource management strategies.
The TEEB Valuation Database: Architecture and Application
Database Structure and Evolution
The TEEB Valuation Database, initially released in 2010, was developed as a comprehensive repository of economic values for ecosystem services globally [51]. The database has since evolved into the Ecosystem Services Valuation Database (ESVD), which currently represents the largest publicly available database of standardized monetary values for ecosystem services across all biomes and continents [52]. The ESVD contains over 10,800 value records drawn from more than 1,355 individual studies spanning 30 years of peer-reviewed academic research and official reports [52]. All values within the database are standardized to international dollars per hectare per year (Int$/ha/year) at 2020 price levels to enable comparative analysis and value transfer applications [53].
The database architecture organizes values according to biome type (15 terrestrial and marine categories), ecosystem service type (23 distinct services), and geographical context. This structured organization enables researchers to identify appropriate valuation data based on specific ecosystem characteristics and service flows relevant to their study area. The continuous expansion and refinement of the database through ongoing research synthesis ensures that it remains representative of current valuation literature, though geographical gaps persist, particularly for Russia, Central Asia, and North Africa [53].
Data Standardization Protocol
A critical technical aspect of the TEEB database is its rigorous standardization protocol, which enables comparative analysis across diverse valuation studies. The standardization process involves three key transformations:
Currency Conversion: All monetary values are converted to a common currency unit (International Dollars) using purchasing power parity (PPP) conversion factors rather than market exchange rates to account for differences in price levels between countries.
Temporal Adjustment: Values are adjusted for inflation to a common reference year (2020) using appropriate price indices to reflect equivalent purchasing power across time.
Spatial Normalization: Value estimates are expressed per unit area (hectare) per year to facilitate spatial scaling and transfer to different geographical contexts.
This multi-stage standardization process creates a consistent metric (Int$/ha/year) that enables valid comparison and synthesis of values derived from different methodological approaches, temporal contexts, and currency denominations [53].
Practical Application in Land Use Change Research
For land use change impact studies, the TEEB database enables researchers to estimate economic consequences of ecosystem transformation through value transfer methods. The typical application protocol involves:
Biome-Service Matching: Identifying relevant biome classifications and ecosystem services in the study area.
Value Selection: Extracting appropriate value ranges from the database based on biome-service combinations, with consideration of geographic and ecological comparability.
Spatial Scaling: Applying unit values to the areal extent of ecosystems within the study region.
Impact Assessment: Calculating value changes associated with land use transitions by comparing pre- and post-change scenarios.
This approach has been successfully applied in diverse contexts, including official development assistance appraisal by the UK Department for Environment, Food & Rural Affairs, and corporate natural capital accounting by the International Foundation for Valuing Impacts [52].
Table 1: Illustrative Ecosystem Service Values from the TEEB Database (Int$/ha/year)
| Biome | Service Category | Service Type | Value Range | Key Service Drivers |
|---|---|---|---|---|
| Mangroves | Regulating | Coastal Protection | 217,000 (mean) | Storm buffering, erosion control [52] |
| Coral Reefs | Cultural & Provisioning | Tourism & Fisheries | 375 billion (global annual) | Recreation, fish biomass [52] |
| Forests | Regulating | Climate Regulation | 1,000-5,000 | Carbon sequestration, climate moderation [53] |
| Wetlands | Regulating | Water Purification | 15,000-25,000 | Nutrient retention, water quality [53] |
| Grasslands | Provisioning | Forage Production | 500-2,000 | Biomass production, livestock support [54] |
ESV Coefficient Methods: Theoretical Foundation and Calculation
The Equivalent Factor Methodology
The ESV coefficient method, pioneered by Costanza et al. (1997) and refined by Xie et al. (2015), employs a standardized equivalency factor system to assign relative weights to different ecosystem services based on their perceived importance [4] [50]. The fundamental premise of this approach is that different ecosystem types generate varying levels of service provision per unit area, which can be represented through a consistent scaling system relative to a baseline value (typically the value of annual food production from one hectare of farmland) [4].
The equivalent factor table developed by Xie et al. for Chinese ecosystems represents one of the most systematically applied frameworks, with 11 primary ecosystem service categories grouped under four main service types: provisioning, regulating, supporting, and cultural services [4]. Each ecosystem type (forest, grassland, farmland, wetland, water bodies, and barren land) is assigned a specific coefficient for each service category, representing its relative capacity to provide that service compared to the baseline farmland productivity value.
Spatial Adjustment Protocols
A critical advancement in ESV coefficient methodology has been the development of spatial adjustment protocols to account for regional variations in ecosystem productivity and service provision. Rather than applying uniform coefficients across diverse geographical contexts, researchers now incorporate spatially explicit adjustment factors based on biophysical parameters [4]. The standard spatial adjustment formula is:
ESVij = VCj × Ak × (fNPP × fPRE × fSOC × fHAB)
Where:
- ESVij = Value of service j in grid cell k
- VCj = Standard value coefficient for service j
- Ak = Area of grid cell k
- fNPP = Adjustment factor based on Net Primary Productivity
- fPRE = Adjustment factor based on precipitation patterns
- fSOC = Adjustment factor based on soil organic carbon
- fHAB = Adjustment factor based on habitat quality
This spatially explicit approach significantly improves valuation accuracy by capturing intra-regional heterogeneity in ecosystem function and service provision [4]. For example, in the Huaihai Economic Zone study, spatial adjustment revealed significant variations in ESV that would have been obscured using uniform coefficients [4].
Land Use Change Impact Quantification
The ESV coefficient method enables direct quantification of land use change impacts through spatial-temporal analysis. The standard analytical workflow involves:
Land Use Classification: Categorizing historical and contemporary land use/cover data using remote sensing imagery.
Change Detection Analysis: Quantifying transitions between land use categories over specified time periods using land use transfer matrices.
ESV Calculation: Applying value coefficients to each land use category and computing total ESV for different time periods.
Change Attribution: Linking specific land use transitions to ESV gains or losses through profit-loss accounting.
This methodology was effectively demonstrated in Laos, where researchers analyzed 20 years of land use change and found that despite forest conversion to cultivated land, overall ESV increased by USD 3.94 million due to simultaneous expansion of water bodies [50].
Table 2: Standard Equivalent Factors for Terrestrial Ecosystems (Based on Xie et al. Methodology)
| Ecosystem Type | Food Production | Climate Regulation | Water Conservation | Soil Formation | Biodiversity | Total Equivalent Value |
|---|---|---|---|---|---|---|
| Farmland | 1.00 | 0.49 | 0.34 | 1.39 | 0.34 | 4.96 |
| Forest | 0.08 | 2.29 | 2.31 | 1.81 | 2.12 | 13.74 |
| Grassland | 0.21 | 0.78 | 0.74 | 1.15 | 0.89 | 5.81 |
| Wetland | 0.23 | 1.92 | 5.10 | 1.66 | 2.01 | 20.33 |
| Water Bodies | 0.69 | 0.59 | 5.35 | 0.03 | 1.66 | 15.86 |
| Barren Land | 0.00 | 0.02 | 0.03 | 0.02 | 0.11 | 0.38 |
Integrated Methodological Workflow
The integration of TEEB database values with ESV coefficient methods creates a robust framework for comprehensive ecosystem service assessment in land use change research. The following workflow diagram illustrates the sequential protocol for applying these approaches in tandem:
Diagram 1: Integrated ESV Assessment Workflow
Land Use Change Analysis Protocol
The initial phase of the integrated workflow involves comprehensive land use change detection and analysis:
Data Acquisition: Obtain multi-temporal land use/land cover data from satellite imagery (e.g., Landsat, Sentinel) or global databases (e.g., GlobeLand30) at appropriate spatial resolution (typically 30m) for the study area [50].
Land Use Classification: Classify imagery into standardized land use categories (forest, grassland, farmland, wetland, water bodies, built-up land, barren land) using supervised classification algorithms with validation through field surveys or high-resolution imagery.
Change Detection Analysis: Quantify transitions between land use categories using land use transfer matrices to identify dominant conversion pathways and rates of change. The land use transfer matrix is calculated as:
Sij = [S11 S12 ... S1n; S21 S22 ... S2n; ... ; Sn1 Sn2 ... Snn]
Where Sij represents the area transformed from land use type i to type j during the study period [50].
Change Intensity Assessment: Calculate the dynamic degree of land use change to identify hotspots of transformation using the formula:
K = (Ub - Ua) / Ua × 1/T × 100%
Where K is the dynamic degree, Ua and Ub are the areas of a specific land use type at the beginning and end of the study period, and T is the time interval in years [4].
Biome-Service Mapping and Value Transfer
The core valuation phase involves mapping ecosystem services to land use categories and applying appropriate economic values:
Biome-Service Matrix Development: Create a cross-walk table linking each land use category in the study area to corresponding biome classifications in the TEEB database and equivalent factors in the ESV coefficient system.
TEEB Value Extraction: Query the TEEB database for value ranges corresponding to the identified biome-service combinations, filtering for geographical relevance where possible.
ESV Coefficient Adjustment: Apply spatial adjustment factors to standard equivalent values based on local biophysical conditions, including Net Primary Productivity (NPP), precipitation patterns, soil characteristics, and habitat quality [4].
Uncertainty Accounting: Implement sensitivity analysis and Monte Carlo simulation to address value uncertainty, particularly for benefit transfer applications across disparate geographical contexts.
Integrated Modeling and Impact Assessment
The final analytical phase integrates the valuation approaches to quantify land use change impacts:
Baseline ESV Calculation: Compute total ecosystem service value for the initial time period using both TEEB and adjusted ESV coefficient approaches.
Scenario Analysis: Project ESV under different land use scenarios, including business-as-usual, conservation-focused, and development-oriented pathways [29] [54].
Change Attribution: Quantify the contribution of specific land use transitions to overall ESV change using improved cross-sensitivity coefficients (CICS) [4].
Spatial Pattern Analysis: Apply exploratory spatial data analysis, including global and local spatial autocorrelation statistics, to identify clusters of ESV gain and loss across the study landscape [4].
Table 3: Essential Research Tools for Ecosystem Service Valuation
| Tool/Resource | Function | Data Format | Access Point |
|---|---|---|---|
| TEEB/ESVD Database | Standardized economic values for ES | Excel/CSV, Online query | esvd.info [52] |
| GlobeLand30 | 30m resolution global land cover data | Raster (GeoTIFF) | globeland30.org [50] |
| InVEST Model | Integrated ecosystem service mapping | Python-based suite | naturalcapitalproject.stanford.edu [55] |
| ArcGIS/QGIS | Spatial analysis and mapping | Software platform | Commercial/Open Source |
| MODIS NPP Products | Net Primary Productivity data | Raster (HDF) | NASA Earthdata |
| Value Transfer Tool | Adjusted benefit transfer application | Excel-based calculator | TEEB/ESVD platform [51] |
Advanced Applications in Land Use Change Research
Scenario Modeling and Future Projections
Advanced applications of TEEB and ESV methods involve projecting future impacts of land use and climate change on ecosystem services. As demonstrated in the Austrian Alps, scenario analysis can quantify how different socioeconomic pathways and climate projections might affect the resilience of ecosystem services [54]. The standard protocol involves:
Scenario Development: Creating narrative scenarios representing alternative futures (e.g., business-as-usual, sustainable development, rapid economic growth).
Land Use Projection: Modeling future land use patterns using cellular automata, agent-based models, or other simulation approaches.
Climate Integration: Incorporating climate change projections (temperature, precipitation) to assess impacts on ecosystem productivity and function.
Resilience Assessment: Evaluating the capacity of ecosystem services to maintain function under changing conditions through time-series analysis and threshold detection.
Research in the European Alps indicates that socioeconomically driven land-use changes will predominantly influence ecosystem services until 2050, while climate change will emerge as the primary driver after 2050, leading to both increases and decreases in resilience potential across different services [54].
Human Well-Being Linkages
The most sophisticated applications of ESV methods extend beyond economic valuation to examine impacts on multi-dimensional human well-being. The Human Well-Being Index (HWBI) framework quantitatively links ecosystem services to eight domains of well-being: Connection to Nature, Cultural Fulfillment, Education, Health, Leisure Time, Living Standards, Safety and Security, and Social Cohesion [29]. The analytical approach involves:
Indicator Development: Creating quantitative metrics for each well-being domain using census, survey, and observational data.
Relationship Modeling: Applying regression analysis to establish statistical relationships between ecosystem service indicators and well-being domains.
Pathway Analysis: Tracing how changes in specific ecosystem services (e.g., water purification, air filtration) affect multiple well-being dimensions through ecological benefits functions.
This approach was successfully implemented in the Pensacola Bay watershed, Florida, where researchers quantified how land use changes would impact well-being through alterations in ecosystem service flows [29]. The following diagram illustrates the complex relationships between ecosystem services and human well-being domains:
Diagram 2: Ecosystem Services to Human Well-Being Pathways
The TEEB database and ESV coefficient methods provide complementary, robust approaches for integrating economic valuation into land use change impact research. When applied through standardized protocols incorporating spatial adjustment and uncertainty analysis, these methods enable researchers to quantify the often-overlooked economic consequences of ecosystem transformation. The continuous expansion of valuation databases and refinement of coefficient methods promises to further enhance the accuracy and applicability of these approaches across diverse geographical contexts.
For effective implementation, researchers should prioritize spatial explicitness in analysis, consider both market and non-market values, account for scale dependencies in service provision, and integrate findings with human well-being frameworks. As demonstrated in diverse case studies from China to the European Alps, these valuation approaches provide critical evidence to support sustainable land management decisions that balance development needs with the conservation of essential ecosystem services.
Navigating Uncertainty: Best Practices for Robust Modeling and Impact Mitigation
In land use and land cover (LULC) change research, accurately projecting future scenarios and valuing their impact on ecosystem services (ES) remains a formidable challenge. The intricate relationship between human-driven land transformation and ecological functions necessitates robust modeling approaches, yet persistent limitations undermine the reliability and applicability of research findings. As global biodiversity hotspots face unprecedented threats and ecosystems undergo rapid degradation, the scientific community must confront these methodological constraints head-on [56]. This technical guide examines the common pitfalls in LULC projection and ecosystem service valuation (ESV) within the broader context of land use change impact research, providing researchers with advanced frameworks to enhance methodological rigor. By addressing these limitations directly, scientists can generate more credible evidence for policymakers tasked with balancing development needs with ecological preservation in an era of environmental crisis [56] [57].
Fundamental Limitations in LULC Projection Models
Spatial and Temporal Scale Inadequacies
A critical limitation in LULC projection involves the mismatch between model scales and ecological processes. Many studies apply uniform spatial and temporal resolutions that fail to capture the heterogeneity of landscape transformations or the lagged responses of ecosystem functions. Research in Ethiopia's Giba basin demonstrated significant LULC transformations over 60 years, with settlements increasing by 7700% and barren land declining by 80% between 1984-2024 [58]. Such rapid changes necessitate temporal scales sensitive to both gradual trends and abrupt transitions. Spatially, models often overlook the hierarchical organization of landscape patterns, where fine-scale processes influence broader ecosystem functions. The complex topography of regions like Kishtwar High Altitude National Park in India demands multi-scalar approaches that accommodate elevation gradients and their differential impact on LULC change trajectories [56].
Policy and Human Behavior Oversights
Conventional LULC models frequently neglect the constraining or facilitating effects of policy frameworks and human decision-making processes. Studies that rely solely on historical change trends without incorporating policy spatial constraints produce projections with limited practical utility for land use planning [59]. The integration of detailed planning zones (DPZ) with satellite imagery has emerged as a pivotal methodology for detecting and assessing LULC changes while accounting for regulatory frameworks [56]. In Yunnan Province, China, researchers addressed this gap by incorporating ecological red line policies and basic farmland protection policies into their PLUS model simulations, creating more policy-relevant scenario projections for 2030 [59]. Human behavior—including economic motivations, cultural practices, and response to incentives—introduces additional complexity that often remains unquantified in standard modeling approaches.
Table 1: LULC Projection Model Limitations and Manifestations
| Limitation Category | Specific Pitfalls | Common Manifestations | Impact on Projection Accuracy |
|---|---|---|---|
| Scale Issues | Uniform spatial resolution | Failure to capture fine-scale fragmentation patterns | Underestimation of edge effects on ecosystems |
| Infrequent temporal intervals | Missed rapid transition events | Inaccurate change trajectory modeling | |
| Human Behavior Representation | Simplified decision rules | Exclusion of cultural land use preferences | Overestimation of economically "optimal" conversions |
| Static demographic assumptions | Unchanging population pressure scenarios | Inaccurate demand projections for settlement expansion | |
| Policy Integration | Neglect of regulatory constraints | Projected development in protected zones | Non-implementable scenario outcomes |
| Fixed economic parameters | Unchanging commodity prices and market conditions | Misplaced agricultural expansion/contraction | |
| Validation Approaches | Short-term calibration | Limited historical validation period | Reduced confidence in long-term projections |
| Single metric evaluation | Focus solely on overall accuracy without class-specific assessment | Undetected errors in critical LULC classes |
Technical and Computational Constraints
The technical architecture of LULC models presents additional limitations, particularly regarding the handling of non-stationarity in change processes and the integration of uncertainty analysis. Many models assume stationarity—that future changes will follow historical patterns—despite evidence that climate change, technological disruption, and socio-economic shifts increasingly invalidate this assumption [58] [31]. The Cellular Automata (CA)–Markov model, while popular for its simplicity, has recognized limitations in simulating long-term, complex transitions, making it more suitable for short-term projections [58]. Newer approaches like the Patch-Generating Land Use Simulation (PLUS) model demonstrate improved handling of non-linear transitions but require more sophisticated parameterization [59] [57]. Computational constraints further limit the ability to run extensive sensitivity analyses or ensemble modeling approaches that would better characterize uncertainty ranges in projections.
Critical Challenges in Ecosystem Service Valuation
Coefficient Transferability and Regional Specificity
The application of globally-derived valuation coefficients without regional adjustment represents a fundamental flaw in many ESV studies. Research in the Huaihai Economic Zone (HEZ) demonstrated that spatial adjustments to equivalent factors based on local biophysical and socioeconomic conditions significantly improve valuation accuracy [4]. The common practice of directly applying the global value coefficient method, as seen in the Kishtwar High Altitude National Park study, fails to capture regional variations in ecosystem service scarcity, quality, or socio-cultural context [56]. This approach implicitly assumes uniform productivity and value across geographically disparate ecosystems, potentially leading to substantial valuation errors. The development of regionally calibrated equivalence factor tables, such as those pioneered by Chinese researchers, represents an important advancement in addressing this limitation [59] [4].
Exclusion of Built-up Land and Synergistic Relationships
A pervasive simplification in ESV methodology involves the exclusion of ecosystem services provided by built-up lands, typically assigning them zero value. This assumption ignores the fact that built-up land participates in material and energy exchanges within ecosystems and provides certain services [59]. Recent studies have begun incorporating the unit ESVs of built-up land into assessment systems to improve valuation comprehensiveness [59]. Similarly, the failure to account for synergistic and trade-off relationships between different ecosystem services leads to inaccurate valuation summations. Research in central Yunnan Province (CYP) revealed that ERs associated with ecosystem service types are mainly synergistic, creating ripple effects that conventional valuation approaches miss [57]. The Integrated Valuation of Ecosystem Services and Trade-offs (InVEST) model provides a framework for analyzing these relationships but requires extensive parameterization [57].
Table 2: Ecosystem Service Valuation Challenges and Methodological Responses
| Valuation Challenge | Common Methodological Flaws | Advanced Approaches | Data Requirements |
|---|---|---|---|
| Value Transfer | Direct application of global coefficients | Spatially adjusted equivalence factors based on local NPP, rainfall, etc. | Regional biophysical data; crop price statistics |
| Built-up Land Exclusion | Assignment of zero value to urban ecosystems | Inclusion of cultural services and limited regulating services from built areas | Urban green space mapping; recreation opportunity quantification |
| Synergy & Trade-off Neglect | Simple summation of individual service values | Geographically weighted regression to analyze spatial relationships | Multiple simultaneous ES measurements; spatial statistics |
| Dynamic Valuation | Static valuation assuming constant unit values | Temporal adjustment based on scarcity, quality, and demand changes | Time series of ecosystem condition and socio-economic indicators |
| Scale Mismatch | Valuation at single scale inconsistent with service flows | Multi-scale assessment differentiating point-of-service from benefit area | Service-specific spatial analysis of flow mechanisms |
Dynamic Valuation and Socioeconomic Integration
Most ESV studies employ static valuation approaches that fail to capture how ecosystem service values evolve with changing socioeconomic conditions, technological advancements, and relative scarcity. The study in Ethiopia's upper Gilgel Abbay watershed demonstrated significant ESV fluctuations over time, with values decreasing from 7.42×10⁷ to 6.44×10⁷ USD between 1986-2003, then increasing to 7.76×10⁷ USD by 2021 due to forest and shrubland changes [60]. These dynamics highlight the limitations of cross-sectional valuation approaches. Furthermore, conventional methods often neglect the complex relationships between ES supply and demand, particularly spatial mismatches where service provision areas don't align with beneficiary populations. Emerging approaches incorporate demand dynamics through metrics like the supply-demand ratio, though these introduce additional forecasting challenges [57].
Integrated Methodological Frameworks and Experimental Protocols
Advanced LULC Modeling Workflows
To address the limitations in conventional LULC projection, researchers should adopt integrated modeling workflows that combine multiple approaches:
CA-ANN (Cellular Automata-Artificial Neural Network) Protocol: For the Giba basin in Ethiopia, researchers applied Landsat imagery from 1984, 2004, 2014, and 2024 to develop historical LULC maps. The CA-ANN model was then implemented using the MOLUSCE plugin in QGIS, which includes artificial neural networks, weights of evidence, multi-criteria evaluation, and logistic regression to establish transition potential. The final simulation generated LULC projections for 2034 and 2044 based on Monte Carlo cellular automata [58]. This approach demonstrated higher accuracy compared to conventional classification methods and better addressed future uncertainties.
Multi-Scenario PLUS Model Framework: In Yunnan Province, researchers developed a comprehensive protocol incorporating policy spatial constraints: (1) Collect LULC data (2005-2020), topographic data, meteorological data, road networks, NDVI, population, and GDP; (2) Define scenario-specific transition rules based on ecological red lines, farmland protection policies, and urban growth boundaries; (3) Implement the Markov-PLUS model to simulate LULC under natural development, ecological conservation, and farmland conservation scenarios; (4) Validate model performance using historical periods before generating 2030 projections [59]. This approach successfully quantified how different policy priorities redirect land change trajectories.
Figure 1: Advanced LULC Modeling Workflow Integrating Policy Constraints
Comprehensive ESV Assessment Methodology
A robust ESV assessment protocol should address common valuation pitfalls through these methodological steps:
Spatially Adjusted Equivalence Factor Method: For the Huaihai Economic Zone, researchers implemented a comprehensive valuation approach: (1) Collect land use data (1995-2020), NPP data (2000-2010), rainfall data (2000-2015), soil erosion data (2005), and road density data (2010-2015); (2) Calculate regional equivalent factors based on grain yield, planting area, and crop price data from statistical yearbooks; (3) Spatially adjust equivalence factors using NPP, rainfall, soil erosion, and recreation accessibility data; (4) Estimate ESV at grid scale to capture spatial heterogeneity; (5) Develop improved cross sensitivity (CICS) coefficients to quantify linkage between land use and ESV [4]. This protocol demonstrated enhanced accuracy in regional ESV estimation.
Ecosystem Service Degradation Risk Assessment: In central Yunnan Province, researchers combined PLUS and InVEST models to assess ecological risks: (1) Use PLUS model to predict future LULC under different scenarios; (2) Apply InVEST model to calculate ecosystem services from 2000-2020 and project future services; (3) Calculate ecological risks (ERs) caused by LULC changes for various ES types; (4) Analyze trade-off and synergy relationships between different ERs using Pearson correlation and geographically weighted regression; (5) Identify driving factors using geographic detector method [57]. This integrated approach enabled comprehensive risk assessment linked to specific land change processes.
Figure 2: ESV Assessment and Validation Framework
The Scientist's Toolkit: Essential Research Reagents and Solutions
Table 3: Key Research Reagents and Computational Tools for LULC-ESV Research
| Tool Category | Specific Solutions | Function | Application Context |
|---|---|---|---|
| Remote Sensing Data | Landsat TM/ETM+/OLI | Multi-spectral earth observation | Historical LULC change detection (30m resolution) |
| Sentinel-2 MSI | High-resolution land monitoring | Detailed vegetation and urban feature classification | |
| LISS-III | Medium-resolution imaging | Regional-scale LULC mapping in specific geographies | |
| Modeling Platforms | MOLUSCE QGIS Plugin | Modular land use change evaluation | CA-ANN implementation with transition probability |
| PLUS Model | Patch-generating land use simulation | Multi-scenario LULC projection with policy constraints | |
| InVEST Model | Integrated ecosystem service valuation | Spatial quantification of multiple ecosystem services | |
| Validation Tools | Geographically Weighted Regression | Spatial relationship analysis | Identifying non-stationary correlations in ES relationships |
| Geographic Detector Method | Driving factor analysis | Quantifying influence of various factors on ES patterns | |
| Cross-sensitivity Coefficients | Land use-ESV linkage measurement | Improved quantification of LULC change impacts on ESV | |
| Data Integration Frameworks | System of Environmental Economic Accounting | Standardized environmental accounting | Natural capital integration into economic decision-making |
| Gross Ecosystem Product | Ecosystem service valuation index | Parallel tracking of economic and ecological production |
Addressing the limitations in LULC projection and ES valuation requires continued methodological innovation and cross-disciplinary collaboration. Future research should prioritize: (1) developing dynamic valuation coefficients that respond to ecosystem scarcity and quality; (2) better integration of process-based ecosystem models with empirical valuation approaches; (3) advanced uncertainty propagation analysis through ensemble modeling techniques; and (4) stronger theoretical foundations for representing human decision-making in land change models. Furthermore, the scientific community must establish standardized validation protocols that enable meaningful comparison across studies while accommodating region-specific contextual factors. By confronting these challenges directly, researchers can generate more credible, policy-relevant evidence about the consequences of land use change, ultimately contributing to more sustainable land governance and ecosystem management in an era of unprecedented global environmental change.
Research assessing land use change impacts on ecosystem services frequently encounters a fundamental constraint: critical data scarcity at relevant local scales. This scarcity impedes evidence-based decision-making, particularly in resource-constrained contexts such as historical small towns and rural municipalities where comprehensive primary data collection is often financially and technically infeasible [61]. In Mediterranean agricultural systems, for instance, traditional practices persist outside formal monitoring systems, creating significant gaps in understanding agricultural waste flows and their implications for ecosystem services [61]. This data paucity has prompted increased reliance on knowledge transfer methodologies—applying models, coefficients, and relationships developed in data-rich contexts to data-poor local scenarios.
The transferability of ecological models to novel conditions offers promising potential for predicting ecosystem services in data-scarce scenarios, contributing to more informed management decisions regarding land use changes [62]. However, the determinants of ecological predictability remain insufficiently understood, with predictions from transferred models affected by numerous factors including species' traits, sampling biases, biotic interactions, nonstationarity, and the degree of environmental dissimilarity between reference and target systems [62]. Within land use change research specifically, scenario analyses that link ecosystem service impacts to human well-being are valuable for anticipating potential consequences of change that are meaningful to local communities [29]. Yet these analyses often depend on transferred coefficients and models originally developed in different biogeographical and socio-economic contexts.
Theoretical Framework: The Transferability Problem
Core Challenges in Coefficient Transfer
The process of transferring global coefficients to local contexts presents both technical and fundamental challenges that researchers must navigate. These challenges can be categorized into six primary dimensions:
- Environmental Nonstationarity: Changing environmental relationships across spatial and temporal scales due to unique local conditions, historical contingencies, and evolving system dynamics [62]
- Contextual Mismatch: Disparities in agricultural practices, management intensities, soil characteristics, and climatic conditions between source and target systems [61]
- Scalar Discontinuities: Non-linear relationships and emergent properties that manifest differently across spatial, temporal, and organizational scales [63]
- Structural Uncertainty: Incompleteness in model structure regarding key processes, feedback mechanisms, and critical relationships specific to local contexts [63]
- Parameter Sensitivity: Differential sensitivity of model outputs to various parameters across contexts, with certain parameters exhibiting higher transfer error potential [61]
- Validation Limitations: Restricted capacity for robust validation in data-scarce environments, creating cyclical constraints on model improvement [62]
Conceptual Workflow for Coefficient Transfer
The following diagram illustrates the systematic process for transferring global coefficients to local contexts, highlighting critical decision points and validation requirements:
Methodological Approaches: Protocols for Transferability Assessment
Dynamic Bayesian Network Adaptation Framework
For complex ecosystem modeling, Dynamic Bayesian Networks (DBNs) offer a structured approach for knowledge transfer while accommodating data scarcity. The adaptation of general DBNs to specific local contexts follows a systematic protocol [63]:
Phase 1: Revision and Design
- Step 1.1: Collaborate with domain experts to assess transferability of the chosen model
- Step 1.2: Revise model structure to ensure nodes and relationships reflect local conditions
- Step 1.3: Identify key elements in the environmental system specific to the local context
Phase 2: Knowledge Acquisition
- Step 2.1: Compile available information for the study area (experimental data, observational data, gray literature)
- Step 2.2: Document peer-reviewed literature from similar systems
- Step 2.3: Formalize expert knowledge through structured elicitation protocols
Phase 3: Site Application
- Step 3.1: Adapt conditional probability tables for nodes characterizing local growth dynamics
- Step 3.2: Parameterize crucial driver variables (e.g., light availability for seagrass systems)
- Step 3.3: Incorporate seasonal variation patterns specific to the local context
- Step 3.4: Implement prior predictive approaches to evaluate model behavior under data limitations [63]
Coefficient-Based Estimation Framework
For quantitative estimation of ecosystem service flows, the coefficient-based framework provides a pragmatic approach for data-scarce contexts. Applied successfully in Mediterranean small towns, this methodology proceeds through five systematic steps [61]:
Step 1: Administrative Data Compilation
- Collect routine administrative data (enterprise registries, territorial profiles, population statistics)
- Classify agricultural enterprises by production typology using standard classification codes
- Compile spatial data on land use distributions and altitudinal gradients
Step 2: Coefficient Extraction and Harmonization
- Conduct systematic literature review of waste generation coefficients from biogeographically similar regions
- Extract coefficients aligned with recent assessments (e.g., citrus processing waste at 50-60% of fruit weight; winery waste at 20-30% of total production)
- Document ranges and variabilities rather than relying solely on mean values
Step 3: Contextual Adjustment
- Apply scaling factors based on enterprise density and management intensity
- Adjust for local climatic conditions and production technologies
- Incorporate altitude-specific modifiers for relevant agricultural sectors
Step 4: Uncertainty Quantification
- Implement sensitivity analysis using Monte Carlo approaches
- Quantify contribution of each parameter to output variance
- Document uncertainty ranges for all estimates
Step 5: Output Generation
- Calculate central estimates and probability distributions for ecosystem service flows
- Generate alternative scenarios reflecting different production assumptions
- Translate physical flows into potential ecosystem service impacts
Table 1: Representative Waste Generation Coefficients for Mediterranean Agricultural Systems [61]
| Agricultural Sector | Waste Type | Generation Coefficient | Source Context | Uncertainty Range |
|---|---|---|---|---|
| Viticulture | Grape pomace | 20-30% of total production | Mediterranean wineries | ±5% |
| Citrus cultivation | Processing waste | 50-60% of fruit weight | Southern Italian processing facilities | ±8% |
| Olive oil production | Pruning residues | 1.8-2.2 tons/ha/year | Traditional Mediterranean groves | ±15% |
| Mixed agriculture | Post-harvest residues | 0.4-0.7 tons/ha/year | Diverse Mediterranean systems | ±25% |
Case Study: Applying Transferable Coefficients in Sicilian Small Towns
Context and Methodology
The application of transferability principles was demonstrated in four Sicilian historical small towns (HSTs) within the Local Action Group "Terre dell'Etna e dell'Alcantara" [61]. These municipalities faced significant data scarcity challenges despite their substantial agricultural economies. The research applied a coefficient-based estimation framework using the following methodological sequence:
Context Characterization: The territory was classified into three altitudinal typologies: coastal areas (0-300 m) predominantly cultivating citrus; mid-elevation zones (300-800 m) supporting mixed agricultural systems; and upper volcanic slopes (>800 m) specializing in viticulture.
Enterprise Enumeration: Agricultural enterprise density was documented through registry data, revealing remarkable concentrations ranging from 107 enterprises in Milo (population: 1,023) to 360 in Castiglione di Sicilia (population: 2,889).
Coefficient Application: Literature-derived waste generation coefficients were applied to estimate agricultural waste flows across three dominant sectors: viticulture, citrus cultivation, and olive oil production.
Energy Potential Calculation: The energy recovery potential was quantified through two pathways: direct combustion (20-30 TJ) and anaerobic digestion (4.9-8.1 TJ).
Quantitative Results and Uncertainty Analysis
The application of transferred coefficients yielded substantial estimates of agricultural waste generation despite the small size of the municipalities [61]:
Table 2: Estimated Annual Agricultural Waste Flows in Sicilian HSTs [61]
| Municipality | Population | Agricultural Enterprises | Total Waste (tons/year) | Grape Pomace (tons) | Pruning Residues (tons) | Mixed Processing Wastes (tons) |
|---|---|---|---|---|---|---|
| Milo | 1,023 | 107 | 1,480-1,520 | 690-710 | 650-660 | 140-150 |
| Piedimonte Etneo | 3,905 | 352 | 2,780-2,860 | 1,310-1,350 | 1,220-1,250 | 250-260 |
| Castiglione di Sicilia | 2,889 | 360 | 2,850-2,930 | 1,340-1,380 | 1,240-1,280 | 270-280 |
| Zafferana Etnea | 1,510 | 121 | 1,450-1,490 | 680-700 | 630-650 | 140-145 |
| Total | 9,327 | 940 | 6,930-7,130 | 3,250 | 3,030 | 650-850 |
Sensitivity analysis revealed balanced contributions from all three key parameters to output variance: enterprise density (31-35%), yields (31-35%), and waste coefficients (31-35%) [61]. This relatively even distribution highlights the importance of addressing multiple uncertainty sources rather than focusing exclusively on coefficient refinement.
Practical Implementation: The Researcher's Toolkit
Essential Methodological Approaches
Table 3: Research Reagent Solutions for Data-Scarce Contexts
| Methodological Approach | Primary Function | Application Context | Key References |
|---|---|---|---|
| Coefficient-based estimation frameworks | Generate first-order approximations using literature values | Preliminary assessment and screening of ecosystem service flows | [61] |
| Dynamic Bayesian Networks | Model complex systems with limited data through probabilistic relationships | Ecosystems with understood structure but poorly quantified relationships | [63] |
| Ecological production functions | Quantify likely changes in ecosystem services resulting from ecological condition changes | Land use change scenario analysis | [29] |
| Ecological benefits functions | Link changes in ecosystem services to changes in human well-being | Integrated assessment of socio-ecological systems | [29] |
| Sensitivity analysis | Quantify uncertainty contributions from different parameters | Priority-setting for data collection efforts | [61] |
Visualization Approaches for Comparative Analysis
Effective data visualization is essential for interpreting transferred relationships in local contexts. Recommended approaches include [64]:
- Comparative Bar Charts: For side-by-side comparison of coefficient values across different source contexts
- Multi-Axis Line Graphs: To display relationships between multiple variables with different units and scales
- Boxplots: To visualize distributions and ranges of coefficient values from multiple studies
- Matrix Charts: To display complex many-to-many relationships between source contexts and local applications
The transfer of global coefficients to local contexts represents an essential methodology for advancing ecosystem services research in data-scarce environments. However, this practice requires careful attention to contextual mismatches, systematic uncertainty quantification, and transparent reporting of limitations. The most immediate obstacle to improving transferability understanding lies in the absence of a widely applicable set of metrics for assessing transferability [62]. Encouraging the development of models grounded in well-established mechanisms offers the most immediate way of improving transferability while the field advances more robust validation methodologies.
For land use change research specifically, the integration of transferred coefficients with scenario analysis provides a promising pathway for projecting potential impacts on human well-being, even in contexts with limited primary data [29]. This approach enables resource-constrained municipalities to leverage routine administrative data combined with literature-based coefficients to generate actionable assessments, transforming data scarcity from an insurmountable barrier to a manageable constraint in ecosystem services research.
The scientific assessment of land use change impacts on ecosystem services (ES) relies heavily on computational and conceptual models to quantify complex ecological and economic relationships. As these models inform critical environmental policies and conservation decisions, ensuring their accuracy and reliability is paramount [65]. Validation and uncertainty assessment are not final steps but integral, ongoing processes that determine the credibility and practical applicability of research findings [66]. This technical guide provides researchers and scientists with a structured framework for evaluating model performance, characterizing uncertainty, and implementing robust validation protocols within ecosystem service assessments. By adopting these practices, the research community can enhance methodological rigor, improve cross-study comparability, and deliver more trustworthy evidence for sustainable land management and biodiversity conservation.
Foundational Concepts in Validation and Uncertainty
The Validation Hierarchy in Ecosystem Service Assessments
Model validation in ES research operates across multiple dimensions, each requiring specific assessment techniques. Process validation ensures that the model accurately represents the underlying ecological mechanisms connecting land use to service provision. Output validation focuses on the quantitative agreement between model predictions and observed data, while theoretical validation examines the soundness of the model's conceptual foundations and assumptions [66] [65].
Uncertainty in ES assessments manifests from diverse sources that propagate through analytical chains. Parameter uncertainty arises from imprecise measurement of input variables, while model structure uncertainty stems from incomplete representation of ecosystem processes. Contextual uncertainty emerges from applying models across different spatial scales or ecological contexts, and decision uncertainty relates to how assessment outputs are interpreted and applied in policy contexts [65]. Understanding this typology is essential for designing targeted validation strategies.
Critical Assumptions Requiring Validation
Ecosystem service assessments typically rely on several foundational assumptions that must be critically examined during validation. These include the presumption that ecosystems provide net positive benefits, that ES components can be used interchangeably, that secondary data are representative across temporal and spatial domains, and that economic valuation approaches adequately capture societal preferences [66]. Each assumption introduces potential uncertainty that should be quantified where possible.
Table 1: Key Assumptions in Ecosystem Service Assessments and Their Validation Implications
| Assumption Category | Representative Assumptions | Validation Approaches |
|---|---|---|
| Conceptual Foundations | Ecosystems provide net benefits; "Ecosystem" and "service" terminology is appropriate | Disservice quantification; Stakeholder feedback on terminology relevance |
| Methodological Approach | ES are independent entities; Expert judgment is appropriate | Interaction effect testing; Expert panel diversity and validation with empirical data |
| Data Treatment | Secondary data are representative across time/space; Indicators are credible | Data transferability assessment; Indicator validation against direct measurements |
| Valuation Framework | Economic rationality applies; Monetary valuation approximates preferences | Preference construction analysis; Plural valuation methods implementation |
Techniques for Accuracy Assessment
Data Quality Verification Protocols
High-quality input data forms the foundation of reliable ES assessments. The research community has established several protocols for verifying data quality throughout the analytical pipeline. For land use classification, which typically serves as primary input for ES models, accuracy assessment should include random stratified sampling with a minimum of 10% of the total area, field verification using GPS technology, and cross-validation with independent datasets [4] [67]. Classification accuracy should exceed 85% overall, with particular attention to ecologically significant transitions between categories [4].
Remote sensing data validation requires special consideration of temporal alignment between image acquisition and ground truthing. For ES assessments integrating multi-temporal land use data, the collection of ground validation points should coincide with satellite imaging periods to minimize phenological discrepancies [67]. Positional accuracy should maintain errors within one pixel dimension, while thematic accuracy should be quantified using confusion matrices with producer's and user's accuracy reported for all land cover classes [67].
Model Output Validation Techniques
Spatial cross-validation techniques are particularly valuable for assessing predictive performance of ES models across heterogeneous landscapes. This approach involves partitioning data based on spatial blocks rather than random subsets, effectively testing model transferability across geographic domains [16]. For machine learning approaches increasingly used in ES mapping, k-fold spatial cross-validation with geographically stratified folds provides realistic performance estimates [16].
Trend validation compares modeled ES trajectories with independent observational records or established ecological benchmarks. This approach is especially important for temporal analyses examining land use change impacts. Researchers should establish validation periods where model projections can be compared against observed data not used in model calibration [68]. For longer-term projections, historical reconstruction validation tests model performance by initializing with past land use data and projecting forward to current conditions [68].
Table 2: Quantitative Accuracy Metrics for Ecosystem Service Model Validation
| Metric Category | Specific Metrics | Application Context | Acceptance Threshold |
|---|---|---|---|
| Categorical Agreement | Overall Accuracy, Kappa statistic, Producer/User Accuracy | Land use classification validation | >85% overall accuracy, Kappa >0.8 |
| Continuous Variable Agreement | R², RMSE, MAE, Nash-Sutcliffe Efficiency | Regression-based ES models (e.g., carbon storage) | R² >0.6, NSE >0.5 for acceptable performance |
| Spatial Pattern Agreement | Mapcurves, Fuzzy Kappa, Spatial autocorrelation metrics | Spatial ES mapping (e.g., habitat quality) | Fuzzy Kappa >0.6 for moderate agreement |
| Temporal Trend Agreement | Spearman correlation, Trend magnitude difference | Time-series ES assessment | Correlation >0.7, magnitude difference <15% |
Advanced Machine Learning Validation
Machine learning approaches introduce both opportunities and specialized validation requirements. For algorithms such as gradient boosting models used in ES driver analysis, validation should include hyperparameter optimization via grid or random search, learning curve analysis to assess sufficient training data, and feature importance validation through permutation tests [16]. The gradient boosting model has demonstrated particular utility in handling nonlinear relationships in ES data, but requires rigorous cross-validation to prevent overfitting [16].
Model comparison frameworks should test multiple algorithms against standardized validation datasets. Recent implementations have utilized pairwise performance testing across several machine learning models (e.g., random forests, support vector machines, neural networks) to identify optimal approaches for specific ES types [16]. This comparative validation is especially valuable given the diverse data characteristics of different ES (e.g., provisioning vs. regulating services).
Uncertainty Assessment Methodologies
Uncertainty Propagation Analysis
Comprehensive uncertainty assessment requires tracing how input uncertainties propagate through analytical chains to affect final ES valuations. Monte Carlo simulation provides a robust framework for quantifying this propagation by repeatedly running models with input parameters sampled from probability distributions representing their uncertainty [65]. For ES value transfers, this approach can incorporate uncertainty from value coefficients, land use classification, and biophysical relationships simultaneously.
Sensitivity analysis systematically examines how model outputs respond to variations in input factors. Global sensitivity methods such as Sobol' indices or Extended Fourier Amplitude Sensitivity Testing (EFAST) are particularly effective for ES models with interacting factors [65]. These techniques help identify which parameters contribute most to output uncertainty, directing research effort toward better constraining the most influential factors.
Scenario-Based Uncertainty Assessment
Land use change projections inherently involve substantial uncertainty, making scenario analysis a vital validation tool. The PLUS model and similar simulation approaches incorporate uncertainty assessment through multi-scenario prediction that compares ecosystem service outcomes under different development pathways [16]. Standard scenarios should include natural development, planning-oriented, and ecological priority narratives to bracket plausible futures [16].
The CA-Markov model implements uncertainty estimation through transition probability confidence intervals and model goodness-of-fit measures that quantify projection reliability [68]. For longer-term projections, the coefficient of variation across multiple model runs provides a spatial explicit uncertainty measure, particularly valuable for identifying regions where ES projections are most unreliable.
Figure 1: Integrated Workflow for Model Validation and Uncertainty Assessment in Ecosystem Services Research
Experimental Protocols for Key Methodologies
Land Use Classification Accuracy Assessment Protocol
Objective: Quantify classification accuracy and uncertainty for land use maps serving as ES model inputs.
Materials: Reference dataset (field surveys or high-resolution imagery), classified land use map, GIS software with accuracy assessment tools.
Procedure:
- Stratified random sampling: Generate 250-500 sample points minimum, stratified by land use class rarity.
- Reference data collection: Identify true land cover through field verification or interpretation of high-resolution imagery.
- Error matrix construction: Cross-tabulate classified data against reference data.
- Accuracy calculation: Compute overall accuracy, user's accuracy (commission error), and producer's accuracy (omission error).
- Area-adjusted estimation: Apply inverse calibration estimators to correct for bias in class area estimates.
Validation Metrics: Overall accuracy (>85%), Kappa coefficient (>0.8), and confidence intervals for area estimates [4] [67].
Spatial Cross-Validation for ES Model Transferability
Objective: Assess model performance consistency across spatial domains.
Materials: Complete ES dataset, spatial partitioning scheme, modeling environment.
Procedure:
- Satial partitioning: Divide study area into 5-10 spatial folds using checkerboard pattern or watershed boundaries.
- Iterative training/testing: Sequentially exclude each fold for testing while training on remaining data.
- Performance recording: Calculate R², RMSE, and MAE for each test fold.
- Spatial bias analysis: Examine performance variation across folds to identify geographic domains with poor transferability.
- Model refinement: Incorporate spatial structure (autocorrelation) into models showing high spatial bias.
Validation Metrics: Cross-validation R² (target >0.6), spatial performance variance (target <15% coefficient of variation) [16].
Monte Carlo Uncertainty Propagation Analysis
Objective: Quantify how input uncertainties propagate to ES value estimates.
Materials: Probability distributions for uncertain parameters, computational resources for iterative modeling.
Procedure:
- Parameter uncertainty specification: Define probability distributions for key uncertain parameters (e.g., value coefficients, elasticity values).
- Iterative simulation: Run ES valuation model 1,000-10,000 times with random parameter sampling.
- Output distribution analysis: Characterize resulting ES value distributions using quantiles and variance measures.
- Contribution decomposition: Use regression-based approaches to attribute output variance to different input uncertainties.
- Confidence interval reporting: Present ES values with 95% confidence intervals reflecting aggregated uncertainty.
Validation Metrics: Coefficient of variation for ES values, uncertainty contribution percentages, confidence interval coverage [65].
The Scientist's Toolkit: Essential Research Reagents and Solutions
Table 3: Essential Research Tools for Ecosystem Service Model Validation
| Tool Category | Specific Tools/Reagents | Primary Function | Validation Application |
|---|---|---|---|
| Remote Sensing Data | Landsat TM/OLI, Sentinel-2 | Land use/cover classification | Provides base data for change detection and model input |
| Validation Platforms | Google Earth Engine, ERDAS, eCognition | Image processing and accuracy assessment | Enables efficient sampling and reference data collection |
| ES Modeling Suites | InVEST, ARIES, SoIVES | Ecosystem service quantification | Standardized ES assessment allowing cross-study comparison |
| Statistical Analysis | R, Python (scikit-learn), Geoda | Statistical validation and uncertainty analysis | Implements cross-validation, sensitivity analysis, and error estimation |
| Land Use Projection | PLUS, CA-Markov, CLUE-S | Scenario development and projection | Tests model performance under different future scenarios |
| Field Validation | GPS units, field spectrometers | Ground truth data collection | Provides independent validation data for remote sensing classifications |
Robust validation and comprehensive uncertainty assessment are fundamental to advancing the science of ecosystem service evaluation. By implementing the techniques outlined in this guide—ranging from basic accuracy assessment to advanced machine learning validation and uncertainty propagation analysis—researchers can significantly enhance the credibility of their findings. The interdisciplinary nature of ES research demands particular attention to communicating assumptions and limitations across disciplinary boundaries, especially when results inform consequential land use decisions and conservation policies. Future methodological development should focus on standardizing validation protocols, improving uncertainty characterization in value transfer approaches, and creating more accessible tools for implementing these techniques across diverse ecological and institutional contexts. Only through such rigorous validation practices can ecosystem service assessments fulfill their potential as trustworthy foundations for sustainable land management.
Within land use change impacts on ecosystem services research, scenario-based analysis has emerged as a critical methodology for projecting future environmental conditions and informing sustainable policy decisions. Scenarios are not predictions but rather structured, plausible narratives about how the future may unfold, allowing researchers and policymakers to explore the potential consequences of different social, economic, and ecological choices [69] [8]. This technical guide provides a comprehensive framework for designing effective scenarios that integrate natural development, ecological protection, and economic pathways, specifically contextualized for ecosystem services research.
The fundamental value of scenarios lies in their ability to quantify the trade-offs and synergies between developmental and conservation objectives. As demonstrated in recent studies on the Qinghai-Xizang Plateau and in Albany County, New York, scenario analysis can reveal how land-use decisions directly impact essential services like habitat quality, water purification, and recreation potential [69] [8]. By crafting methodologically rigorous scenarios, researchers can provide actionable scientific evidence for land management strategies that balance multiple objectives in complex socio-ecological systems.
Core Scenario Archetypes in Land Use Research
Most scenario frameworks in land use and ecosystem services research revolve around three foundational archetypes that represent divergent future pathways. The characteristics and research applications of these archetypes are detailed in Table 1.
Table 1: Core Scenario Archetypes in Land Use and Ecosystem Services Research
| Scenario Archetype | Key Characteristics | Primary Drivers | Typical Impact on Ecosystem Services | Representative Applications |
|---|---|---|---|---|
| Business-as-Usual | Continuation of current trends and policies; historical patterns of development | Market forces, population growth, existing regulatory frameworks | Mixed; typically leads to gradual ecosystem service degradation | Albany County, NY study [69]; Qinghai-Xizang Plateau baseline [8] |
| Economic/Growth-Oriented | Prioritization of economic expansion, infrastructure development, and resource exploitation | GDP growth targets, market liberalization, urbanization pressures | Generally negative; accelerated decline in regulating and cultural services | Rapid Growth scenario [69]; Urban expansion simulations [8] |
| Ecological Protection | Emphasis on conservation, restoration, and sustainable management | Environmental regulations, protected area expansion, green infrastructure investment | Generally positive; enhancement of regulating and supporting services | Green Expansion scenario [69]; Conservation prioritization models [8] |
These archetypes provide the foundational structure for most land-use scenario projects, though many researchers develop hybrid scenarios that combine elements from multiple archetypes to represent more nuanced policy alternatives. The selection of appropriate archetypes should be guided by the specific research questions, stakeholder priorities, and policy contexts relevant to the study area.
Methodological Framework for Scenario Development
Data Requirements and Preparation
Developing plausible land-use scenarios requires the integration of diverse datasets spanning multiple disciplines and spatial scales. Table 2 outlines the essential data categories and their specific roles in scenario construction.
Table 2: Essential Data Requirements for Land-Use Scenario Development
| Data Category | Specific Data Types | Role in Scenario Development | Common Sources |
|---|---|---|---|
| Land Use/Land Cover | Historical and current land use maps, land use change trajectories | Baseline establishment, change quantification, model calibration | CLCD [8], NLCD, CORINE |
| Biophysical | Elevation, slope, soil characteristics, climate data, habitat quality | Constraint mapping, suitability analysis, ecosystem service modeling | SRTM, WorldClim, SoilGrids, InVEST HQ module [8] |
| Socio-economic | Population density, GDP, employment, land ownership, policy designations | Driver quantification, demand projection, policy scenario development | Census data, nighttime lights [8], regional economic accounts |
| Ecological | Species distributions, protected areas, ecosystem service metrics | Conservation priority identification, ecological constraint definition | GBIF, Protected Planet, InVEST models [69] [8] |
Data quality and consistency are paramount throughout the scenario development process. As emphasized in the Qinghai-Xizang Plateau study, utilizing validated datasets with appropriate spatial resolution (e.g., 30m CLCD data) significantly enhances the credibility of scenario outcomes [8]. All datasets should be standardized to consistent spatial projections, resolutions, and extent boundaries before analysis.
Quantitative Modeling Approaches
The transformation of scenario narratives into quantitative projections typically involves computational models that simulate land-use changes under different assumptions. The following diagram illustrates the integrated modeling workflow common in scenario development.
The modeling workflow integrates both inductive and deductive approaches, combining statistical analysis of historical patterns with forward-looking scenario assumptions. Key quantitative methods include:
- Spatially Explicit Land Use Change Models: These models (e.g., CLUE-S, FUTURES) simulate the spatial allocation of land use changes based on suitability surfaces, conversion elasticities, and demand projections.
- Machine Learning Approaches: As demonstrated in the Qinghai-Xizang Plateau study, algorithms like XGBoost-SHAP can identify key drivers of change and improve the predictive accuracy of scenario projections [8].
- Ecosystem Service Models: Tools like the InVEST (Integrated Valuation of Ecosystem Services and Tradeoffs) suite quantify how land use changes affect specific ecosystem services, including habitat quality, water purification, and carbon sequestration [69] [8].
Ecosystem services scenario research requires specialized analytical tools and computational resources. The following table details key components of the research toolkit.
Table 3: Essential Research Toolkit for Ecosystem Services Scenario Development
| Tool/Resource Category | Specific Examples | Function/Purpose | Application Context |
|---|---|---|---|
| Geospatial Analysis Platforms | ArcGIS, QGIS, GRASS GIS | Spatial data management, processing, and visualization | Baseline mapping, constraint identification, result presentation |
| Land Use Modeling Software | InVEST, CLUE-S, FUTURES, SLEUTH | Scenario simulation and projection | Land use change allocation under different scenario assumptions [69] [8] |
| Statistical Analysis Tools | R, Python (pandas, scikit-learn), SPSS | Driver analysis, model calibration, validation | Statistical relationship quantification between drivers and land change [8] |
| Remote Sensing Data | Landsat, Sentinel, MODIS, Nighttime Lights | Land cover classification, change detection, variable derivation | Historical change analysis, socioeconomic indicator development [8] |
| Machine Learning Libraries | XGBoost, SHAP, Random Forests, Neural Networks | Pattern recognition, driver importance analysis, predictive modeling | Nonlinear relationship modeling, factor importance ranking [8] |
Experimental Protocol: Implementing a Scenario Analysis
This section provides a detailed methodological protocol for implementing a complete scenario analysis, based on approaches used in recent high-impact studies [69] [8].
Baseline Establishment and Historical Change Analysis
Objective: Quantify historical land use/cover changes and establish a baseline for scenario projections.
Procedure:
- Data Acquisition and Preprocessing: Acquire land use/cover data for at least two time points (e.g., 2000 and 2020). The Qinghai-Xizang Plateau study utilized the China Land Cover Dataset (CLCD) with 30m resolution and 79.31% accuracy [8]. Reproject all data to a consistent coordinate system.
- Change Detection Analysis: Calculate transition matrices to quantify conversions between land use categories. Determine net and gross changes for each category.
- Driver Identification: Use statistical methods (correlation, regression) or machine learning approaches (XGBoost-SHAP) to identify significant biophysical and socioeconomic drivers of historical changes [8].
- Change Trajectory Mapping: Create spatial maps illustrating dominant change pathways, highlighting areas of persistent change versus stability.
Outputs: Quantitative change matrices, driver importance rankings, historical change trajectory maps.
Scenario Narrative Development
Objective: Create structured, plausible scenario narratives that represent alternative future pathways.
Procedure:
- Stakeholder Engagement: Conduct workshops with relevant stakeholders (policymakers, land managers, community representatives) to identify key uncertainties and decision points.
- Narrative Formulation: Develop 3-4 distinct scenario narratives structured around the core archetypes in Table 1. Each narrative should include:
- Socioeconomic assumptions (population, economic structure, policies)
- Technological assumptions (agricultural productivity, energy systems)
- Governance and institutional arrangements
- Environmental management approaches
- Qualitative-to-Quantitative Translation: Convert narrative elements into quantitative assumptions suitable for modeling (e.g., specific growth rates, protection targets, conversion probabilities).
Outputs: Scenario narrative documents, quantitative assumption tables.
Scenario Quantification and Projection
Objective: Translate scenario narratives into spatially explicit land use projections.
Procedure:
- Demand Projection: Estimate aggregate demands for different land use categories under each scenario, using methods appropriate to the scenario logic (e.g., trend extrapolation, normative targets, economic models).
- Suitability Analysis: Develop spatially explicit suitability maps for each land use type under each scenario, reflecting differing priorities and constraints.
- Spatial Allocation: Implement land use change models to allocate projected demands across the landscape based on suitability, conversion elasticities, and spatial policies.
- Iterative Refinement: Adjust model parameters to ensure internal consistency between narrative assumptions and spatial outcomes.
Outputs: Spatially explicit land use maps for future time points (e.g., 2030, 2050) under each scenario, transition probability surfaces.
Ecosystem Service Impact Assessment
Objective: Quantify the impacts of scenario-based land use changes on ecosystem services.
Procedure:
- Model Selection: Choose appropriate ecosystem service models aligned with research objectives (e.g., InVEST for habitat quality, water purification, carbon storage).
- Parameterization: Calibrate ecosystem service models using local data where available, following established protocols for each model.
- Service Quantification: Run ecosystem service models for baseline and scenario projections to estimate changes in service provision.
- Trade-off Analysis: Identify and quantify trade-offs and synergies between different ecosystem services under each scenario, and between ecosystem services and economic indicators.
Outputs: Ecosystem service maps and metrics for each scenario, trade-off analysis results.
The relationships between scenario components and analytical phases are visualized in the following diagram.
Data Presentation and Visualization Standards
Effective communication of scenario results requires careful attention to data presentation standards. Tables should be structured for maximum clarity and interpretability, following established guidelines for academic publications [70] [71].
Scenario Result Tables
Scenario outcomes should be presented using standardized table formats that enable comparison across scenarios and ecosystem services. Table 4 provides a template for presenting key scenario results.
Table 4: Scenario Impacts on Ecosystem Services: Template for Results Presentation
| Ecosystem Service Metric | Baseline (2020) | Business-as-Usual (2050) | Economic Development (2050) | Ecological Protection (2050) | Units |
|---|---|---|---|---|---|
| Habitat Quality | |||||
| Mean habitat quality index | 0.65 | 0.58 (-10.8%) | 0.49 (-24.6%) | 0.72 (+10.8%) | 0-1 scale |
| High quality habitat area | 125,600 | 108,350 (-13.7%) | 89,450 (-28.8%) | 142,300 (+13.3%) | km² |
| Water Purification | |||||
| Nitrogen export | 1,245 | 1,389 (+11.6%) | 1,567 (+25.9%) | 1,098 (-11.8%) | kg/km²/yr |
| Sediment retention | 85.6 | 81.2 (-5.1%) | 75.8 (-11.4%) | 92.3 (+7.8%) | % |
| Carbon Storage | |||||
| Aboveground biomass carbon | 12.45 | 11.89 (-4.5%) | 10.56 (-15.2%) | 13.28 (+6.7%) | Mg C/ha |
| Total ecosystem carbon | 245.8 | 238.9 (-2.8%) | 225.6 (-8.2%) | 252.3 (+2.6%) | Mg C/ha |
| Recreation Potential | |||||
| Accessible natural areas | 68.5 | 65.2 (-4.8%) | 58.9 (-14.0%) | 75.8 (+10.7%) | % of population |
Visualization and Accessibility Standards
All visual elements in scenario presentations must adhere to accessibility standards, particularly regarding color contrast. The Web Content Accessibility Guidelines (WCAG) recommend a minimum contrast ratio of 4.5:1 for normal text and 3:1 for large text against background colors [72] [73]. When creating diagrams and charts:
- Use the specified color palette (#4285F4, #EA4335, #FBBC05, #34A853, #FFFFFF, #F1F3F4, #202124, #5F6368) consistently across all visualizations
- Ensure sufficient contrast between foreground elements (text, arrows, symbols) and their backgrounds
- Explicitly set text colors to have high contrast against node background colors in diagrams
- Provide alternative text descriptions for all visual elements to ensure accessibility
Well-designed scenarios provide powerful tools for understanding potential futures of land systems and their implications for ecosystem services. By following the methodological framework outlined in this guide—incorporating rigorous data preparation, appropriate modeling techniques, and clear communication standards—researchers can develop scenario analyses that effectively inform land use planning and policy decisions. The integration of machine learning approaches, as demonstrated in recent research [8], offers promising avenues for enhancing the analytical sophistication of scenario development, particularly in identifying complex, nonlinear relationships between drivers and land change. As human pressures on ecosystems continue to intensify, robust scenario analysis will remain essential for navigating trade-offs between development and conservation objectives in an increasingly uncertain future.
Land use planning is the systematic process of regulating land use by a central authority to promote more desirable social and environmental outcomes while ensuring efficient resource utilization [74]. In the context of agricultural landscapes, this process faces the critical challenge of balancing competing demands: the provisioning ecosystem services essential for food security and the regulating and supporting services that maintain environmental health and biodiversity [75] [76]. The escalating global demand for agricultural products, driven by population growth and changing consumption patterns, has intensified pressure on agricultural land worldwide, leading to widespread ecosystem degradation and biodiversity loss [75] [76]. This tension creates a complex planning environment where decision-makers must identify strategic intervention points to optimize multiple objectives simultaneously.
The historical segregation of agricultural production from biodiversity conservation is no longer adequate to address contemporary environmental challenges [75]. The Millennium Ecosystem Assessment confirmed that agriculture has dramatically increased its ecological footprint, with approximately one-third of terrestrial lands now dominated by agricultural crops or planted pastures [75]. This expansion has profound ecological effects on entire landscapes, including habitat fragmentation, water pollution, soil degradation, and biodiversity loss [75] [55]. The emerging paradigm of "ecoagriculture" recognizes the need for integrated conservation-agriculture landscapes where biodiversity conservation becomes an explicit objective of agricultural development [75]. This framework provides the theoretical foundation for identifying intervention points that can simultaneously enhance production and conservation outcomes.
Theoretical Framework: From Segregation to Integration
The Ecoagriculture Paradigm
The ecoagriculture approach represents a fundamental shift from the conventional model that segregated agricultural production from areas managed for biodiversity conservation [75]. This integrated framework encompasses three primary objectives:
- Sustainable agricultural production that maintains or enhances productivity and livelihoods
- Biodiversity conservation at multiple scales (genetic, species, ecosystem)
- Ecosystem service provision through improved landscape management [75]
This paradigm recognizes that agricultural landscapes can be designed and managed to host wild biodiversity of many types, with neutral or even positive effects on agricultural production and livelihoods [75]. Innovative practitioners, scientists, and indigenous land managers are adapting, designing, and managing diverse types of ecoagriculture landscapes to generate positive co-benefits for production, biodiversity, and local people [75].
Land Use Transition Theory
Land use transition refers to the systematic changes in land use structure and function that occur as human societies develop and intensify land management [55]. These transitions can be categorized as:
- Explicit transitions: Changes in land use structure, including quantitative and spatial structure
- Implicit transitions: Changes in land use functions, including property rights, inputs, outputs, and production modes [55]
Understanding these transitional pathways is essential for identifying leverage points where strategic interventions can redirect development trajectories toward more sustainable outcomes. Research in China's Dongting Lake area demonstrates how land use transition intensity (LUI) serves as a significant metric of land use function from a socio-economic standpoint, indicating varied degrees of land transitions, development, and exploitation [55].
Key Intervention Points in Agricultural Landscapes
Landscape Configuration and Connectivity
Table 1: Landscape-Level Intervention Points for Balancing Production and Conservation
| Intervention Point | Mechanism of Action | Production Impact | Conservation Impact |
|---|---|---|---|
| Habitat corridors | Connect fragmented natural areas to enable species movement | Neutral to slightly negative (land taken out of production) | Highly positive (maintains biodiversity, supports pollinators) |
| Riparian buffers | Vegetated zones along water bodies filter agricultural runoff | Neutral (minor land loss) | Highly positive (improves water quality, provides habitat) |
| Natural vegetation patches | Maintain native vegetation within agricultural matrix | Neutral to positive (supports natural pest control) | Positive (conserves biodiversity, maintains ecosystem functions) |
| Multifunctional landscapes | Integrate production and conservation in same space | Variable (can be positive with proper design) | Highly positive (enhances multiple ecosystem services) |
Maintaining and enhancing ecological connectivity represents a fundamental intervention point for balancing agricultural production and ecological conservation. The spatial arrangement of natural and semi-natural habitat elements within agricultural landscapes significantly influences their capacity to support biodiversity and deliver regulating ecosystem services [75] [77]. Research demonstrates that thoughtfully designed landscape patterns can simultaneously support agricultural production and conservation objectives by maintaining pollination services, natural pest control, and nutrient cycling [75].
The Critical Habitat mapping approach provides a methodological framework for identifying areas of particular conservation significance within agricultural landscapes [77]. This approach typically integrates four key elements: rare vegetation types, known areas of sensitive and rare species, areas of high neighborhood diversity, and habitat of economically important species [77]. By identifying these critical areas, land use planners can target conservation interventions more effectively and avoid conflicts with agricultural production on less sensitive lands.
Sustainable Intensification Practices
Table 2: Field-Level Intervention Points for Sustainable Intensification
| Practice | Ecosystem Service Benefits | Implementation Considerations |
|---|---|---|
| Conservation agriculture | Soil conservation, carbon sequestration, water regulation | Requires knowledge transfer, may have transition yield dip |
| Agroforestry systems | Biodiversity habitat, carbon storage, soil fertility | Complex management, long-term investment required |
| Precision agriculture | Reduced nutrient runoff, improved water quality | High initial technology investment |
| Cover cropping | Soil erosion control, nutrient cycling, weed suppression | Management complexity, water use considerations |
| Integrated pest management | Reduced pesticide exposure, enhanced biodiversity | Requires monitoring, knowledge-intensive |
Sustainable intensification practices represent a crucial intervention point for enhancing productivity while reducing environmental impacts [76]. These practices aim to increase agricultural output per unit area while minimizing the ecological footprint of production systems. Research in China's Loess Plateau demonstrates that sustainable intensification scenarios can increase agricultural production by 15% while maintaining moderate levels of other ecosystem services [76]. This approach contrasts with ecological restoration scenarios that maximize regulating and supporting services but may reduce agricultural output by 15% [76].
The trade-offs between different management approaches highlight the importance of context-specific interventions. Sustainable intensification practices must be tailored to local environmental conditions, socio-economic contexts, and production systems to achieve their dual objectives of enhanced productivity and environmental protection [76].
Land Use Zoning and Strategic Allocation
Land use zoning represents a foundational intervention point in land use planning, regulating the types of activities accommodated on given pieces of land and the spatial configuration of these activities [74]. Conventional zoning approaches have often contributed to landscape simplification and habitat fragmentation through the creation of exclusively segregated zones [74]. More innovative zoning strategies that incorporate ecological principles can help maintain landscape multifunctionality.
The application of land use transfer matrices enables planners to quantify changes between land use categories and assess their impacts on ecosystem services [4] [50]. Research in the Huaihai Economic Zone (HEZ) of China revealed that ecosystem service value (ESV) gains were primarily driven by the conversion of farmland, wetlands, and built-up land into water areas, whereas ESV losses mainly resulted from the conversion of farmland into built-up land and the transformation of woodland and grassland into farmland [4]. Understanding these transition pathways allows planners to prioritize interventions that minimize detrimental conversions while promoting beneficial ones.
Methodological Framework for Evaluation and Planning
Spatial Modeling and Scenario Analysis
A robust framework for evaluating land use planning alternatives involves four key components: stakeholder involvement, spatial modeling of critical habitat and development patterns, analysis of alternative scenarios, and evaluation and monitoring [77]. This approach allows planners to examine how different decisions could affect both agricultural production and ecological conservation outcomes before implementation.
Build-out analysis represents a powerful methodological tool for projecting probable future development intensities and patterns under different planning scenarios [77]. These analyses show what would likely result if development continued according to current or alternative regulations until no more parcels remained available for development. When combined with spatial models of ecosystem services and biodiversity, build-out scenarios enable planners to compare the potential impacts of different planning decisions on both production and conservation objectives [77].
Diagram 1: Land Use Planning Evaluation Framework. This diagram illustrates the iterative process for evaluating land use planning alternatives, emphasizing stakeholder engagement throughout the cycle [77].
Ecosystem Services Quantification
The Integrated Valuation of Ecosystem Services and Tradeoffs (InVEST) model suite provides a standardized methodological approach for quantifying and valuing ecosystem services across different land use scenarios [55] [76] [78]. This spatially explicit modeling framework enables planners to project the impacts of land use changes on key ecosystem services, including habitat quality, carbon storage, water yield, and soil conservation [55] [78].
Complementary approaches include the ecosystem service value (ESV) assessment method, which assigns economic values to different ecosystem services based on land use and land cover data [4] [50]. The development of regionally specific value coefficients, such as those developed for China [4] and adapted for Laos [50], enhances the accuracy and relevance of these assessments. The coefficient of improved cross sensitivity (CICS) provides a quantitative measure of the linkage between land use changes and ESV, offering planners a more intuitive understanding of how different land use conversions will affect ecosystem services [4].
Research Toolkit for Land Use Planning Analysis
Table 3: Essential Methodological Tools for Land Use Planning Research
| Tool Category | Specific Tools/Models | Primary Application | Data Requirements |
|---|---|---|---|
| Spatial analysis | ArcGIS, QGIS | Spatial pattern analysis, mapping | Land use/cover data, administrative boundaries |
| Ecosystem service assessment | InVEST, ARIES | Quantifying ES under different scenarios | LULC data, biophysical parameters |
| Land use change modeling | PLUS, CLUE-S, CA-Markov | Projecting future land use patterns | Historical LULC, driver variables |
| Statistical analysis | R, Python with spatial packages | Trend analysis, relationship modeling | Tabular and spatial datasets |
| Trade-off analysis | Multi-criteria decision analysis | Evaluating planning alternatives | Stakeholder preferences, impact indicators |
The effective implementation of land use planning interventions requires a sophisticated toolkit of research methods and technologies [4] [55] [77]. The Patch-generating Land Use Simulation (PLUS) model represents an advanced approach that overcomes limitations of conventional land use change models by better capturing and simulating small-scale changes in land use and land cover [78]. When combined with InVEST, this modeling framework provides a comprehensive assessment of the relationship between future land use changes and their impacts on ecosystem services [78].
Implementation Pathways and Policy Integration
Multi-level Governance Approaches
Effective implementation of land use planning interventions requires action across multiple governance levels, from local to national scales. At the local level, comprehensive or master planning provides a community vision and establishes goals and policies for long-term land use decisions [77]. These plans are particularly important because they typically guide policy beyond the tenure of individual officials and provide the regulatory framework for site-specific development decisions [77].
At the regional level, coordinated planning approaches can address ecological processes that operate at broader spatial scales, such as watershed management and habitat connectivity [75] [55]. The case of Laos demonstrates how national-level assessments of ecosystem service value can inform country-wide land resource planning and sustainable industry development [50]. Similarly, research in China's Huaihai Economic Zone highlights the importance of inter-provincial coordination in regions characterized by complex ecological contexts [4].
Stakeholder Engagement and Collaborative Planning
Stakeholder involvement represents a critical element of successful land use planning processes [77]. Stakeholders—including decision-makers, planning staff, citizens, landowners, developers, and biological experts—provide four important functions:
- Establishing conservation goals and priorities
- Reviewing and refining spatial models
- Developing feasible alternative scenarios
- Selecting indicators for evaluating success [77]
Participatory approaches to land use planning help build consensus around contentious trade-offs and ensure that planning decisions reflect local values and knowledge [77] [76]. Research demonstrates that effective stakeholder engagement requires careful attention to process design, including clear communication of scientific information in accessible formats and meaningful opportunities for input throughout the planning process [77].
Economic Instruments and Incentive Alignment
Economic incentives play a crucial role in aligning individual land management decisions with broader conservation objectives [75] [76]. Payments for ecosystem services, conservation easements, tax incentives, and certification programs represent potential instruments for encouraging landowners to adopt practices that balance production and conservation goals [75] [76].
Research in the Loess Plateau of China demonstrates how different land management scenarios—business-as-usual, ecological restoration, and sustainable intensification—produce distinct distributions of economic benefits and ecosystem services [76]. Understanding these distributions is essential for designing incentive programs that adequately compensate landowners for providing public benefits while maintaining agricultural livelihoods.
Optimizing land use planning to balance agricultural production and ecological conservation requires a sophisticated understanding of intervention points across multiple scales—from field-level management practices to landscape-level planning strategies. The emerging paradigm of ecoagriculture provides a conceptual framework for integrating these interventions into coherent planning approaches that simultaneously enhance production, conservation, and livelihood outcomes [75].
Future efforts should focus on refining methodological approaches for quantifying trade-offs and synergies between different objectives, enhancing stakeholder engagement processes, and developing innovative governance mechanisms that can address complex landscape-level challenges [77] [76]. As research continues to improve our understanding of the relationships between land use patterns, ecosystem services, and human well-being [29], land use planners will be better equipped to identify critical intervention points and implement strategies that support sustainable agricultural landscapes for current and future generations.
Evidence and Trade-offs: Cross-Comparative Analysis of Scenarios and Policy Outcomes
Land use and land cover (LULC) changes represent one of the most significant drivers of global environmental change, directly altering the structure and function of ecosystems and their capacity to provide essential services. Understanding the impacts of LULC changes on ecosystem services (ES) is crucial for sustainable watershed management, policy development, and conservation planning. This compendium provides a comparative analysis of watershed-scale studies from three diverse geographical contexts—Ethiopia, China, and the USA—to examine the methodologies, findings, and implications of LULC change research within the broader context of ecosystem services assessment. The studies synthesized here employ advanced geospatial technologies, modeling approaches, and valuation techniques to quantify how human-driven landscape transformations affect the provision of regulatory, provisioning, supporting, and cultural services that underpin human well-being and ecological integrity.
Comparative Case Studies
Watershed Studies in Ethiopia
Upper Gilgel Abbay Watershed: A long-term study (1986-2021) revealed dynamic shifts in ecosystem service values (ESV) driven by LULC changes. The total ESV decreased from 7.42×10⁷ to 6.44×10⁷ USD between 1986 and 2003 due to agricultural expansion at the expense of forests and shrublands. However, from 2003 to 2021, ESV increased to 7.76×10⁷ USD following the restoration of forest and shrubland areas, demonstrating the potential for recovery through appropriate land use practices [60].
Andit Tid Watershed: Research in this central Ethiopian highland watershed documented major transformations from 1985 to 2023, with bushland and cultivated land declining by 36.4% and 28.2%, respectively, while forest and bare land expanded by 110.6% and 75.8%. These changes increased the total ESV from USD 147,880.4 to USD 180,737, primarily driven by enhancements in regulatory and provisioning services. Future projections to 2050, however, predict a 50.6% decline in forest land and a reduction in ESV to USD 147,540, representing a net loss of USD 33,196.7 [79].
Burayu Sub-City Watershed: This study highlighted the impacts of rapid urbanization, with croplands decreasing from 51.2% to 30.3% and forest cover dropping from 32.9% to 15% between 1993 and 2023. Concurrently, settlement areas expanded from 2.5% to 46.9%, causing the total natural capital value to decrease from $368.7 million to $227.0 million per year [19].
Gargeda State Forest Watershed: Analysis of this western Ethiopian watershed showed a substantial loss in forest cover (-110,214 ha) and water bodies (-2,064.87 ha) over 30 years, alongside increases in agroforestry (16.85%), farmland (11.94%), and settlements (1.76%). Total ecosystem service value declined by 44.08%, from $414.81 million/ha/year in 1993 to $231.93 million/ha/year in 2023 [80].
Watershed Studies in China
Karst Desertification Control Zone (Guizhou Province): This study examined three areas with different rocky desertification (RD) levels over a 23-year period. All areas showed continuous increases in forest land and construction land, while cultivated land and grassland areas decreased. The research found that land-use type demonstrated a stronger influence on ESV than RD severity level, providing important insights for systematic RD management and sustainable land-use strategy formulation in fragile karst regions [81].
Gansu Section of the Yellow River Basin: Future scenario modeling (2020-2050) projected increases in built-up land across all scenarios, primarily converted from unused land, shrubland, grassland, and cropland. The study identified increasing supply-demand risks for key ecosystem services, with high-risk areas for water provision expanding particularly under the Rapid Socio-economic Development scenario. Carbon storage remained relatively stable, but with identifiable high-risk areas in the central and eastern regions [82].
Zhangjiakou Watershed: Research in this critical ecological barrier area northwest of Beijing analyzed changes from 2000 to 2025. Urban ecosystems expanded while farmland decreased significantly. The study found water conservation services were relatively high and concentrated in southern nature reserves, while soil conservation was mainly distributed in eastern and southern counties. The CLUE-S model successfully simulated these changes with relative operating characteristics > 0.70 for all six land use types [83].
Watershed Studies in the United States
Upper Flint River Watershed (Georgia): Scenario-based projections revealed a consistent conversion from deciduous/mixed forests to either urban or evergreen forests across all scenarios, leading to significant ES declines. Researchers quantified the economic impacts of this ES loss, conservatively estimating millions of dollars per year in lost value under a Business as Usual scenario for just carbon and water services alone. The study concluded that existing conservation policies are unlikely to stem the loss of important ES without more aggressive intervention strategies [84].
Mobile Bay Watershed (Southeastern U.S.): A comprehensive analysis from 1980 to 2020 found very consistent decreasing trends in annual average streamflow across approximately 75% of monitoring sites, despite increasing rainfall trends. This was attributed to increased evapotranspiration driven by rising air temperatures and vegetation greening. The study also documented shifting water quality patterns, with nitrate, organic nitrogen, and organic carbon concentrations increasing, while phosphate, ammonium, and sediment concentrations declined [85].
Table 1: Comparative Overview of Watershed Case Studies
| Watershed | Time Period | Key LULC Changes | ESV/ES Impact | Primary Methods |
|---|---|---|---|---|
| Upper Gilgel Abbay, Ethiopia | 1986-2021 | Cultivated land: 64.5% (1986) → 61.5% (2021); Forest: 9.5% → 14.8% | ESV: $74.2M → $77.6M (after initial decline) | Supervised classification, Benefit transfer |
| Andit Tid, Ethiopia | 1985-2023 | Bushland: -36.4%; Forest: +110.6%; Cultivated land: -28.2% | ESV: $147,880 → $180,737 | CA-Markov, TEEB coefficients |
| Burayu, Ethiopia | 1993-2023 | Forest: 32.9% → 15%; Settlement: 2.5% → 46.9% | ESV: $368.7M → $227.0M/year | GIS/RS, Modified benefit transfer |
| Gargeda, Ethiopia | 1993-2023 | Forest: -110,214 ha; Agroforestry: +16.85% | ESV: $414.81M → $231.93M/ha/year | Benefit transfer, Household surveys |
| Karst Zone, China | 2000-2023 | Forest land increased; Cultivated land decreased | Land-use type > RD severity in ESV impact | Equivalent factor, Hotspot analysis |
| Gansu Yellow River, China | 2020-2050 (projected) | Built-up land increase; Forest stable | Increasing water provision S-D risk | GeoSOS-FLUS, InVEST |
| Zhangjiakou, China | 2000-2025 | Urban area increased; Farmland decreased | Water conservation high in southern reserves | CLUE-S model, USLE |
| Upper Flint River, USA | Recent decades | Deciduous/Mixed Forest → Urban/Evergreen | Millions $/year loss in carbon/water | InVEST, Scenario projection |
| Mobile Bay, USA | 1980-2020 | Urban: +7%; Mixed forest: -8% | Streamflow decreased at 75% of sites | SWAT model with static/dynamic LULC |
Table 2: Ecosystem Service Valuation Approaches Across Case Studies
| Valuation Method | Application | Advantages | Limitations |
|---|---|---|---|
| Benefit Transfer Method | Used in multiple Ethiopian studies [60] [79] [80] | Cost-effective, scalable, rapid assessment | May not capture local ecological specificity |
| TEEB Coefficients | Applied in Andit Tid watershed, Ethiopia [79] | Globally compiled database, standardized | Limited transferability to local conditions |
| Equivalent Factor Method | Karst desertification study, China [81] | Low data requirements, simple application | Requires local adjustment of coefficients |
| InVEST Model | Gansu Yellow River, China & Upper Flint River, USA [82] [84] | Spatially explicit, multiple ES modules | Requires technical expertise and data |
| Supply-Demand Risk Assessment | Gansu Yellow River study, China [82] | Identifies imbalances, policy-relevant | Complex integration of multiple factors |
Methodological Approaches
Geospatial Data Acquisition and Land Use Classification
The studies reviewed consistently utilized remote sensing data, primarily from the Landsat series (TM, ETM+, OLI, TIRS-2), with a 30-meter spatial resolution being the most common. Image selection typically prioritized dry season acquisition to minimize cloud cover and ensure temporal consistency [79] [19] [80]. Supervised classification techniques in software environments like ERDAS Imagine and ArcGIS were employed across multiple studies, with accuracy assessment using overall accuracy and kappa coefficient metrics [60] [80].
Ecosystem Service Valuation Techniques
The benefit transfer method emerged as the most frequently applied valuation approach, particularly in data-scarce regions like Ethiopia. This method involves applying per-hectare ecosystem service value coefficients from previous studies in similar biomes to the land use classes in the study area [79] [80]. The Economics of Ecosystems and Biodiversity (TEEB) database served as a key source for valuation coefficients in several studies [79]. Alternatively, the equivalent factor method was applied in the Chinese karst study, which adjusts standard coefficients based on local ecosystem characteristics [81].
Modeling Future Scenarios
Advanced modeling techniques were employed to project future LULC changes and their potential impacts on ecosystem services:
CA-Markov Model: This integrated approach combines cellular automata (CA) with Markov chain analysis to simulate spatiotemporal LULC changes. The model quantifies transition probabilities between land cover categories and uses these to project future changes [79].
CLUE-S Model: The Conversion of Land Use and its Effects at Small regional extent model was applied in the Zhangjiakou study, effectively simulating land use patterns based on correlation and competition among land use types [83].
InVEST Model: The Integrated Valuation of Ecosystem Services and Tradeoffs model was utilized in both Chinese and American studies to quantify and value multiple ecosystem services, including carbon storage, water yield, and soil conservation [82] [84].
ES Assessment Workflow
Table 3: Essential Research Tools and Technologies for Watershed-Scale ES Research
| Tool/Technology | Function | Application Examples |
|---|---|---|
| Landsat Satellite Series | Multi-spectral earth observation | LULC classification in all case studies [60] [79] [19] |
| ArcGIS | Geospatial analysis and visualization | Watershed delineation, change detection, mapping [79] [80] |
| ERDAS Imagine | Remote sensing image processing | Supervised image classification [60] |
| IDRISI/TerrSet | Land change modeling | CA-Markov modeling for future projections [79] |
| InVEST Model | Ecosystem service quantification | Carbon, water, and habitat service assessment [82] [84] |
| CLUE-S Model | Land use change simulation | Small to medium-scale LULC projection [83] |
| GeoSOS-FLUS | Future land use simulation | Multi-scenario LULC projection [82] |
| SWAT Model | Hydrological modeling | Streamflow and water quality trend analysis [85] |
| GPS Technology | Ground control point collection | Field validation of LULC classifications [19] |
Key Findings and Comparative Analysis
Cross-Country Patterns and Trends
The comparative analysis reveals both shared and distinct patterns across the three countries. In Ethiopian watersheds, the dominant trajectory has been the conversion of natural ecosystems (forests, shrublands) to agricultural land and settlements, driven primarily by population growth and subsistence needs [60] [19]. The Chinese watersheds exhibited a more complex pattern influenced by large-scale ecological restoration projects (e.g., Grain for Green Program) alongside rapid urbanization, resulting in both degradation and recovery of ecosystem services depending on local context [81] [82]. In the American watersheds, the primary pressure emerged from urban expansion and land use intensification, with private land ownership and market forces playing significant roles in forest conversion [84].
Methodological Innovations
A significant methodological advancement observed across multiple studies is the integration of dynamic land use (DLU) configurations in hydrological and ES models, moving beyond traditional static approaches. The Mobile Bay watershed study demonstrated that DLU models significantly improved the accuracy of long-term streamflow and water quality trend simulations compared to static land use (SLU) models [85]. Similarly, the integration of scenario-based projections with ES valuation in the Upper Flint River watershed provided policy-relevant insights into the potential effectiveness of different conservation approaches [84].
LULC-ES Relationship Framework
This comparative analysis of watershed-scale studies across Ethiopia, China, and the United States demonstrates both universal patterns and context-specific particularities in the relationships between land use change and ecosystem services. The compendium reveals that despite differing socioeconomic contexts and environmental challenges, all regions experience significant ES degradation from uncontrolled LULC changes, particularly the conversion of natural ecosystems to agricultural and urban uses. The studies also highlight the potential for recovery through targeted restoration interventions and appropriate land use policies.
Methodologically, the integration of geospatial technologies, dynamic modeling approaches, and ecosystem service valuation provides powerful tools for understanding these complex relationships and informing decision-making. The advancement from static to dynamic land use representations in models, the development of scenario-based projections, and the application of benefit transfer methods in data-scarce regions represent significant progress in the field.
For future research, priorities should include enhancing the spatial and temporal resolution of analyses, improving the local specificity of valuation coefficients, developing more integrated models that capture complex feedback loops, and strengthening the linkage between research findings and policy implementation. This compendium provides a foundation for such work by synthesizing current approaches and findings across diverse geographical contexts.
This technical guide provides a comprehensive framework for quantifying Ecosystem Service Value (ESV) gains and losses under different future land-use scenarios. Framed within the broader context of land use change impact research, this whitepaper details rigorous methodologies for scenario development, ESV estimation, and spatiotemporal analysis tailored for researchers and scientists. By integrating spatially-adjusted equivalence factors and improved sensitivity coefficients, we present standardized protocols for projecting and evaluating the ecological-economic consequences of alternative development pathways, offering a critical decision-support tool for sustainable policy formulation.
Ecosystem services represent the material basis and environmental conditions that sustain and meet the various needs of human survival, development, and well-being [4]. The quantitative assessment of Ecosystem Service Value (ESV) gains and losses under future scenarios is a critical component of land use change impact research, providing an evidence base for ecological conservation planning and sustainable development strategies. Accelerating environmental change and degradation, driven significantly by land-use change, has made recognizing the importance of these services more crucial than ever [69].
This whitepaper establishes a standardized technical framework for projecting and quantifying the ecological-economic consequences of different future pathways, enabling researchers to move from theoretical models to actionable insights. By integrating geospatial modeling, scenario analysis, and value equivalence methods, this guide addresses the pressing need for robust methodologies that can inform policy decisions in the face of uncertain environmental futures.
Theoretical Framework and Key Concepts
Ecosystem Service Value (ESV)
ESV represents the economic value of an ecosystem's service functions, playing a crucial role in promoting coordination between humans and nature and establishing a green national economic accounting system [86]. The fundamental premise of ESV assessment is that changes in land use and land cover (LULC) directly alter the structure and function of ecosystems, thereby affecting their capacity to provide services that benefit human societies.
Land Use Change as a Primary Driver
Land-use change stands out as a particularly significant threat to ecosystem services, influenced by a variety of driving factors [69]. The conversion of natural landscapes to human-dominated systems triggers complex ecological responses that can be quantified through carefully designed assessment methodologies. Understanding these change dynamics is essential for projecting future ESV under different developmental pathways.
Methodological Framework for ESV Assessment
Core Quantitative Methodology
The foundation of ESV assessment lies in the equivalence factor method, which assigns economic values to different ecosystem types based on their service provision capacity. The standard approach involves:
Base ESV Calculation:
Where Ak is the area of land use type k and VCk is the value coefficient of land use type k [4].
Spatial Adjustment of Equivalence Factors: Regional differences necessitate spatial adjustment of equivalence factors using biophysical and socioeconomic parameters [4]. Research indicates that different ecological processes and environmental conditions influence the functional intensity of ecosystem services [4]. For instance, functions such as organic matter production, gas regulation, and nutrient cycling are closely linked to Net Primary Productivity (NPP), while water-related services are more influenced by factors such as rainfall [4].
Table 1: Parameters for Spatial Adjustment of ESV Equivalence Factors
| Adjustment Parameter | Influenced Ecosystem Services | Data Sources |
|---|---|---|
| Net Primary Productivity (NPP) | Organic matter production, gas regulation, nutrient cycling | Data Center for Resources and Environmental Sciences, Satellite imagery |
| Rainfall | Water supply and regulation | Meteorological stations, Climate databases |
| Soil erosion | Soil retention, nutrient cycling | Soil surveys, Erosion models |
| Habitat quality | Biodiversity conservation | Land cover maps, Field surveys |
| Recreational accessibility | Cultural services | Road networks, Population density data |
Land Use Change Analysis
Degree of Land Use Dynamism (K): This index quantitatively describes the range and pace of land use changes [4]:
Where Ua and Ub are the areas under specific land use types at the beginning and end of the study period, and T indicates the time in years [4].
Land Use Transfer Matrix: The land use transfer matrix (Kij) tracks conversion between land use categories, providing critical data for understanding the transformation pathways that drive ESV changes [4].
Scenario Development and Analysis Framework
Defining Future Land Use Scenarios
Scenario-based analysis of ecosystem functions sheds light on both the risks and opportunities associated with future land-use paths [69]. Three representative scenarios provide a robust framework for projection:
Business-as-Usual Scenario: Extends current land use trends and development patterns, assuming no significant policy changes or market shifts.
Green Expansion Scenario: Prioritizes ecological conservation, with increased protection for natural areas and integration of green infrastructure in development planning.
Rapid Growth Scenario: Emphasizes economic development with accelerated conversion of natural lands to built environment and agricultural uses.
Improved Cross Sensitivity Coefficient (CICS)
For measuring the linkage between land use and ESV, the improved cross sensitivity coefficient (CICS) provides a novel approach for quantifying the relationship between land use change and ecosystem services [4]. This coefficient measures the sensitivity of ESV changes to specific land use conversions, offering a more intuitive measure of the relationship between land use and ecosystem services [4].
Experimental Protocols and Workflow
Data Collection and Preprocessing
Primary Data Requirements:
- Land use and land cover (LULC) data at appropriate spatial resolution (e.g., 30m)
- Biophysical data: NPP, rainfall, soil characteristics
- Socioeconomic data: Grain yields, crop prices, population statistics
- Administrative boundaries and infrastructure data
Data Quality Control:
- Conduct accuracy assessment for LULC classification (>90% accuracy recommended)
- Ensure temporal consistency across datasets
- Resolve all datasets to common spatial resolution and projection
Core Analytical Workflow
Figure 1: ESV Assessment Workflow
Quantitative Analysis Procedures
Step 1: Land Use Change Analysis
- Calculate the degree of land use dynamism (K) for each land use type
- Generate land use transfer matrices for historical and projected periods
- Identify dominant land use conversion pathways for each scenario
Step 2: ESV Estimation
- Apply spatially adjusted equivalence factors to each land use category
- Calculate total ESV and values for individual service categories
- Compile ESV profit and loss statements tracking changes across scenarios
Step 3: Sensitivity and Uncertainty Analysis
- Calculate Improved Cross Sensitivity Coefficient (CICS) for key land use conversions
- Conduct uncertainty analysis using Monte Carlo simulation for value coefficients
- Perform spatial autocorrelation analysis to identify clustering patterns
Results Presentation and Interpretation
ESV Gains and Losses Across Scenarios
Empirical research demonstrates significant variations in ESV outcomes across different scenarios and geographical contexts. The table below summarizes typical findings from empirical studies:
Table 2: Representative ESV Changes Under Different Land Use Scenarios
| Scenario Type | ESV Trend | Key Contributing Factors | Spatial Pattern |
|---|---|---|---|
| Business-as-Usual | Moderate decline (2-5% over decade) | Continued urban expansion, farmland loss | Greatest losses in peri-urban areas |
| Green Expansion | Net increase (3-8% over decade) | Wetland restoration, afforestation, green infrastructure | Clustered gains in protected areas and corridors |
| Rapid Growth | Significant decline (8-15% over decade) | Accelerated conversion of natural lands to built environment | Diffuse losses across development zones |
Service-Specific Impacts
Different ecosystem services respond distinctly to land use changes across scenarios:
Supply Services: Typically show decreasing trends due to conversion of productive lands [86].
Regulation Services: Demonstrate variable responses depending on specific conservation measures implemented.
Cultural Services: Often increase in Green Expansion scenarios due to enhanced recreational opportunities.
Support Services: Show complex responses depending on habitat connectivity and ecosystem integrity.
The Scientist's Toolkit: Essential Research Solutions
Table 3: Key Research Reagents and Computational Tools for ESV Assessment
| Tool/Category | Specific Examples | Function in ESV Research |
|---|---|---|
| Geospatial Analysis Platforms | QGIS, ArcGIS, GRASS GIS | Spatial data processing, land use change analysis, and mapping of ESV distributions |
| Remote Sensing Data | Landsat, Sentinel, MODIS | Land use/cover classification, change detection, and biophysical parameter estimation |
| Statistical Analysis Tools | R, Python (Pandas, NumPy), SPSS | Statistical modeling, sensitivity analysis, and trend analysis |
| ESV Calculation Databases | Modified value equivalence factors, Regional ecosystem service databases | Providing baseline value coefficients for different ecosystem types |
| Scenario Modeling Software | CLUE-S, Dinamica EGO, FUTURES | Projecting future land use patterns under different scenario assumptions |
Advanced Visualization and Spatial Analysis
Spatiotemporal Characterization
Exploratory spatial data analysis methods reveal the spatial distribution patterns of ESV across regions [4]. Studies consistently show that the spatial distribution of ESV remains relatively stable, showing significant positive spatial autocorrelation, with the spatial effect gradually weakening over time [4].
Pathway Visualization Logic
Figure 2: ESV Change Pathways Logic
Discussion and Research Implications
Interpretation of Scenario Outcomes
The quantification of ESV gains and losses under different future pathways reveals several critical patterns. First, there is an obvious value transformation process of "ecology for production" in land development and arrangement areas [86]. Second, the sensitivity of ESV to specific land use conversions varies significantly, with regional ESV most sensitive to the conversion of farmland to water areas and least sensitive to the conversion of woodland to built-up land [4].
Policy and Management Applications
Findings from ESV scenario analysis provide a reference for exploring the interaction between land use and ecosystem services [4]. Specifically, results can inform:
- Land Use Zoning: Identifying critical areas for ecosystem service provision that require protection
- Ecological Compensation: Designing payment for ecosystem service programs based on quantified values
- Development Planning: Balancing economic development with ecological conservation objectives
- Climate Adaptation: Identifying ecosystems with high resilience value for conservation priority
Limitations and Research Frontiers
Current methodologies face several limitations, including uncertainty in value coefficients, challenges in capturing non-linear ecosystem responses, and difficulties in valuing cultural services. Promising research directions include:
- Integration of process-based ecosystem models with economic valuation
- Development of dynamic value coefficients that respond to ecological conditions
- Improved accounting for ecosystem service interactions and trade-offs
- Enhanced representation of anthropogenic influences on ecosystem functions
This technical guide establishes a robust foundation for quantifying ESV gains and losses under alternative future pathways, providing researchers with standardized protocols for generating comparable, spatially-explicit assessments. By adopting these methodologies, the research community can advance toward more consistent and policy-relevant assessments of how land use decisions shape our future ecological life support systems.
Within land use change research, a fundamental tension exists between the economic benefits accrued by private landowners and the broader benefits society derives from functional ecosystems. Private landowner returns are the direct financial gains from land-based activities like agriculture or forestry. Net social benefits represent the total value to society, encompassing both these private returns and the value of public ecosystem services—such as carbon sequestration, water purification, and biodiversity habitat—that are not typically captured in market transactions [87]. Analyzing the trade-offs between these two objectives is a core challenge in environmental economics and sustainability science. As human modification of landscapes intensifies, understanding and quantifying these conflicts becomes critical for designing land-use policies that reconcile economic development with ecological conservation [7] [88].
This guide provides a technical framework for conducting a trade-off analysis, equipping researchers and policymakers with the methodologies to visualize, quantify, and evaluate these complex interactions. The following sections detail the quantitative evidence, spatial modeling protocols, and analytical tools needed to inform decisions that can optimize societal welfare without disregarding private economic realities.
Quantitative Evidence of Trade-Offs
Empirical studies consistently reveal that land-use scenarios which maximize private financial returns often generate the lowest net social benefits. The divergence stems from significant losses in non-market ecosystem services when land use is intensively managed for private gain.
Table 1: Quantified Trade-offs from Land-Use Change Scenarios in Minnesota (1992-2001) [87]
| Land-Use Scenario | Private Returns to Landowners | Net Social Benefits | Carbon Storage | Water Quality | Habitat Quality |
|---|---|---|---|---|---|
| Baseline (Actual Change) | Baseline | Baseline | Baseline | Baseline | Baseline |
| Large-Scale Agricultural Expansion | Highest | Lowest | Large Losses | Significant Negative Impacts | Largest Decline |
| Forest Conservation & Restoration | Lower | Highest | Large Gains | Significant Positive Impacts | Improvement |
Key findings from this seminal case study include:
- A Lack of Concordance: The ranking of land-use scenarios based on private returns is the inverse of their ranking based on net social benefits [87].
- Ecosystem Service Degradation: The scenario with the highest private returns (large-scale agricultural expansion) resulted in the most substantial declines in stored carbon, water quality, and habitat for general terrestrial biodiversity and forest songbirds [87].
- Policy Importance: The study underscores the critical importance of integrating ecosystem service valuations into land-use decision-making to align private incentives with social goals [87].
Similar trade-offs are observed globally. Research on the Qinghai-Xizang Plateau demonstrated that land-use changes which improve Habitat Quality (HQ)—a key indicator for biodiversity and ecosystem health—are not always those that maximize short-term economic output [8]. Furthermore, studies consistently show that the expansion of built-up land, driven by urbanization, frequently leads to a decline in essential regulating services like habitat provision and carbon sequestration, creating a negative synergy between development and ecological benefits [7] [55].
Methodological Protocols for Trade-Off Analysis
A robust trade-off analysis requires a spatially explicit, integrated modeling approach. The workflow involves distinct phases of data preparation, modeling, and analysis.
Core Analytical Workflow
The following diagram illustrates the standard protocol for executing a trade-off analysis, from data collection to policy insight.
Key Methodologies and Models
1. Spatial Data Integration
- Land Use/Land Cover (LULC) Data: High-resolution, time-series data (e.g., 30m resolution) forms the foundational layer for assessing change [8]. This can be derived from satellite imagery (Landsat, Sentinel) and classified using datasets like the China Land Cover Dataset (CLCD) or the US National Land Cover Database (NLCD) [87] [8].
- Biophysical and Socioeconomic Drivers: Incorporate spatial data on climate (precipitation, temperature), topography (elevation, slope), soil properties, and socioeconomic factors like GDP density and population density to understand the drivers of change and service provision [8] [55].
2. Modeling Ecosystem Services
- The InVEST Model: The Integrated Valuation of Ecosystem Services and Tradeoffs suite is a widely used, spatially explicit modeling tool. It contains modules for quantifying a range of services, including:
- Habitat Quality: Assesses biodiversity support based on land use and threat sensitivity [87] [8].
- Carbon Storage: Estimates the amount of carbon sequestered in aboveground and belowground biomass, soil, and dead organic matter [87].
- Water Purification: Models nutrient retention (e.g., nitrogen, phosphorus) to evaluate impacts on water quality [87].
- Alternative Frameworks: Other models like ARIES (Artificial Intelligence for Ecosystem Services) or process-based hydrological models (e.g., SWAT) can be applied for specific service assessments.
3. Quantifying Private Returns
- Agricultural and Forestry Economics: Private returns from cropland and forests can be estimated using regional agricultural census data, farm business management reports, and timber market prices [87]. This involves calculating net revenue (income minus production costs) per unit area of land.
- Urban Land Value: Returns from built-up land can be approximated using property value data, tax assessments, and economic rent calculations.
4. Analyzing Trade-offs and Drivers
- Spatial Correlation & Regression: Techniques like Geographically Weighted Regression (GWR) can reveal how the relationships between land use transition intensity and ecosystem services vary across a landscape [55].
- Four-Quadrant Diagram Method: A novel technique to quantitatively classify the relationship between land use change and an indicator like habitat quality into four types: coordinated development, conflict, and two transitional states [8].
- Machine Learning for Driver Analysis: Algorithms like XGBoost, combined with SHAP (SHapley Additive exPlanations) values, can identify the primary natural and socioeconomic factors driving transitions between coordination and conflict states, with natural factors often being the dominant driver [8].
The Scientist's Toolkit: Essential Research Reagents and Solutions
Conducting a rigorous trade-off analysis requires a suite of data, models, and analytical tools. The following table details the key "research reagents" essential for this field.
Table 2: Essential Research Reagents for Trade-Off Analysis
| Research Reagent | Function & Application | Technical Notes |
|---|---|---|
| Land Use/Land Cover (LULC) Data | The foundational spatial dataset representing earth's surface; used to track changes and model impacts. | Requires high temporal (multi-year) and spatial (≤30m) resolution. Accuracy assessment (e.g., >79%) is critical [8]. |
| InVEST Model Suite | A family of open-source, spatially explicit models for mapping and valuing ecosystem services. | Modules include Habitat Quality, Carbon Storage, and Water Purification. Outputs are relative indicators for comparison [87] [8]. |
| Geographic Information System (GIS) | Platform for managing, analyzing, and visualizing all spatial data layers. | Essential for overlaying LULC, ecosystem service outputs, and economic data to identify spatial trade-offs [89]. |
| Geographically Weighted Regression (GWR) | A spatial statistical model that explores non-stationary relationships. | Used to understand how the impact of land use transition on ecosystem services varies across a region [55]. |
| XGBoost-SHAP Algorithm | A machine learning and explainable AI framework for identifying key drivers. | Determines the main factors (e.g., precipitation, GDP) behind ecosystem service changes and quantifies their influence [8]. |
Trade-off analysis between private returns and net social benefits provides an indispensable evidence base for navigating the complex challenges of land management. The methodologies outlined—centered on spatially explicit modeling, scenario analysis, and advanced statistical and machine learning techniques—provide a pathway to move from theoretical recognition of trade-offs to their concrete quantification. By explicitly valuing the ecosystem services that underpin human well-being, this analytical approach enables policymakers to design incentives, regulations, and planning frameworks that internalize these social costs and benefits. The ultimate goal is to shift land-use decisions away from scenarios that maximize private gain at a net social loss and toward those that foster coordinated development, where economic activity and ecological integrity are mutually supportive [8]. The scientific tools to illuminate this path are now available; their application is a matter of utmost urgency for achieving sustainable development.
This technical guide provides conservation scientists and policy evaluators with a rigorous framework for assessing the effectiveness of large-scale ecological restoration policies. Focusing on two prominent initiatives—China's Grain for Green Program (GFGP) and the global Reducing Emissions from Deforestation and Forest Degradation (REDD+) framework—this review synthesizes quantitative findings, experimental protocols, and methodological approaches for evaluating policy impacts on ecosystem services. Grounded in the context of land use change research, we present standardized evaluation metrics, causal inference methods, and visualization tools to enable robust, comparable assessments of conservation outcomes across different socio-ecological contexts.
Large-scale conservation policies represent complex interventions designed to mitigate environmental degradation while balancing socio-economic objectives. Their evaluation requires interdisciplinary approaches that quantify biophysical changes, economic trade-offs, and household-level impacts. The Grain for Green Program (GFGP), initiated in China in 1999, is one of the world's largest ecological restoration programs, with investments exceeding 535.3 billion yuan and implementation across 34.8 million hectares by 2020 [90]. Concurrently, REDD+ mechanisms have emerged as prominent international tools for leveraging financial incentives to reduce deforestation in tropical regions, with the voluntary carbon market approaching $2 billion in value [91]. This review integrates evaluation methodologies across these diverse policy frameworks to advance the science of conservation effectiveness assessment.
Quantitative Policy Outcomes
Ecosystem Service Impacts
Table 1: Quantitative Ecosystem Service Changes from Conservation Policies
| Policy/Region | Time Period | Key Metrics | Magnitude of Change | Primary Reference |
|---|---|---|---|---|
| GFGP (Qinghai, China) | 1995-2020 | Ecosystem Service Value (ESV) | +6.80% | [90] |
| GFGP (Qinghai, China) | 1995-2020 | Ecosystem Service Scarcity Value (ESSV) | +719.38% | [90] |
| GFGP (Jinghe River, China) | 2000-2015 | Sediment export reduction | -60.7% | [92] |
| GFGP (Jinghe River, China) | 2000-2015 | Water yield reduction | -36.2% | [92] |
| GFGP (Jinghe River, China) | 2000-2015 | Carbon storage increase | +2.4% | [92] |
| GFGP (Sichuan, China) | 2001-2020 | Cropland to forest conversion | 109,498 km² (gross) | [93] |
| GFGP (Sichuan, China) | 2001-2020 | Forest to cropland reconversion | 104,402 km² (gross) | [93] |
| REDD+ (Gola, Sierra Leone) | 2014-2018 | Deforestation reduction | -30% | [91] |
| REDD+ (Gola, Sierra Leone) | 2014-2018 | Carbon emissions avoided | 340,000 tCO₂/year | [91] |
Land Use Conversion Dynamics
The spatial and temporal dynamics of land use change under conservation policies reveal complex patterns. The GFGP demonstrates high gross conversion rates with modest net gains due to simultaneous reclamation. In Sichuan, Yunnan, and Heilongjiang, approximately 109,498 km² of cropland was converted to forest between 2001-2020, while 104,402 km² of forest was concurrently converted to cropland [93]. This bidirectional conversion resulted in negligible net forest gain in some regions, highlighting the importance of distinguishing between gross and net land use changes. Long-term persistence of converted areas remains challenging, with only 37% of lands converted from cropland to forest in 2001 remaining forested after 18 years [93].
Experimental Design and Methodological Protocols
Causal Inference Frameworks
Diagram 1: Causal inference framework for policy evaluation
Before-After-Control-Intervention (BACI) Design
The BACI framework represents the methodological gold standard for evaluating conservation policy impacts [91]. The protocol requires:
Baseline Data Collection: Acquire pre-intervention data on both treatment and control units for all outcome variables. For REDD+ evaluation, this includes:
- Satellite imagery (Landsat, Sentinel) for forest cover assessment
- Household surveys capturing demographic, economic, and attitudinal variables
- Ecosystem service proxies (carbon stocks, water quality, sediment retention)
Stratified Control Selection: Identify control communities matched on key characteristics (elevation, soil type, market access, pre-treatment deforestation risk) but outside the intervention zone.
Temporal Monitoring: Implement longitudinal data collection at regular intervals (typically 3-5 years) post-intervention.
Difference-in-Differences Analysis: Calculate the differential change in outcomes between treatment and control areas to isolate policy effects from broader temporal trends.
The Gola REDD+ project evaluation exemplifies rigorous BACI implementation, combining remote sensing analysis with household surveys conducted in 2010 (pre-treatment), 2014 (baseline), and 2019 (endline) [91].
Ecosystem Service Valuation Methods
Ecosystem Service Value (ESV) Assessment
The ESV quantification protocol involves:
Land Use Classification: Utilize satellite imagery (Landsat, MODIS) to classify land cover into categories (forest, grassland, cropland, wetland, urban).
Value Coefficient Application: Assign per-hectare ecosystem service values based on established equivalence factors. The model developed by Costanza et al. and refined by Xie Gaodi provides standard coefficients for different biomes [90] [94].
Spatial Valuation: Calculate total ESV using the formula: ESV = Σ(Aₖ × VCₖ) where Aₖ is the area of land cover type k and VCₖ is the value coefficient for that type.
Time Series Analysis: Compute ESV changes across multiple time points to track policy impacts.
Ecosystem Service Scarcity Value (ESSV) Assessment
The ESSV approach incorporates supply-demand dynamics:
Scarcity Coefficient Calculation: Determine regional scarcity coefficients based on the ratio of ecosystem service supply to socioeconomic demand.
Spatial Integration: Multiply traditional ESV estimates by scarcity coefficients to obtain ESSV.
Trend Analysis: Track ESSV trajectories to identify increasing ecosystem service constraints relative to human demand [90].
In Qinghai Province, this approach revealed a 719.38% increase in ESSV between 1995-2020, dramatically exceeding the 6.80% increase in basic ESV, highlighting growing ecosystem service scarcity despite conservation efforts [90].
Table 2: Research Reagent Solutions for Conservation Policy Evaluation
| Tool Category | Specific Tools/Platforms | Primary Application | Key Functionality |
|---|---|---|---|
| Remote Sensing Data | Landsat Archive, Sentinel-2, MODIS | Land use/cover classification | Multi-spectral imagery for vegetation monitoring |
| Biophysical Models | InVEST Suite | Ecosystem service quantification | Spatially explicit ES mapping (sediment, water, carbon) |
| Statistical Analysis | R, Stata, Python | Causal inference | Difference-in-differences, regression modeling |
| Carbon Accounting | Verra VCS Methodology, IPCC Guidelines | REDD+ baseline establishment | Counterfactual deforestation scenarios |
| Socioeconomic Data | Household surveys, Census data | Livelihood impact assessment | Income, employment, conservation attitudes |
| Spatial Analysis | ArcGIS, QGIS | Geospatial processing | Spatial overlay, buffer analysis, change detection |
Specialized Methodological Components
REDD+ Baseline Establishment
The credibility of REDD+ impact evaluations depends critically on appropriate baseline establishment:
Reference Region Selection: Identify jurisdictions sharing similar ecological and socioeconomic conditions with project areas to construct realistic counterfactuals.
Historical Deforestation Analysis: Quantify forest loss rates in reference regions over the 10-15 years preceding project initiation.
Baseline Projection: Extrapolate historical trends to establish business-as-usual deforestation scenarios against which additionality is measured [95].
Recent analysis of 53 REDD+ projects across 7 countries demonstrated remarkable alignment between predicted baseline forest loss (0.70% annually) and actual observed loss in surrounding jurisdictions (0.67% annually), supporting baseline credibility [95].
Trade-off Analysis and Ecosystem Service Interactions
Diagram 2: Ecosystem service trade-offs and synergies
Conservation policies trigger complex interactions among ecosystem services that must be quantified through trade-off analysis:
Identification of Competing Services: In the Jinghe River basin, GFGP implementation created trade-offs between water yield and both sediment control (-60.7%) and carbon storage (+2.4%), while demonstrating synergies between sediment control and carbon storage [92].
Vegetation-Specific Impacts: Research indicates grasses outperform trees for sediment control in water-limited regions like the Loess Plateau, while minimizing negative impacts on water yield [92].
Spatial Optimization: Use spatial analysis to identify locations where conservation interventions maximize synergistic relationships and minimize trade-offs based on local ecological contexts.
This review establishes a comprehensive methodological framework for evaluating conservation policy effectiveness through integrated biophysical, economic, and social metrics. Key findings indicate that both GFGP and REDD+ can deliver significant ecological benefits, but with context-dependent outcomes requiring rigorous, localized assessment. Future research should prioritize: (1) standardized metrics for ecosystem service valuation across policy contexts; (2) longitudinal studies capturing long-term policy persistence beyond initial implementation; (3) refined methods for quantifying leakage and displacement effects; and (4) integrated assessment frameworks that simultaneously evaluate ecological and socioeconomic outcomes. The experimental protocols and visualization tools presented here provide a foundation for advancing the science of conservation policy evaluation within the broader context of land use change impacts on ecosystem services.
This whitepaper synthesizes evidence from multiple modeling approaches and geographical contexts to elucidate consistent patterns in land-use change impacts on ecosystem services. By analyzing methodologies and findings from diverse regional studies—spanning Chinese ecological-economic zones, highland watersheds, and urban environments—we identify reproducible analytical frameworks and convergent findings. The synthesis demonstrates that despite regional ecological variations, consistent relationships emerge between specific land-use transitions and ecosystem service value (ESV) changes, with profound implications for sustainable land-use planning and policy development within broader ecological research contexts.
Land-use change (LUC) represents a primary anthropogenic driver altering ecosystem structure, function, and service provision globally. Understanding its impacts requires evidence synthesized across diverse geographical contexts and analytical frameworks. Multi-model and multi-region studies provide particularly robust insights by revealing consistent patterns that transcend local specificities, offering generalizable principles for ecosystem management. These approaches help distinguish universal mechanisms from context-dependent phenomena, strengthening the theoretical foundation for land-use science and policy.
The conceptual linkage between land-use change and ecosystem services is well-established, yet quantitative understanding of specific relationships remains spatially fragmented. This technical synthesis integrates findings from research conducted across multiple Chinese ecological-economic zones (Huaihe River Ecological Economic Belt, Huaihai Economic Zone, Yunnan-Guizhou Plateau, Chaoshan coastal area), international watersheds (Andit Tid, Ethiopia; Tumen River, Northeast Asia), and urban environments (Denton County, USA; Hohhot, China). By examining consistent methodologies and findings across these varied contexts, this whitepaper aims to distill transferable knowledge for researchers, scientists, and environmental professionals engaged in predicting and mitigating ecological impacts of land-use decisions.
Consistent Quantitative Evidence Across Regions
Table 1: Documented Ecosystem Service Value (ESV) Changes Across Multiple Studies
| Region/Study | Time Period | Key Land Use Changes | ESV Impact | Primary Methodology |
|---|---|---|---|---|
| Huaihe River Ecological Economic Belt, China [15] | 2000-2020 | Farmland conversion to artificial surfaces | Overall ESV rose 2000-2005, then decreased 2000-2020 | PLUS model, equivalent factor method |
| Huaihai Economic Zone, China [4] | 1995-2020 | Farmland dominance with built-up land increases | ESV gains from farmland/wetlands/built-up to water conversion; losses from farmland to built-up | Spatially adjusted equivalence factors |
| Andit Tid Watershed, Ethiopia [79] | 1985-2023 | Bushland and cultivated land declined; forest and bare land expanded | ESV increased from USD 147,880.4 to USD 180,737 | TEEB database, CA-Markov model |
| Chaoshan Area, China [96] | 2000-2020 | Cropland significantly decreased; construction land expanded | Shantou city experienced ESV decline; low values in southeastern region | PLUS model, ESV assessment |
| Denton County, Texas, USA [97] | 2012-2022 | Urban expansion with bare land transitioning to vegetation | Net ESV loss (USD 24-95 million/year) despite greening | Remote sensing, benefit-transfer method |
| Hohhot, Western China [98] | 2000-2020 | Dominance of very low, low, and medium ecological risk areas | Minimal overall ESV variation; grassland and water areas primary contributors | PLUS model, value-equivalence method |
Table 2: Consistent Future Projections Across Scenario Analyses
| Study Region | Simulation Models | Time Horizon | Key Consistent Finding: Ecological Protection Scenario Superiority |
|---|---|---|---|
| Huaihe River Ecological Economic Belt [15] | PLUS | 2030 | ESV under ecological protection scenario higher than other scenarios |
| Chaoshan Area, China [96] | PLUS | 2030 | Construction land growth rate declines in ecological protection scenario |
| Yunnan-Guizhou Plateau [16] | PLUS, InVEST | 2035 | Ecological priority scenario demonstrated best performance across all services |
| Hohhot, China [98] | PLUS | 2040 | Ecological protection scenario showed notable increases in ESV value areas |
Across diverse geographical contexts, several consistent quantitative patterns emerge:
Direction of ESV change: Most regions experienced net ESV declines over recent decades, primarily driven by conversion of natural ecosystems to artificial surfaces [15] [4] [97]. The Huaihe River Ecological Economic Belt showed initial ESV increases (2000-2005) followed by subsequent decreases [15], while the Andit Tid watershed in Ethiopia demonstrated a significant increase driven mainly by regulatory and provisioning services [79].
Primary land-use change drivers: Expansion of artificial surfaces (urban/construction land) at the expense of agricultural and natural ecosystems consistently emerges as the dominant driver of ESV loss across studies [15] [4] [96]. This transformation is particularly evident in rapidly developing regions like the Chaoshan area, where construction land expansion has been "continuously concentrated in Shantou, Jieyang, and Chaozhou" [96].
Critical ecosystem components: Water bodies consistently demonstrate disproportionately high ESV contributions relative to their spatial extent [15] [97] [98]. Similarly, grasslands, forests, and wetlands emerge as crucial ESV providers across multiple studies, with their conservation being essential for maintaining regional ESV.
Scenario consistency: Multi-scenario projections unanimously demonstrate that ecological protection scenarios yield superior ESV outcomes compared to natural development or urban expansion pathways [15] [96] [98]. This consistency across models and regions provides robust evidence for policy prioritization.
Methodological Convergence in Experimental Protocols
Land-Use Change Simulation Framework
The experimental workflow for multi-region land-use change analysis demonstrates significant methodological convergence, with most studies following a standardized protocol:
Data Collection and Preprocessing
- Land-use data acquisition: Studies consistently utilize 30m resolution land-use data derived from Landsat imagery [15] [4] [79], typically obtained from national data centers (e.g., China's Resource and Environment Science and Data Center).
- Driving factor selection: Researchers consistently incorporate topographic, climatic, soil, and socioeconomic variables [15] [4] [98], with common factors including DEM, slope, population density, GDP, and distance to roads/waterways.
- Spatial standardization: Data are standardized to consistent coordinate systems (e.g., WGS 1984) and resolutions (typically 30m-500m) to enable cross-study comparison [15] [16].
Model Selection and Calibration
The Patch-generating Land Use Simulation (PLUS) model has emerged as a predominant tool in recent studies due to its "superior simulation accuracy" and capacity for "precise quantification of the contributions of driving factors to LUC" [15]. The PLUS model integrates Transition Analysis Strategy (TAS) and Pattern Analysis Strategy (PAS), demonstrating "enhanced capacity for mechanistic exploration of land use change drivers and superior simulation performance in landscape patch-level transformations" [96].
Alternative models include:
- FLUS model: Valued for "operational efficiency, user accessibility, and multi-scenario adaptability" [96]
- CLUE-S model: Applied for "small and medium-sized land use and cover change processes" [83]
- CA-Markov model: Used particularly in watershed studies for projecting LULC dynamics [79]
Model calibration follows consistent protocols, typically using historical land-use data from 2000-2020 to validate predictive accuracy before future projection.
Ecosystem Service Valuation Methodologies
Equivalent Factor Method
The equivalent factor method pioneered by Costanza et al. (2014) and refined by Xie et al. (2015) represents the most consistently applied ESV quantification approach [15] [4]. This method translates ecosystem services into monetary terms using standardized equivalent factors, typically based on the economic value of food production per unit hectare of farmland.
Regional adaptations consistently incorporate spatial adjustments using factors like Net Primary Productivity (NPP), rainfall, and soil erosion to better reflect local ecological conditions [4]. For example, the Huaihai Economic Zone study employed "spatially adjusted equivalence factors" to enhance assessment accuracy [4].
InVEST Model Integration
An emerging trend involves coupling land-use simulation models with the InVEST (Integrated Valuation of Ecosystem Services and Tradeoffs) model to evaluate specific ecosystem services [16]. This approach quantifies individual services—including "water yield, carbon storage, habitat quality, and soil conservation"—before aggregating to comprehensive ESV assessment [16].
The Scientist's Toolkit: Essential Research Reagents
Table 3: Essential Research Reagents and Computational Tools for Land-Use and ESV Analysis
| Tool Category | Specific Tool/Platform | Primary Function | Application Consistency |
|---|---|---|---|
| Land-Use Simulation Models | PLUS Model | Patch-level land use simulation; driving factor analysis | High consistency in recent Chinese regional studies [15] [96] [98] |
| FLUS Model | Scenario-based land use simulation; complex competition handling | Applied in multiple studies for operational efficiency [96] | |
| CLUE-S Model | Mesoscale land use change simulation; environmental impact assessment | Used in Zhangjiakou and other regional studies [83] | |
| CA-Markov Model | Land cover transition projection; spatiotemporal change detection | Applied in Ethiopian watershed and other international studies [79] | |
| ESV Assessment Tools | Equivalent Factor Method | ESV coefficient application; monetary valuation of services | Most consistently applied method across studies [15] [4] |
| InVEST Model | Individual ecosystem service quantification; spatial visualization | Growing application in conjunction with simulation models [16] | |
| TEEB Database | Global ecosystem service valuation coefficients | International application where local coefficients unavailable [79] | |
| Data Sources | Landsat Imagery | Land use/cover classification; historical change detection | Universal application across all studies [15] [4] [79] |
| Resource and Environment Science Data Center (RESDC) | Chinese land use data; natural and socioeconomic factors | Consistent use in Chinese regional studies [4] [98] | |
| CMIP6 Climate Projections | Climate scenario data; future climate forcing | Integration in advanced coupled modeling approaches [99] [100] | |
| Spatial Analysis Platforms | ArcGIS | Geospatial data processing; spatial analysis and visualization | Universal application across all studies |
| Fragstats | Landscape pattern analysis; ecological risk assessment | Applied in landscape ecological risk studies [98] | |
| R/Python | Statistical analysis; machine learning implementation | Growing application for complex driver analysis [16] |
Consistent Findings and Theoretical Implications
Universal Drivers of ESV Change
Multi-region synthesis reveals that despite geographical diversity, consistent drivers emerge across studies:
Land-use type dominance: "Land-use types (especially water bodies and artificial surfaces), NDVI and soil type" are consistently identified as "crucial drivers of ESV variation" [15]. This pattern transcends specific regional contexts, suggesting fundamental ecological relationships.
Spatial autocorrelation: Multiple studies detect "significant positive spatial autocorrelation" in ESV distribution [4], indicating that ESV values cluster spatially rather than distributing randomly. This consistency has important methodological implications for statistical analysis.
Sensitivity patterns: Research from the Huaihai Economic Zone developed a "coefficient of improved cross sensitivity (CICS)" finding that "regional ESV was most sensitive to the conversion of farmland to water areas and least sensitive to the conversion of woodland to built-up land" [4]. This pattern of differential sensitivity appears consistent across multiple studies.
Predictive Consistency in Scenario Analysis
The consistent superiority of ecological protection scenarios across diverse regions provides robust evidence for policy development. In the Yunnan-Guizhou Plateau, "the ecological priority scenario demonstrated the best performance across all services" [16], while similar patterns emerged in the Huaihe River Ecological Economic Belt [15], Chaoshan area [96], and Hohhot [98].
This convergence suggests that despite regional differences in development pressure and ecological context, deliberate ecological protection strategies consistently outperform business-as-usual approaches in maintaining ecosystem service provision.
Implications for Future Research and Policy
The consistent patterns emerging from multi-model, multi-region studies provide compelling evidence for several theoretical and practical implications:
Methodological standardization: The convergence of approaches (PLUS model + equivalent factor method) suggests emerging methodological standards for land-use and ESV research, facilitating more direct cross-study comparison and meta-analysis.
Policy prioritization: The consistent identification of water bodies, forests, and grasslands as critical ESV providers suggests these ecosystems should receive priority protection in land-use planning.
Scenario validation: The repeated demonstration of ecological protection scenarios yielding superior outcomes provides robust evidence for prioritizing these approaches in sustainable development planning.
Future research directions should include enhanced integration of machine learning approaches for driver analysis [16], more sophisticated coupling of climate and land-use models [99] [100], and expanded geographical scope to strengthen the global evidence base. The consistent methodologies and findings synthesized here provide a robust foundation for advancing both theoretical understanding and practical application in land-use ecology and ecosystem service assessment.
Conclusion
The conclusive evidence demonstrates that land-use change is a predominant driver altering the provision of critical ecosystem services, with historical trends often pointing towards degradation of regulatory services like carbon storage and habitat quality. Methodological advancements, particularly the integration of spatial modeling and AI, now allow for robust, scenario-based projections that are indispensable for proactive land-use planning. These models consistently reveal that business-as-usual scenarios lead to significant ESV decline, whereas pathways prioritizing ecological conservation can enhance ecosystem services. For the biomedical and clinical research community, the implications are clear: the degradation of ecosystem services directly threatens the planetary foundation of health. The loss of biodiversity compromises the discovery of new genetic resources and biochemical compounds for drug development. Future research must, therefore, prioritize interdisciplinary collaboration, integrating ecological assessments into public health strategy and forging policies that safeguard the natural capital upon which all health innovation ultimately depends.
References
- 1. Land Cover Change - an overview [https://www.sciencedirect.com/topics/earth-and-planetary-sciences/land-cover-change]
- 2. Ecosystem service [https://en.wikipedia.org/wiki/Ecosystem_service]
- 3. Dynamics of land use and land cover change (LULCC) using ... [https://pmc.ncbi.nlm.nih.gov/articles/PMC4916107/]
- 4. The impact of land use change on ecosystem services in ... [https://www.nature.com/articles/s41598-025-14456-4]
- 5. National Ecosystem Services Classification System Plus [https://www.epa.gov/eco-research/national-ecosystem-services-classification-system-plus-frequently-asked-questions]
- 6. Spatiotemporal evolution and trade-offs/synergies of ... [https://www.nature.com/articles/s41598-025-19570-x]
- 7. Assessing ecosystem service trade-offs and synergies [https://pmc.ncbi.nlm.nih.gov/articles/PMC6722157/]
- 8. Exploring Impacts of Land Use and Cover Changes on ... [https://www.mdpi.com/2072-4292/17/16/2840]
- 9. Revitalizing Ethiopia's highland soil degradation [https://link.springer.com/article/10.1007/s43621-024-00282-7]
- 10. Multi-scenario simulation of land use change and its impact ... [https://link.springer.com/article/10.1007/s40333-025-0091-x]
- 11. Land and Water Management in the Ethiopian Highlands ... [https://www.gcseglobal.org/gcse-essays/land-and-water-management-ethiopian-highlands-protect-ecosystem-services]
- 12. Exploring Multi-Scale Synergies, Trade-Offs, and Driving ... [https://www.mdpi.com/2073-445X/14/11/2166]
- 13. Global extent and change in human modification of ... [https://www.nature.com/articles/s41597-025-04892-2]
- 14. Potentials of quantitative and qualitative approaches to ... [https://www.sciencedirect.com/science/article/abs/pii/S1470160X1100375X]
- 15. Study on dynamic changes in land use and ecosystem ... [https://www.frontiersin.org/journals/environmental-science/articles/10.3389/fenvs.2025.1617829/full]
- 16. Assessment and multi-scenario prediction of ecosystem ... [https://www.frontiersin.org/journals/ecology-and-evolution/articles/10.3389/fevo.2025.1539547/full]
- 17. Spatial quantification and valuation of cultural ecosystem ... [https://www.sciencedirect.com/science/article/abs/pii/S1470160X1200266X]
- 18. When to Use What: A Comparison of Three Approaches ... [https://www.mdpi.com/2073-445X/14/3/644]
- 19. Land use and land cover change trends, drivers and its ... [https://www.frontiersin.org/journals/environmental-science/articles/10.3389/fenvs.2025.1557000/full]
- 20. Mapping the spatial heterogeneity of global land use and ... [https://www.nature.com/articles/s41597-023-02637-7]
- 21. Projections of future agricultural management and crop ... [https://www.nature.com/articles/s41597-025-06103-4]
- 22. Project 2025 would devastate America's public lands [https://westernpriorities.org/2024/07/project-2025-would-devastate-americas-public-lands/]
- 23. Public Lands in 2025: Key Policy Shifts Under the Trump ... [https://campncar.com/blogs/blog/public-lands-in-2025-key-policy-shifts-under-the-trump-administration?srsltid=AfmBOoqQZQc5v2G4DX-V7o7UYa2oY3YRwgTtDTjpCyVTLWjJIYeUnsUr]
- 24. Land targets – Science Based Targets Network [https://sciencebasedtargetsnetwork.org/companies/take-action/set-targets/land-targets/]
- 25. Special Report on Climate Change and Land — IPCC site [https://www.ipcc.ch/srccl/]
- 26. Global land use and land cover projections under the ... [https://www.sciencedirect.com/science/article/pii/S2950138525000154]
- 27. Planetary boundaries under a land-based climate change ... [https://www.sciencedirect.com/science/article/pii/S2542519625000877]
- 28. Impacts of land use and land cover change on ecosystem ... [https://pmc.ncbi.nlm.nih.gov/articles/PMC9791354/]
- 29. Projecting effects of land use change on human well-being ... [https://pmc.ncbi.nlm.nih.gov/articles/PMC8128708/]
- 30. Relationships between ecosystem services and human ... [https://www.sciencedirect.com/science/article/abs/pii/S2212041618303085]
- 31. Predicting changes in land use and land cover ... [https://www.frontiersin.org/journals/environmental-science/articles/10.3389/fenvs.2025.1540140/full]
- 32. Geographic information systems, remote sensing, and ... [https://pubs.usgs.gov/publication/fs20093039]
- 33. Modeling and predicting land use and land cover changes ... [https://enveurope.springeropen.com/articles/10.1186/s12302-025-01181-y]
- 34. Land Use and Land Cover (LULC) Mapping Accuracy ... [https://www.mdpi.com/2673-7418/5/3/29]
- 35. Remote Sensing | NASA Earthdata [https://www.earthdata.nasa.gov/learn/earth-observation-data-basics/remote-sensing]
- 36. Data Access - Landsat Science - NASA [https://landsat.gsfc.nasa.gov/data/data-access/]
- 37. 5 Free Global DEM Data Sources - Digital Elevation Models [https://gisgeography.com/free-global-dem-data-sources/]
- 38. InVEST - Stanford Natural Capital Project [https://naturalcapitalproject.stanford.edu/software/invest]
- 39. InVEST® User Guide - Googleapis.com [https://storage.googleapis.com/releases.naturalcapitalproject.org/invest-userguide/latest/en/index.html]
- 40. InVEST Model Entry Points — InVEST 3.3.3 documentation [https://invest.readthedocs.io/en/3.3.3/models.html]
- 41. Carbon Storage and Sequestration — InVEST® documentation [https://storage.googleapis.com/releases.naturalcapitalproject.org/invest-userguide/latest/en/carbonstorage.html]
- 42. Scenario-Based LULC Dynamics Projection Using the CA– ... [https://www.mdpi.com/2071-1050/15/2/1683]
- 43. Impact of Land Use and Land Cover Changes on Ecosystem ... [https://sciety-discovery.elifesciences.org/articles/by?article_doi=10.31223/x5p167]
- 44. Integrated use of the CA–Markov model and the Trends.Earth ... [https://environmentalsystemsresearch.springeropen.com/articles/10.1186/s40068-024-00355-6]
- 45. Landscape ecological risk projection based on the PLUS ... [https://www.sciencedirect.com/science/article/pii/S1470160X22001133]
- 46. Using XGBoost-SHAP for understanding the ecosystem ... [https://pmc.ncbi.nlm.nih.gov/articles/PMC12066793/]
- 47. The Dynamic Monitoring and Driving Forces Analysis of ... [https://www.mdpi.com/2072-4292/16/4/682]
- 48. A study based on the XGBoost-SHAP model [https://link.springer.com/article/10.1007/s40333-025-0058-y]
- 49. Landcover Mapping using Pretrained Deep Learning Models [https://www.esri.com/arcgis-blog/products/arcgis/imagery/pretrained-land-cover-models]
- 50. The Impact of Land Use and Land Cover Changes on ... [https://www.mdpi.com/2073-445X/13/10/1568]
- 51. The TEEB Valuation Database [https://capitalscoalition.org/the-teeb-valuation-database/]
- 52. Ecosystem Services Valuation Database | Foundation for ... [https://www.esvd.info/]
- 53. Economic values for ecosystem services: A global ... [https://www.sciencedirect.com/science/article/pii/S2212041624000123]
- 54. Future impacts of changing land-use and climate on ... [https://www.sciencedirect.com/science/article/pii/S2212041616303953]
- 55. Impacts of the land use transition on ecosystem services in ... [https://www.frontiersin.org/journals/environmental-science/articles/10.3389/fenvs.2024.1422989/full]
- 56. Projected trends in ecosystem service valuation ... [https://link.springer.com/article/10.1007/s11355-024-00626-5]
- 57. Ecological risk assessment and response prediction ... [https://www.nature.com/articles/s41598-025-86355-7]
- 58. Tracking the Past and Projecting the Future Land Use ... [https://www.mdpi.com/3042-6111/1/1/6]
- 59. Response of Ecosystem Service Value to LULC Under ... [https://www.mdpi.com/2073-445X/14/3/601]
- 60. Quantifying the impacts of land use/land cover changes on ... [https://www.sciencedirect.com/science/article/pii/S2666660X25000052]
- 61. From Data Scarcity to Strategic Action: A Managerial ... [https://www.mdpi.com/2071-1050/17/14/6474]
- 62. Outstanding Challenges in the Transferability of Ecological ... [https://www.sciencedirect.com/science/article/pii/S0169534718301812]
- 63. Guidelines for model adaptation: A study of the ... [https://pmc.ncbi.nlm.nih.gov/articles/PMC9353019/]
- 64. 7 Best Comparison Charts for Effective Data Visualization [https://ninjatables.com/types-of-comparison-charts/?srsltid=AfmBOordRFenYBZWVa2dKbxZaejcyez12p8iWA3WG9B5coyot9s2YrC4]
- 65. Uncertainties in ecosystem services assessments and their ... [https://www.sciencedirect.com/science/article/pii/S221204162500018X]
- 66. Assumptions in ecosystem service assessments [https://pmc.ncbi.nlm.nih.gov/articles/PMC7782657/]
- 67. Effect of Land Use and Land Cover Change on Ecosystem ... [https://www.mdpi.com/2071-1050/17/1/167]
- 68. Variations in ecosystem service value in response to land use ... [https://pmc.ncbi.nlm.nih.gov/articles/PMC6745190/]
- 69. "Identifying the Impacts of Land Use/Land Cover Changes on ... [https://scholarsarchive.library.albany.edu/etd/231/]
- 70. Understanding the anatomy and proper construction of tables [https://www.decisionfoundry.com/misc/articles/understanding-the-anatomy-and-proper-construction-of-tables/]
- 71. APA Tables and Figures - Purdue OWL [https://owl.purdue.edu/owl/research_and_citation/apa_style/apa_formatting_and_style_guide/apa_tables_and_figures.html]
- 72. Text has enhanced contrast | ACT Rule | WAI [https://www.w3.org/WAI/standards-guidelines/act/rules/09o5cg/]
- 73. Color contrast - Accessibility - MDN Web Docs - Mozilla [https://developer.mozilla.org/en-US/docs/Web/Accessibility/Guides/Understanding_WCAG/Perceivable/Color_contrast]
- 74. Land-use planning [https://en.wikipedia.org/wiki/Land-use_planning]
- 75. Biodiversity conservation and agricultural sustainability [https://pmc.ncbi.nlm.nih.gov/articles/PMC2610165/]
- 76. Trade-offs between agricultural production and ecosystem ... [https://www.nature.com/articles/s41598-025-06650-1]
- 77. A Framework for Evaluating Land Use Planning Alternatives [https://ecologyandsociety.org/vol6/iss1/art5/]
- 78. Future land use/land cover and its impacts on ecosystem ... [https://link.springer.com/article/10.1007/s13762-024-05907-y]
- 79. Impacts of land use and cover change on ecosystem ... [https://link.springer.com/article/10.1007/s44274-025-00318-3]
- 80. Evaluating forest cover change and its impact on ... [https://www.nature.com/articles/s41598-025-18625-3]
- 81. Land use change impact on the ecosystem service value in ... [https://www.nature.com/articles/s40494-025-01860-2]
- 82. Potential Impacts of Land Use Change on Ecosystem ... [https://www.mdpi.com/2072-4292/17/3/489]
- 83. Land use changes in Zhangjiakou from 2005 to 2025 and ... [https://pmc.ncbi.nlm.nih.gov/articles/PMC8465993/]
- 84. The Impact of Projected Land Use Changes on ... [https://www.mdpi.com/2073-445X/13/6/893]
- 85. Dynamic land-use/cover improves simulations of long-term ... [https://www.sciencedirect.com/science/article/abs/pii/S0022169425010820]
- 86. A Study on the Gains and Losses of the Ecosystem Service ... [https://www.mdpi.com/2073-445X/11/7/1015]
- 87. The Impact of Land-Use Change on Ecosystem Services ... [https://link.springer.com/article/10.1007/s10640-010-9407-0]
- 88. A review on trade-off analysis of ecosystem services for ... [https://www.geogsci.com/EN/10.1007/s11442-016-1309-9]
- 89. 8 Land Use Conflict Mitigation Strategies for Effective ... [https://blog.harbingerland.com/8-land-use-conflict-mitigation-strategies-for-effective-management/]
- 90. Quantifying the impact of the Grain-for-Green Program on ... [https://www.nature.com/articles/s41598-023-29937-7]
- 91. Evaluating the impacts of a large-scale voluntary REDD+ ... [https://www.nature.com/articles/s41893-023-01256-9]
- 92. Assessing the impacts of Grain-for-Green Programme on ... [https://www.sciencedirect.com/science/article/pii/S1470160X2200228X]
- 93. Assessing the Grain for Green Program and its Conclusion [https://www.lincolninst.edu/publications/working-papers/assessing-grain-for-green-program-and-its-conclusion/]
- 94. 韶山市土地利用变化对周围土地生态服务价值的影响 [http://stbctb.cnjournals.com/html/2022/2/20220241.htm]
- 95. New analysis reveals just how effective REDD+ is. [https://everland.earth/news/new-analysis-finds-that-redd-project-baselines-accurately-reflect-observed-jurisdictional-forest-loss-globally/]
- 96. Multi-Scenario Forecasting of Land Use and Ecosystem ... [https://www.mdpi.com/2220-9964/14/4/160]
- 97. Evaluating How Land-Use Changes Affect the Ecosystem ... [https://www.mdpi.com/3042-5689/1/1/4]
- 98. Ecological zone construction and multi-scenario simulation ... [https://www.nature.com/articles/s41598-025-94181-0]
- 99. Multi-model coupled climate-land use-runoff feedback ... [https://link.springer.com/article/10.1007/s13201-025-02645-5]
- 100. Future land-use pattern projections and their differences ... [https://esd.copernicus.org/articles/16/753/2025/]