Integrating Ecosystem Services into Land Use Optimization: Models, Applications, and Future Directions
This article provides a comprehensive examination of the methodologies and applications for optimizing land use to enhance multiple ecosystem services (ES).
Integrating Ecosystem Services into Land Use Optimization: Models, Applications, and Future Directions
Abstract
This article provides a comprehensive examination of the methodologies and applications for optimizing land use to enhance multiple ecosystem services (ES). It explores the foundational relationship between land use change and ES, reviews integrated modeling frameworks like InVEST-GMOP-PLUS, and addresses key challenges including trade-off management and policy integration. Through comparative analysis of simulation models and scenario planning, it offers evidence-based strategies for researchers and policymakers to balance ecological integrity with socio-economic development, with specific implications for sustainable landscape management.
The Inextricable Link: How Land Use Change Drives Ecosystem Service Dynamics
Foundational Concepts FAQ
1. What is the fundamental link between LUCC and Ecosystem Service Valuation? Land Use and Land Cover Change (LUCC) directly alters the structure and function of ecosystems, thereby affecting the type, quality, and quantity of ecosystem services they provide. Ecosystem Service Valuation (ESV) is the process of assigning a quantitative value, either in biophysical or monetary terms, to these services. Thus, LUCC is a primary driver of changes in ESV, and valuation is a critical tool for making the impacts of land use decisions transparent [1] [2]. Assessing ESV in response to LUCC allows policymakers and land managers to understand the trade-offs and synergies associated with different land development strategies.
2. What are the key categories of ecosystem services assessed in LUCC studies? Ecosystem services are typically categorized into four main types, as outlined by the Millennium Ecosystem Assessment:
- Provisioning Services: Products obtained from ecosystems, such as food, water, and raw materials [3] [4].
- Regulating Services: Benefits obtained from the regulation of ecosystem processes, such as climate regulation, water purification, and flood control [3] [5].
- Cultural Services: Non-material benefits people obtain from ecosystems, such as aesthetic and recreational experiences [3] [4].
- Supporting Services: Services necessary for the production of all other ecosystem services, such as soil formation and nutrient cycling [3].
In practice, regulating services often account for the greatest share of the total economic value in many landscapes [3].
3. Why is scenario analysis critical in LUCC and ESV research? The future is inherently uncertain, and land use decisions made today have long-lasting consequences. Scenario analysis allows researchers and planners to project LUCC and its impact on ESV under various alternative future pathways. These pathways are often based on different socioeconomic and climate conditions, such as the Shared Socioeconomic Pathways (SSPs) and Representative Concentration Pathways (RCPs) [5]. Common scenarios include:
- Natural Development (ND): Projects future trends based on historical land change patterns [6] [7].
- Rapid Economic Development (RED): Prioritizes urban and agricultural expansion, often at the expense of ecological land [6].
- Ecological Land Protection (ELP): Focuses on the conservation and restoration of forests, grasslands, and wetlands [6].
- Sustainable Development (SD): Aims to balance economic needs with ecological protection [5] [6].
Simulating these scenarios helps identify the ecological risks of different development strategies and supports more sustainable land-use planning [5].
Technical Troubleshooting Guide
Common Experimental Challenges and Solutions
| Challenge | Possible Causes | Solution / Best Practice |
|---|---|---|
| Inaccurate LUCC Projections | Model over-simplification; ignoring policy constraints [6]. | Use coupled models (e.g., SD-PLUS) that integrate socio-economic drivers and spatial policy constraints like "Ecological Red Lines" and "Permanent Basic Cropland" [5] [6]. |
| Low Accuracy in Land Use Data | Reliance on low-resolution or unvalidated remote sensing data [6]. | Utilize fine-scale land survey data where available. For remote sensing data, perform accuracy assessment with ground-truthing; aim for high interpretation accuracy (>90%) [6] [7]. |
| Underestimating ESV | Use of unadjusted, global value coefficients [2] [7]. | Apply locally modified value coefficients for ecosystem services. Refer to and adapt nationally recognized, but locally calibrated, equivalence tables like those developed by Xie et al. [6] [7]. |
| Misinterpreting Ecosystem Service Trade-offs | Considering services in isolation; simple overlay analysis [5] [1]. | Conduct Ecosystem Service Bundle (ESB) analysis to identify sets of services that consistently appear together. This reveals the complex interactions and trade-offs within a landscape [5]. |
| Scale-Related Discrepancies in Results | Conducting analysis at a single, inappropriate scale [8]. | Perform multiscale analyses (e.g., both grid and sub-watershed scales) to ensure findings are robust and to avoid missing or distorting key relationships between drivers and services [8]. |
Essential Experimental Protocols
Protocol 1: Land Use and Land Cover Change Simulation using the PLUS Model
- Objective: To spatially project future land use patterns under different scenarios.
- Workflow: The following diagram illustrates the integrated modeling workflow that couples quantitative demand projection with spatial simulation.
- Key Steps:
- Data Preparation: Collect time-series historical land use maps and raster data for driving factors (distance to roads, slope, population density, etc.).
- Land Expansion Analysis Strategy (LEAS): Use the Random Forest algorithm within the PLUS model to analyze the relationship between historical land use changes and driving factors, extracting the potential for each land type to expand.
- Scenario Definition: Establish spatial constraints and development demands for different scenarios (ND, RED, ELP, SD). For example, in an ELP scenario, restrict development within ecological redlines.
- Patch-generation Simulation: Use the CARS (CA based on Multiple Random Seeds) module to simulate the spatial evolution of land use, integrating the expansion potential, neighborhood effects, and scenario-based constraints.
Protocol 2: Quantifying Ecosystem Service Value with the Benefit Transfer Method
- Objective: To calculate the monetary value of ecosystem services provided by different land cover types.
- Methodology: This approach transfers per-unit-area value coefficients from previously studied sites ("study sites") to the landscape of interest ("policy site") [2].
- Formula:
Total ESV = Σ (VCₖ × Aₖ)Where:VCₖis the value coefficient for land use typek(e.g., USD/ha/year).Aₖis the area of land use typek.
- Key Steps:
- Obtain a Value Coefficient Table: Source a reliable, peer-reviewed table of value coefficients. A widely used foundation for Chinese studies is the equivalent factor table developed by Xie et al., which is often locally adjusted [6] [7].
- Calculate Areas: Use GIS to calculate the area of each land use class from your land use maps for each time point.
- Compute ESV: Multiply the area of each land use type by its corresponding value coefficient and sum all values to get the total ESV.
The Scientist's Toolkit: Key Research Reagents & Materials
Table: Essential Data Inputs for LUCC and ESV Modeling
| Research "Reagent" | Function / Relevance | Key Details / Sources |
|---|---|---|
| Land Use/Cover Maps | The fundamental spatial data representing the ecosystem asset. | Can be derived from remote sensing (Landsat, Sentinel) or, ideally, from official land survey data for higher accuracy [6] [7]. |
| Driving Factor Datasets | Explanatory variables used to model and predict land use change. | Includes topography (DEM, Slope), socioeconomic data (Population Density, GDP), and accessibility (Distance to Roads, Railways) [5] [6]. |
| Value Coefficient Table | The "look-up table" that converts a land cover unit into a monetary ES value. | A pre-defined table assigning value coefficients to different biomes (e.g., forest, wetland, cropland). Must be locally validated [2] [7]. |
| Climate Data | Critical input for modeling specific ecosystem services like water yield. | Includes precipitation, temperature, and potential evapotranspiration data, often obtained from meteorological stations or scientific data centers [5] [8]. |
| Spatial Policy Boundaries | Constraints that ensure simulations reflect real-world land use regulations. | Includes Urban Development Boundaries (UDB), Permanent Basic Cropland (PBC), and Ecological Protection Red Lines (RLE) [6]. |
| Soil Data | Key input for modeling services like soil retention and water purification. | Includes soil depth, texture, and plant-available water content, obtained from soil databases or scientific institutes [8]. |
Frequently Asked Questions (FAQs)
FAQ 1: What is the fundamental connection between land use patterns and ecosystem services?
Land use patterns, which describe the spatial configuration of different land cover types (e.g., forests, croplands, urban areas), directly alter the structure of ecosystems. This change in structure, such as the size, shape, and connectivity of habitat patches, subsequently affects ecological processes and functions. These functions, in turn, underpin the ecosystem services that humans rely on, such as water purification, climate regulation, and food production. Research shows that spatial patterns in land use have a significant interactive relationship with the provision of ecosystem services [9]. For instance, a high degree of landscape fragmentation can disrupt nutrient cycling and reduce habitat quality.
FAQ 2: Which specific landscape metrics are most critical for diagnosing ecosystem service provision?
Several landscape-level metrics are commonly used to quantify spatial patterns and their ecological impacts. The table below summarizes key indices and their implications for ecosystem services, based on empirical research [10].
Table 1: Key Landscape Pattern Indices and Their Ecological Implications
| Landscape Metric | Ecological Significance | Impact on Ecosystem Services |
|---|---|---|
| Largest Patch Index (LPI) | Measures the dominance of the largest patch; indicates habitat integrity. | A larger LPI often has a positive effect on Ecosystem Service Value (ESV), as large, continuous patches support core ecological functions [10]. |
| Contagion Index (CONTAG) | Measures the clumping or dispersion of patch types. | A high CONTAG can have a negative effect on ESV, potentially indicating a loss of landscape diversity which is crucial for multiple services [10]. |
| Patch Density (PD) | Number of patches per unit area; indicates landscape fragmentation. | Higher PD generally correlates with reduced ESV due to increased habitat fragmentation and disruption of ecological flows [10]. |
| Shannon's Diversity Index (SHDI) | Measures landscape diversity based on patch richness and area proportion. | A very high or very low SHDI can indicate trade-offs; diversity can support multiple services but may reduce dominance of key functional habitats [10]. |
FAQ 3: How can researchers model and simulate future land use scenarios to optimize ecosystem services?
Researchers use coupled model frameworks to simulate future land use and its impact on ecosystem services. A standard protocol involves integrating quantitative optimization, spatial simulation, and ecosystem service evaluation [11] [12] [6]. A typical workflow is as follows:
- Quantity Optimization: Use a model like Gray Multi-objective Optimization (GMOP) to determine the optimal quantity of each land use type under different future scenarios (e.g., economic development, ecological protection) while considering constraints like food security and carbon neutrality [6].
- Spatial Allocation: Allocate the optimized land quantities spatially using a model like the Patch-generating Land Use Simulation (PLUS) model. This model uses a random forest algorithm to mine the drivers of land use change and simulates the evolution of land use patterns at the patch level [12] [6].
- Ecosystem Service Assessment: Evaluate the outcomes of the simulated scenarios by estimating the Ecosystem Service Value (ESV) using the equivalence factor method [6] or by modeling specific services (e.g., carbon storage, habitat quality) with tools like the InVEST model [12].
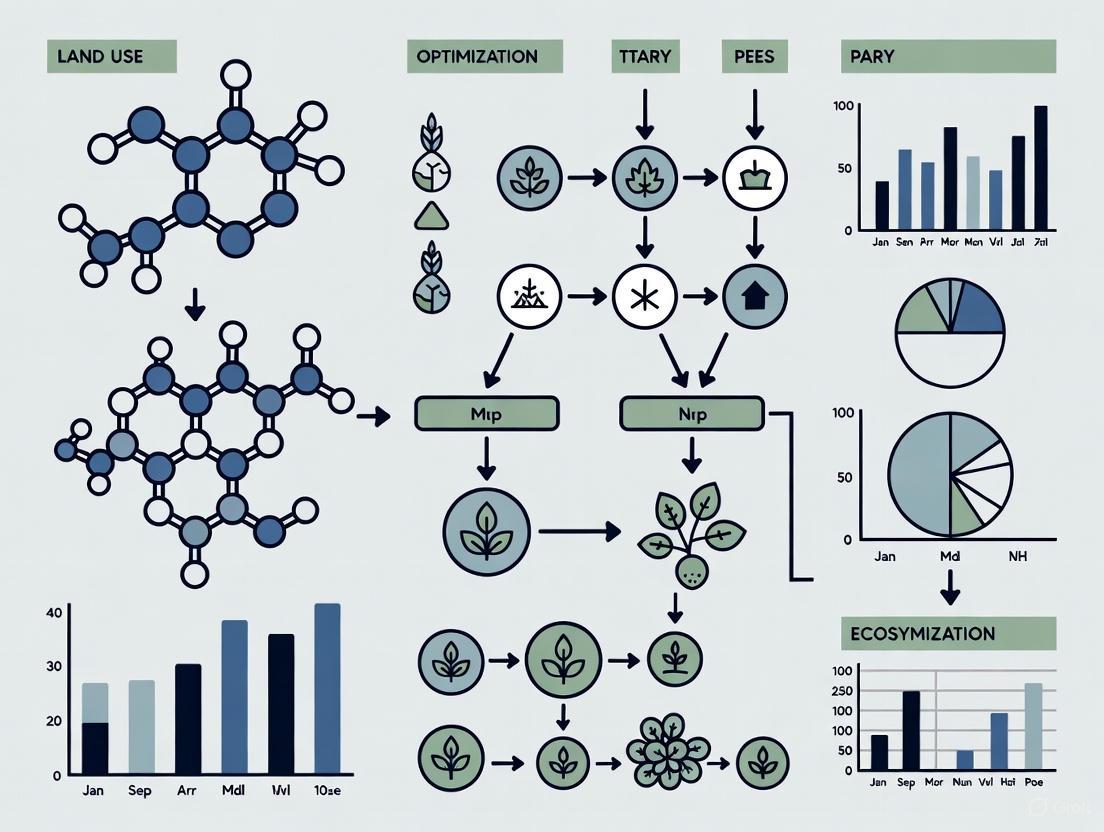
Figure 1: Land use optimization and ES assessment workflow.
FAQ 4: What are common pitfalls when interpreting spatial autocorrelation in land use pattern analysis?
A major pitfall is ignoring the spatial autocorrelation of data, which violates the assumption of independence in classical statistical models. Everything is related to everything else, but near things are more related than distant things. When analyzing the correlation between landscape patterns and ecosystem services, using ordinary linear regression without accounting for this spatial dependency can lead to biased and unreliable results [10]. Instead, researchers should employ spatial regression models, such as spatial autoregression, which explicitly incorporate spatial relationships and provide a more accurate understanding of the influence of land use patterns on ecosystem functions [10].
Troubleshooting Guides
Problem 1: Inaccurate land use simulation results when projecting future scenarios.
- Symptoms: The simulated land use map has a low figure of merit (FoM) when compared to actual historical data. The model fails to realistically represent the expansion or contraction of key land types like forests or urban areas.
- Potential Causes and Solutions:
- Cause: Inadequate incorporation of spatial constraints and land use policies.
- Solution: Integrate authoritative land planning data as hard constraints in the spatial allocation model. This includes layers for Permanent Basic Cropland (PBC), the Boundary for Urban Development (BUD), and the Ecological Protection Redline (RLE) to ensure simulations adhere to real-world regulatory frameworks [6].
- Cause: Poor calibration of the model's driving factors.
- Solution: Use the random forest algorithm in models like PLUS to more accurately mine the contribution of various driving factors (e.g., distance to roads, slope, population density) to each land use type's change, thereby improving the simulation's plausibility [6].
Problem 2: Observed land use change does not lead to the expected change in ecosystem service values.
- Symptoms: For example, an increase in forest cover does not yield a measurable improvement in modeled water purification services, or the overall ESV remains stagnant despite landscape interventions.
- Potential Causes and Solutions:
- Cause: The spatial configuration of new land uses is suboptimal. A large forest patch has a different ecological effect than several small, dispersed patches of the same total area.
- Solution: Focus on cultivating landscape dominance in key ecological areas. Prioritize the formation of large-scale, well-connected ecological agglomerations (a high LPI) in critical source areas and corridors, rather than fragmented plantings, to maximize ecological benefits [10].
- Cause: The ecosystem service valuation method is not sensitive to the specific ecological context.
- Solution: Refine the standard equivalence factor method by applying local biophysical correction factors, such as Net Primary Productivity (NPP) for services like carbon storage, a precipitation regulator for water-related services, and a soil conservation factor for erosion control [10]. This tailors the ESV estimation to local conditions.
The Scientist's Toolkit: Essential Reagents & Models
Table 2: Key Tools and Models for Spatial Pattern and Ecosystem Service Research
| Tool/Model Name | Type | Primary Function in Research |
|---|---|---|
| Fragstats | Software | Calculates a wide battery of landscape pattern metrics (e.g., PD, LPI, CONTAG) from categorical land use/cover maps [10]. |
| InVEST Model | Software Suite | A suite of models developed by Stanford's Natural Capital Project to map and value ecosystem services like carbon storage, habitat quality, and water yield [12]. |
| PLUS Model | Software | A land use simulation model that uses a random forest algorithm and a cellular automaton framework to project future land use changes at a fine, patch-level scale [12] [6]. |
| Gray Multi-objective Optimization (GMOP) | Mathematical Model | Used for optimizing the future quantity structure of land use under multiple objectives (e.g., economic benefit, ecological protection) and constraints [6]. |
| Standard Equivalent Factor | Valuation Method | Represents the economic value of the annual natural food production from 1 ha of average farmland, serving as the baseline for scaling the value of other ecosystem services [10] [6]. |
FAQs: Core Concepts in ESV Assessment
1. What is Ecosystem Service Value (ESV) and why is it important for land use optimization?
Ecosystem Service Value (ESV) is defined as the quantifiable benefit, either monetary or non-monetary, that humans derive from the natural functions and processes of ecosystems [13]. These services include the provision of resources, regulation of environmental factors, support for biological diversity, and cultural benefits. For land use optimization research, ESV provides a crucial metric to translate ecological changes into economic or other quantifiable terms. This allows policymakers and land managers to fully consider ecosystem services when balancing competing land uses and making ecologically sustainable development decisions [6]. By quantifying these benefits, ESV assessment acts as a bridge between natural ecosystem functioning and human well-being, enabling more informed trade-off analyses in spatial planning [6].
2. What are the main methodological approaches for valuing ecosystem services?
The methodologies for ESV valuation can be broadly categorized into two groups [14]:
- Data-Driven Methods: These involve biomass quality assessment using ecological models (e.g., InVEST, ARIES, SWAT) to simulate ecological processes, followed by functional monetary assessment using economic valuation techniques (e.g., market price, replacement cost, contingent valuation). These methods offer strong spatial matching but often require complex calculations and numerous parameters, making them more suitable for single ecosystem studies or small spatial scales [14].
- Value-Driven Methods (Unit Value-Based Methods): These methods, including basic value transfer and expert-modified value transfer, apply pre-defined unit values per hectare to different land use types [14]. Pioneered by Costanza et al. and refined by Xie et al. for China, these methods are advantageous for ESV research at large spatial scales (national or regional) due to their relative simplicity and lower data requirements [15] [14]. A key challenge is ensuring the unit values are appropriately adjusted for local conditions.
3. My research involves rapid urbanization. How can I accurately account for artificial ecosystems like built-up land in my ESV assessment?
Traditional ESV methods often oversimplify ecological reality by focusing on natural ecosystems. For urban studies, a novel Unit Value (UV) method has been developed that integrates equivalent factors for both natural and artificial ecosystems [14]. This includes assigning values to built-up land and man-made wetlands, which are frequently neglected. Furthermore, this method employs a multidimensional spatiotemporal adjustment approach that integrates natural, economic, and spatial characteristics to refine equivalent factors, providing a more accurate assessment for composite urban ecosystems [14]. This approach helps reveal the spatiotemporal evolution of ESV in cities, typically showing declines in central districts and increases in suburban areas [14].
4. I am using land use data to calculate ESV. Why is there a discrepancy between my results and official land management figures, and how can I resolve it?
Discrepancies often arise because many academic studies use land use data obtained from remote sensing image interpretation, which can lack the accuracy required for actual land management [6]. For example, a commonly used 30m land use dataset had an area accuracy of only 69% when compared with actual land survey data in one study [6]. To bridge the gap between academic research and natural resource management:
- Prioritize Land Survey Data: Whenever possible, use authoritative land survey data from government natural resource departments instead of remotely sensed data alone.
- Incorporate Planning Controls: Ensure your optimization constraints fully consider land planning controls, such as Permanent Basic Cropland (PBC), boundaries for urban development (BUD), and the Red Lines for protecting Ecosystems (RLE) [6]. This makes the simulation more policy-relevant.
Troubleshooting Guides
Issue 1: Selecting an Appropriate Valuation Method for Your Study
Problem: A researcher is unsure whether to use a data-driven method or a unit value transfer method for their regional ESV assessment.
Solution: Follow this decision workflow to select the most suitable method.
Methodology Deep Dive:
Implementing the Unit Value Transfer Method: This is a common choice for large-scale studies. The core equation often involves calculating the economic value of ecosystem services per hectare based on the value of grain production [15] [16]:
E_c = 1/7 * ∑(P_i * q_i * M)WhereE_cis the economic value of ESV per hectare,P_iis the average price of crop i,q_iis the yield per unit area of crop i, andMis the cultivated area [16]. This value is then used to calibrate equivalent factors for different land use types (e.g., forest, grassland, wetland) to obtain their specific value coefficients [15].Refining for Urban Areas: When applying unit value methods in cities, ensure you are using a revised equivalent factor table that includes values for built-up land and man-made wetlands to avoid underestimating ESV [14].
Issue 2: Addressing Spatial Heterogeneity and Data Accuracy Problems
Problem: ESV assessment results lack accuracy or do not reflect spatial heterogeneity, leading to potential biases in land use optimization recommendations.
Solution Steps:
- Source High-Accuracy Data: Move beyond basic remote sensing data. If possible, use fine-scale land survey data with higher resolution (e.g., 400 m² to 1500 m² minimum patch size) to align with actual land management practices [6].
- Apply Spatial Adjustment Factors: Incorporate adjustment factors to account for regional variations. Common adjustors include:
- Conduct Spatial Analysis: Use Exploratory Spatial Data Analysis (ESDA) and Geographically Weighted Regression (GWR) in GIS software to explore spatial clustering (e.g., identifying "hot-spots" and "cold-spots" of ESV) and to understand how driving factors vary across space [16]. This reveals patterns that aggregate values might conceal, such as the stable spatial distribution of high ESV in upper river basins and low ESV in lower basins [15].
Issue 3: Integrating ESV with Land Use Optimization Models
Problem: A researcher wants to project future ESV under different land use scenarios to inform sustainable planning.
Solution Protocol: Couple ESV estimation with land use simulation models.
Detailed Workflow:
- Quantitative Optimization: Use a Gray Multi-objective Optimization (GMOP) model to optimize the quantity structure of future land use under different scenarios (e.g., Natural Development, Ecological Protection, Sustainable Development). This model considers the uncertainty of future land use and utilizes multiple constraints [6].
- Spatial Simulation: Feed the GMOP results into a spatial simulation model like the Patch-generating Land Use Simulation (PLUS) model. The PLUS model uses a random forest algorithm to mine the drivers of land use change and can simulate land use change at the patch level with high accuracy [6].
- ESV Estimation and Comparison: Calculate the total ESV for the simulated land use maps of each scenario using your chosen valuation method. Compare the ESV outcomes to assess which land use optimization pathway delivers the best ecological-economic benefits [6].
Essential Research Reagent Solutions
Table: Key "Reagents" for ESV and Land Use Optimization Experiments
| Research Reagent | Function/Explanation | Example Application Context |
|---|---|---|
| Equivalent Factor Table | A matrix assigning relative value coefficients to different ecosystem types (e.g., forest, cropland, wetland) for various services [15] [14]. | Core to the unit value transfer method; must be locally calibrated for accuracy [15]. |
| Land Use/Land Cover (LULC) Data | The foundational spatial dataset depicting the physical coverage of the earth's surface. | Input for calculating ESV and simulating land use change; accuracy is critical [6]. |
| Spatial Constraints (RLE, PBC, BUD) | Geospatial boundaries from territorial spatial plans that restrict land conversion [6]. | Incorporated into land use models (e.g., PLUS) to ensure simulations are policy-compliant and realistic [6]. |
| InVEST Model Suite | A family of open-source, data-driven software models for mapping and valuing ecosystem services [14]. | Used for detailed, process-based valuation of specific services (e.g., carbon storage, water purification) at a local to regional scale. |
| PLUS (Patch-generating LUS) Model | A cellular automata model for land use simulation that uses random forest to mine change drivers and simulates patch-level changes [6]. | Coupled with GMOP for spatial optimization of future land use scenarios under various development pathways [6]. |
| Geographically Weighted Regression (GWR) | A spatial analysis technique that models relationships between variables that vary across space [16]. | Used to identify and map the spatially varying driving forces behind ESV changes, such as economic or tourism factors [16]. |
Frequently Asked Questions (FAQs)
FAQ 1: How does the PLES framework conceptually align with established ecosystem services classification systems like the NESCS Plus?
The PLES framework aligns closely with the concept of Final Ecosystem Services (FES). The National Ecosystem Services Classification System Plus (NESCS Plus) makes a critical distinction between intermediate and final ecosystem services to avoid double-counting in environmental accounting [17].
- Intermediate Ecosystem Services are internal ecological processes (e.g., plant transpiration, nutrient cycling) that support the system but do not directly benefit people [17].
- Final Ecosystem Services (FES) are the components of nature that flow directly to and are directly used or appreciated by people, such as water in a stream used for kayaking or a forest providing recreational space [17].
Within the PLES framework, the Ecological Space generates a suite of potential FES. The Living Space (residential areas) and Production Space (agricultural, industrial areas) are where these FES are directly consumed or used by human beneficiaries. This clear linkage helps in mapping the supply of services from ecological areas to the demand in human-dominated areas [17] [18].
FAQ 2: What is a common challenge in defining and quantifying ecosystem services within a PLES analysis, and how can it be addressed?
A primary challenge is the lack of a consistent operational definition for what constitutes an ecosystem service. Research has identified multiple conceptual definitions in use, leading to potential inconsistency. Some studies define ecosystem services as the benefits themselves, while others define them as the ecosystem functions or processes that lead to benefits, or the things people value [19].
To address this, your PLES research should:
- Explicitly state your chosen definition early in your methodology, aligning it with your research goals (e.g., using the FES definition from NESCS Plus for economic accounting) [17] [19].
- Use structured classification systems like NESCS Plus to ensure a comprehensive and non-duplicative list of services is considered [18].
- Apply the FEGS Scoping Tool, a decision-support tool mentioned by the EPA, to help identify and prioritize the environmental attributes most relevant to your specific PLES study area and stakeholders [17].
FAQ 3: What quantitative metrics can be used to monitor and evaluate ecosystem services in a PLES study?
Selecting the right metrics is crucial for quantifying changes in ecosystem services resulting from PLES optimization. The "FEGS Metrics Report" provides guidance on integrating metrics into environmental assessments. The table below summarizes potential metric categories and examples for different PLES functions [17].
Table 1: Example Metrics for Ecosystem Services in PLES Analysis
| PLES Function | Ecosystem Service Category | Example Quantitative Metrics |
|---|---|---|
| Ecological Space | Water Purification | • Concentration of pollutants (e.g., nitrates, phosphates) in water bodies• Turbidity levels (NTU) |
| Ecological Space | Climate Regulation | • Carbon sequestration rate (tons of C/ha/year)• Local temperature modulation (°C difference from non-vegetated area) |
| Production Space | Crop Production | • Crop yield (tons/ha)• Pollinator abundance and diversity indices |
| Living Space | Recreation & Cultural Benefits | • Number of visitor days to parks per year• Measured noise reduction (decibels) from green buffers |
Technical Troubleshooting Guides
This section provides structured methodologies for diagnosing and resolving common issues in PLES research, adapting a proven technical troubleshooting framework [20].
Problem: Inconsistent or Unreliable Quantification of Ecosystem Service Flows
This issue arises when measurements of a service (e.g., water yield, recreation visits) are highly variable or do not accurately reflect the theoretical model.
Step 1: Identify the Problem Gather all available data and clearly define the inconsistency. Example: "Modeled water yield from Ecological Space is 30% higher than empirically measured runoff at the catchment outlet." Question stakeholders and identify all symptoms [20].
Step 2: Establish a Theory of Probable Cause Research and question the obvious. Potential causes to investigate [20]:
- Data Quality: Are the input data (e.g., soil type maps, land cover classification, rainfall data) accurate and at the correct spatial resolution?
- Model Limitations: Does the ecological production function (model) account for all relevant intermediate services? For example, does your water yield model include evapotranspiration from invasive species? [17]
- Spatial Mismatch: Is there a disconnect between the scale of measurement and the scale of the service flow? The service might be generated in one location but used in another.
Step 3: Test the Theory to Determine the Cause
- Validate Input Data: Ground-truth land cover classifications and check rain gauge calibration.
- Review Model Parameters: Compare your model's structure and parameters against those in repositories like the EcoService Models Library (ESML) [17].
- Analyze the Causal Chain: Trace the chain of intermediate services. For instance, if measuring air purification, ensure you account for both pollutant capture (intermediate) and the resulting change in air quality inhaled by a nearby community (final) [17].
Step 4: Establish a Plan of Action and Implement the Solution Based on your findings, the plan may be:
- Data Correction: Acquire higher-resolution remote sensing data.
- Model Refinement: Incorporate a new parameter (e.g., soil infiltration rate) into your ecological production function.
- Metric Adjustment: Change the proxy metric used for valuation (e.g., use avoided health costs instead of pollutant capture mass).
Step 5: Verify Full System Functionality and Implement Preventive Measures Re-run the analysis with the corrected data or refined model. Compare the outputs to independent validation data. To prevent recurrence, document the data sources and model thresholds that were found to be reliable [20].
Step 6: Document Findings, Actions, and Outcomes Maintain a detailed log of the problem, all tested theories, the final solution, and the validation results. This documentation is critical for future research and for communicating the robustness of your study [20].
The following diagram visualizes this structured troubleshooting workflow:
The Scientist's Toolkit: Essential Research Reagents & Materials
Successful application of the PLES framework relies on a combination of conceptual frameworks, data sources, and analytical tools.
Table 2: Key Research Reagent Solutions for PLES Analysis
| Tool / "Reagent" | Function in PLES Analysis |
|---|---|
| NESCS Plus Framework | Provides a standardized classification system for Final Ecosystem Services (FES), ensuring a comprehensive and non-duplicative accounting of services across Production, Living, and Ecological Spaces [17] [18]. |
| FEGS Scoping Tool | A decision-support tool used to identify and prioritize which stakeholders, beneficiaries, and environmental attributes are most relevant to a specific land management decision, framing the research questions [17]. |
| EcoService Models Library (ESML) | An online database of ecological models that can be used to quantify ecosystem goods and services (e.g., predicting water runoff, carbon storage) [17]. |
| EnviroAtlas | An interactive web-based tool providing geospatial data, maps, and other information related to ecosystem services, useful for mapping PLES distributions and service supply [17] [18]. |
| GIS & Remote Sensing Software | The primary platform for delineating PLES boundaries, analyzing spatial patterns, and modeling the flows of ecosystem services across a landscape. |
| Structured Troubleshooting Methodology | A logical framework for diagnosing and resolving issues in experimental design, data inconsistency, and model inaccuracy, ensuring research rigor [20]. |
Frequently Asked Questions (FAQs)
FAQ 1: What are the most common trade-offs observed between economic development and ecosystem services in land use optimization?
Research consistently shows that scenarios prioritizing rapid economic development (RED) often lead to the expansion of construction land, which encroaches upon ecological lands like grasslands and croplains [6]. For example, in the Dongting Lake Eco-Economic Zone, an optimization model had to balance higher economic benefits (15622.72×10⁸ to 19150.50×10⁸ CNY) against the preservation of ecosystem service functions [11]. The most affected ecosystem services are typically carbon storage and habitat quality, while food production might be maintained or even intensified in specific zones [12] [6].
FAQ 2: How can ecological security patterns (ESPs) be effectively integrated into land use planning?
Ecological Security Patterns (ESPs) serve as spatial frameworks to guide ecological conservation. They are typically composed of ecological sources (core habitats) and ecological corridors (connecting pathways) [12]. To integrate them:
- Use models like InVEST and Morphological Spatial Pattern Analysis (MSPA) to identify high-value ecological sources based on key ecosystem services (e.g., carbon storage, habitat quality) [12].
- Extract and map ecological corridors using a Minimum Cumulative Resistance (MCR) model to ensure landscape connectivity [12].
- Embed these identified ESPs as "ecological redline" constraints in land use simulation models (e.g., the PLUS model) to restrict development in these critical areas in future scenarios [12].
FAQ 3: What is the difference between the PLUS model and other land use simulation models?
The PLUS (Patch-generating Land Use Simulation) model has distinct advantages for certain types of analysis. Unlike the CLUE-S model, whose assumptions about causality are not always fully justified, the PLUS model is based on a random forest algorithm to mine the drivers of land use change [6]. Furthermore, it incorporates an adaptive inertia competition mechanism and a threshold-decreasing mechanism to simulate land use change at the patch level, which allows it to generate more realistic, fine-scale spatial patterns compared to some traditional cellular automata models [6].
FAQ 4: My study uses land use data from remote sensing. How does this impact the relevance of my findings for actual land management policy?
While remote sensing data is invaluable for broad-scale academic research, a significant gap can exist between these datasets and the fine-scale data used in land management. One analysis found that the accuracy of a commonly used 30m land use dataset was only 69% when compared to official land survey data [6]. Land management decisions are often based on fine-scale land survey data (with minimum mapping units as small as 400 m²) and are bound by specific policy controls like Permanent Basic Cropland (PBC) and Boundaries for Urban Development (BUD) [6]. For research to directly inform policy, it is crucial to use the highest-resolution data available and explicitly incorporate these planning control boundaries as constraints in optimization models [6].
Troubleshooting Guides
Issue 1: Media Fill Failures in Sterility Testing
- Problem: Multiple, unexplained media fill failures during process simulation, with contaminants not recoverable via conventional microbiological techniques.
- Investigation & Resolution:
- Source Identification: An investigation successfully identified the contaminant as Acholeplasma laidlawii using 16S rRNA gene sequencing. The source was traced to a lot of non-sterile Tryptic Soy Broth (TSB) powder [21].
- Cause: Acholeplasma laidlawii is a mollicute without a cell wall, with individual organisms as small as 0.2-0.3 microns. This allows it to penetrate a standard 0.2-micron sterilizing filter [21].
- Corrective Actions:
- Short-term: Filter prepared TSB through a 0.1-micron filter for media fills [21].
- Long-term: Switch to sterile, irradiated TSB from a commercial supplier when available [21].
- Validation: Revalidate cleaning procedures to verify the removal of the organism and implement ongoing monitoring for Mycoplasma [21].
Issue 2: Handling High In-Process Material Reject Rates
- Problem: Manufacturing processes, such as those for transdermal patches, have inherently higher in-process material reject rates than other pharmaceutical processes [21].
- Assessment:
- Distinguish between normal, consistent waste and atypical, excessive waste. Normal waste may be due to cumulative effects of roll splicing, line start-ups/stoppages, and roll-stock changes [21].
- A validated and well-controlled process should achieve fairly consistent waste amounts batch-to-batch [21].
- Investigation: Waste in excess of normal operating rates requires an evaluation to determine the root cause (e.g., increased sampling, higher component defects, or poorly developed processes) and assess the consequences on product quality [21].
- Documentation: All investigations and yield calculations must be documented according to CGMP regulations (e.g., 21 CFR 211.103, 211.192) [21].
Issue 3: Inconsistent or Sub-Optimal Land Use Simulation Results
- Problem: Model outputs do not align with observed land use changes or fail to achieve a balance between ecological and economic objectives.
- Checklist for Refinement:
- Constraint Review: Ensure spatial constraints reflect real-world land planning controls. Many studies fail to properly include Permanent Basic Cropland (PBC), Urban Development Boundaries (BUD), and Ecological Redlines, leading to unrealistic simulations [6].
- Data Quality: Verify the accuracy and resolution of input land use data. Using coarse or unvalidated remote sensing data can disconnect results from management reality [6].
- Scenario Definition: Develop distinct, policy-relevant scenarios (e.g., Natural Development, Ecological-Priority, Sustainable Development) with clear quantitative targets for ecosystem services and economic output [11] [12] [6].
- Model Coupling: Consider coupling a quantitative optimization model (e.g., Gray Multi-objective Optimization - GMOP) with a spatial simulation model (e.g., PLUS) to achieve both optimal land use allocation and realistic spatial distribution [6].
The following tables consolidate key quantitative findings from recent land use optimization studies, providing a reference for expected outcomes and model performance.
Table 1: Land Use and Economic Outcomes from the Dongting Lake Eco-Economic Zone Optimization [11]
| Metric | Optimized Value / Range | Context |
|---|---|---|
| Economic Benefit | 15,622.72 × 10⁸ to 19,150.50 × 10⁸ CNY | Projected economic output for the optimized region in 2030. |
| Farmland Area | 25,686.99 to 25,932.61 km² | |
| Woodland Area | 22,093.37 to 22,295.23 km² | Optimized areas for different land use types in 2030. |
| Grassland Area | 837.11 to 841.41 km² | |
| Water Area | 7,536.86 to 7,767.01 km² | |
| Construction Land | 2,660.92 to 2,987.49 km² | |
| Unutilized Land | 1,090.72 to 1,116.36 km² |
Table 2: Ecosystem Service Trade-offs in the Liaohe River Basin under Different Scenarios [12]
| Scenario | Key Finding | Implication |
|---|---|---|
| Economic-Priority (PUD) | Highest net forest loss. | Maximizes economic development at the expense of ecological integrity. |
| Ecological-Priority (PEP) | Reduced net forest loss by 63.2% compared to PUD. | Significantly enhances ecological spatial integrity and service provision. |
| Spatial Distribution | Total Ecosystem Service (TES) showed a gradient of high values in east/west and low values in the central basin. | Informs targeted spatial governance and restoration efforts. |
Table 3: Land Use and ESV Changes in Ningxia (2000-2020) and Projections to 2030 [6]
| Land Use Category | Historical Change (2000-2020) | Projected Trend under ND Scenario to 2030 |
|---|---|---|
| Construction Land | ↑ Increased by 97.96% | ↑ Continues to expand, encroaching on other types. |
| Grassland | ↓ Decreased | ↓ Main land outflow category due to lack of strict use control. |
| Unused Land | ↓ Decreased | ↓ Main land outflow category. |
| Total ESV | ↑ Increased steadily and slightly | ↑ Continues slight increase. |
Experimental Protocol: A Framework for Land Use Optimization
This protocol outlines the integrated methodology for simulating and optimizing land use based on ecosystem services, as used in recent studies [11] [12] [6].
1. Define Study Area and Objectives
- Select a region (e.g., a river basin or administrative area) and define the planning horizon (e.g., to 2030).
- Establish clear objectives, such as maximizing economic benefits while maintaining a minimum level of ecosystem services, or achieving ecological redline protection targets.
2. Data Collection and Preprocessing
- Gather historical and current spatial data. Key datasets include:
- Land Use/Land Cover (LULC): Multiple time points (e.g., 2000, 2010, 2020) from satellite imagery or land surveys [12] [6].
- Driving Factors: Topography, climate, soil, infrastructure, and socioeconomic data [12].
- Planning Constraints: Boundaries for permanent basic cropland, urban development, and ecological protection redlines [6].
- Preprocess all data to a uniform spatial resolution and coordinate system.
3. Ecosystem Service (ES) Assessment
- Select key ES for evaluation (e.g., carbon storage, habitat quality, soil retention, water yield).
- Use models like the InVEST suite to quantify the spatiotemporal supply of these services [11] [12].
- Analyze trade-offs and synergies between ES using methods like correlation analysis or geographically weighted regression [12].
4. Construct Ecological Security Patterns (ESP)
- Identify ecological sources as core areas of high ES value using hotspot analysis or the MSPA method [12].
- Create a resistance surface based on land use type and other factors.
- Extract ecological corridors and nodes using the MCR model to link sources and create a connected network [12].
- Delineate hierarchical ESPs (e.g., core, buffer, and restoration zones) to serve as spatial constraints.
5. Develop and Simulate Land Use Scenarios
- Define distinct future scenarios (e.g., Natural Development, Ecological-Priority, Sustainable Development).
- Quantity Optimization: Use a model like GMOP to calculate the optimal area for each land use type in the target year under each scenario, considering socio-economic and ecological constraints [6].
- Spatial Allocation: Use the optimized quantities as input for a spatial model like PLUS. The PLUS model will leverage its land expansion analysis strategy (LEAS) and a cellular automata (CA) model based on multi-class random seeds to allocate the land use patches spatially, respecting the ESP and other planning constraints [11] [6].
6. Validation and Evaluation
- Validate the model's accuracy by simulating a historical year and comparing the output to the actual map using metrics like the Figure of Merit (FoM) [6].
- Estimate the Ecosystem Service Value (ESV) for the optimized 2030 land use patterns using a modified equivalent factor method to compare the outcomes of different scenarios [6].
The workflow for this integrated methodology is visualized below.
Workflow for Land Use Optimization
The Scientist's Toolkit: Essential Models and Data for Land Use Optimization
Table 4: Key Research Reagents and Tools for Land Use Optimization Experiments
| Tool / Model Name | Type | Primary Function | Key Feature |
|---|---|---|---|
| InVEST | Software Suite | Evaluates and maps multiple ecosystem services (e.g., carbon storage, water yield). | Spatially explicit outputs; integrates with GIS; modular by service [11] [12]. |
| PLUS Model | Spatial Simulation | Simulates future land use change at the patch level under various scenarios. | Uses a land expansion analysis strategy (LEAS) and a CA model with multi-class random seeds [11] [6]. |
| GMOP | Quantitative Model | Solves for the optimal quantity structure of land use under multiple objectives. | Handles uncertainty with interval programming; incorporates diverse constraints [6]. |
| MCR Model | Spatial Analysis | Identifies least-cost paths for species movement or ecological flows. | Used to map ecological corridors and define ecological networks [12]. |
| Fine-Scale Land Survey Data | Dataset | Provides the ground-truthed basis for land use classification. | High accuracy and resolution; essential for policy-relevant research [6]. |
From Theory to Practice: Integrated Modeling Frameworks for Spatial Optimization
Frequently Asked Questions (FAQs)
Model Installation and Setup
Q: I encounter a "ModuleNotFoundError: No module named 'PySide'" error when starting InVEST. How can I resolve this?
A: This error indicates a compatibility issue with the Qt binding libraries. Try these solutions:
- Set the environment variable
QT_APIwith the valuepyside2[22]. - If the above doesn't work, set the
FORCE_QT_APIenvironment variable to1[22]. - As a confirmed working solution, download and install a development build of InVEST that contains a specific fix for this issue [22].
Q: What are the basic steps to get started with the InVEST model?
A: Follow this quick start tutorial [23]:
- Install InVEST Workbench: Download the installer for your Windows or Mac system and follow the setup steps.
- Review the User Guide: Read the specific model chapter to understand data requirements and background.
- Examine Sample Data: Use the provided sample data to understand input formats and test runs.
- Prepare Your Data: Gather and process your own spatial and non-spatial data for your area of interest.
Model Coupling and Workflow
Q: What is the core research purpose of coupling the PLUS and InVEST models?
A: The integration aims to dynamically assess the impact of future land use change on ecosystem services. The PLUS model simulates future land use scenarios, and these outputs are used as inputs for the InVEST model to quantify changes in ecosystem services like carbon storage, water yield, and habitat quality [24] [25]. This coupling allows researchers to analyze the potential outcomes of different policy interventions.
Q: How does the GMOP model integrate with the PLUS-InVEST framework?
A: The Gray Multi-Objective Optimization (GMOP) model is used for land use quantity structure optimization. It defines the optimal amount of each land use type for future scenarios based on multiple objectives and constraints. The PLUS model then uses these optimized land use quantities to spatially allocate the land use patterns, which are subsequently evaluated for their ecosystem service value (ESV) using the InVEST model or equivalent factor methods [6]. This creates a full workflow from target setting to spatial simulation and final assessment.
Data and Scenario Design
Q: What are typical future scenarios modeled in land use optimization studies?
A: Researchers often design multiple scenarios to explore different developmental pathways. Common scenarios include [24] [25] [6]:
- Natural Development Scenario (NDS): Projects future land use based on historical trends.
- Ecological Protection Scenario (EPS): Prioritizes the protection and expansion of ecological lands like forests and grasslands.
- Urban Development Scenario (UDS): Simulates rapid urban and economic expansion.
- Sustainable Development Scenario (SDS): Aims to balance economic needs with ecological protection and food security.
Troubleshooting Guides
InVEST Model Fails to Launch
| Symptom | Possible Cause | Solution Steps | Reference |
|---|---|---|---|
Error on startup: ModuleNotFoundError: No module named ‘PySide’ |
Conflict or missing Qt binding libraries. | 1. Check and set the QT_API environment variable to pyside2 [22].2. Set the FORCE_QT_API environment variable to 1 [22].3. Install a fixed development build of InVEST [22]. |
[22] |
Inaccurate or Unexpected Land Use Simulation Results in PLUS
| Symptom | Possible Cause | Solution Steps | Reference |
|---|---|---|---|
| Simulated land use changes do not align with real-world patterns or expectations. | 1. Insufficient or poor-quality driver data.2. Incorrectly set neighborhood weight parameters.3. Lack of necessary spatial constraints. | 1. Validate Driver Factors: Ensure the selected drivers (e.g., slope, population, distance to roads) effectively explain land use changes in your study area [24].2. Calibrate Parameters: Adjust the neighborhood weights to reflect the relative likelihood of each land type to expand [24].3. Incorporate Spatial Policies: Use spatial planning boundaries like Permanent Basic Cropland and Urban Development Boundaries as constraints in the simulation [6]. | [24] [6] |
Discrepancies Between Ecosystem Service Assessments and Observed Data
| Symptom | Possible Cause | Solution Steps | Reference |
|---|---|---|---|
| Modeled outputs (e.g., carbon storage, water yield) are abnormally high/low or don't match local measurements. | 1. Uncalibrated model parameters.2. Use of unvalidated land use data.3. Incorrect biophysical table values. | 1. Model Calibration: Collect observed data and adjust sensitive model parameters to improve agreement between modeled results and real-world measurements [23].2. Use Authoritative Data: Whenever possible, use high-resolution land survey data instead of remotely-sensed interpreted data to improve accuracy [6].3. Verify Input Parameters: Conduct a literature search for localized parameter values (e.g., carbon pools for specific forest types) [23]. | [23] [6] |
Experimental Protocols and Workflows
Detailed Methodology for a Coupled PLUS-InVEST-GMOP Analysis
The following workflow is synthesized from applications in Yunnan Province and the Chengdu Urban Agglomeration [24] [25] [6].
1. Data Collection and Preprocessing
- Land Use Data: Obtain historical land use data (e.g., from 2000 and 2020) from authoritative sources like the Resource Environment Science and Data Center or, ideally, from detailed land survey data [24] [6].
- Driver Variables: Collect spatial data for drivers of land use change. These typically include:
- Ecosystem Service Modeling Data: Prepare specific inputs for InVEST models, such as carbon pool tables for the Carbon Storage model, or biophysical tables for habitat quality assessment [25].
2. Land Use Scenario Optimization and Simulation
- Step 1: Quantity Structure Optimization with GMOP
- Define objective functions (e.g., maximize economic output, maximize ecosystem service value) and constraints (e.g., total area, food security needs) [6].
- Use the GMOP model to solve for the optimal area of each land use type for your target year under different scenarios (e.g., Natural Development, Ecological Protection) [6].
- Step 2: Spatial Pattern Simulation with PLUS
- Land Expansion Analysis Strategy (LEAS): Use the PLUS model to analyze the drivers of land use change from your historical data and extract development potentials for each land type [24] [26].
- Cellular Automata Simulation: Feed the optimized land use quantities from GMOP and the development potentials into the PLUS model. Use a multi-class random patch seeds (CARS) mechanism to generate spatially explicit land use maps for the future under each scenario [6].
- Model Validation: Simulate a past year (e.g., 2020) using data from an earlier period (e.g., 2000). Compare the simulation to the actual land use map using metrics like Overall Accuracy and Kappa coefficient to validate the model's performance [24].
3. Ecosystem Service Assessment and Trade-off Analysis
- Step 1: Run InVEST Models
- Step 2: Calculate Ecosystem Service Value (ESV)
- Using a modified equivalent factor method, assign value coefficients to each land use type. Multiply the area of each land type by its value coefficient to compute the total ESV for each scenario [6].
- Step 3: Analyze Trade-offs and Synergies
- Compare the results of different ecosystem services across the various scenarios. Identify where services have a trade-off (one increases while another decreases) or a synergy (both increase or decrease together) [1] [6].
- Use spatial statistics (e.g., Moran's I) to identify hotspots of ecosystem service change and aggregation [6].
Workflow for a Coupled PLUS-InVEST-GMOP Analysis
The Scientist's Toolkit: Key Research Reagents and Data Solutions
The following table details essential data inputs and their functions for conducting research with the coupled PLUS-InVEST-GMOP framework.
| Item Category | Specific Item / Reagent | Function / Purpose in the Experiment | Example Source |
|---|---|---|---|
| Core Spatial Data | Historical Land Use/Land Cover (LULC) Maps | Serves as the baseline for model calibration (PLUS) and for assessing historical ecosystem services (InVEST). | Resource Environment Science and Data Center [24]; High-resolution Land Survey Data [6] |
| Driver Variables | DEM (Digital Elevation Model), Slope, Soil Type, Precipitation, Temperature, Distance to Roads/Rails/Water, Population Density, GDP Grid | Used in the PLUS model to analyze the factors driving land use change and to simulate future spatial patterns. | Resource Environment Data Center [24] |
| Spatial Constraints | Ecological Protection Red Line (RLE), Permanent Basic Cropland (PBC), Urban Development Boundary (UDB) | Acts as spatial constraints in the PLUS simulation to ensure results adhere to land use planning and policy controls. | Territorial Spatial Plan (TSP) [6] |
| Model Parameters | Carbon Pool Tables (for InVEST Carbon Model), Biophysical Tables (for InVEST Habitat Quality Model) | Provides the per-hectare carbon storage values for different land use types and the sensitivity of habitats to threats, essential for quantifying ecosystem services. | Literature review and local studies [25] [23] |
| Scenario Parameters | Socioeconomic Pathway Data (SSP-RCP scenarios), Land Use Demand Projections | Informs the GMOP model's objective functions and constraints for generating future land use quantity structures under different scenarios. | CMIP6 Climate Projections [24]; Regional Development Plans [6] |
Troubleshooting Common Experimental Issues
FAQ 1: My optimization algorithm converges to solutions that heavily favor one objective, like economic output, at the expense of others like ecological value. How can I achieve better balance?
Answer: This common issue, known as objective domination, often stems from mismatched scales between objective functions or inadequate exploration of the Pareto front.
Solution A: Implement Objective Normalization
- Procedure: Scale all objective functions to a similar range, typically [0, 1], using the ideal and nadir points. The normalized value for objective (i) is calculated as: ( fi^{normalized} = \frac{fi - zi^{ideal}}{zi^{nadir} - z_i^{ideal}} )
- Example: In a land use study, if economic benefit ranges from 1-100 billion CNY and habitat quality index ranges from 0.1-0.9, both can be normalized to [0,1] for balanced optimization [11].
Solution B: Utilize Reference-Based Algorithms
FAQ 2: How do I quantitatively evaluate and validate the trade-offs between economic and ecological outcomes in my results?
Answer: Validating trade-offs requires both statistical and visual analysis of the Pareto front.
- Procedure:
- Calculate the Hypervolume Indicator: This measures the volume of objective space dominated by your solutions, bounded by a reference point. An increasing hypervolume indicates improving solution quality [28].
- Perform Trade-off Analysis: For solutions on the Pareto front, calculate the trade-off between any two objectives. For example, "a 1% increase in economic benefit requires a X% decrease in habitat quality." This quantifies the marginal rate of substitution [12].
- Employ Sensitivity Analysis: Use methods like the Geographical Detector (GeoDetector) to quantify how sensitive your ecosystem service outcomes are to changes in land use type (q-value). A higher q-value indicates a greater explanatory power of that land use change on the resulting ecosystem service [29].
FAQ 3: My land use optimization model produces spatially fragmented or impractical land allocation patterns. How can I improve spatial coherence?
Answer: This occurs when optimization models lack spatial constraints.
- Solution: Integrate Spatial Configuration Models
- Procedure: Couple your optimization model with a spatial land use model like the Patch-based Land Use Simulation (PLUS) model.
- First, run a non-spatial optimization to determine the optimal quantity of each land use type.
- Then, use the PLUS model to allocate these quantities spatially based on transition probabilities, neighborhood interactions, and development barriers. This ensures the optimized land use structure is allocated in a spatially realistic pattern [11] [12].
- Application: A study in the Dongting Lake Eco-Economic Zone used this coupled approach to optimize land use while maintaining spatial integrity, successfully balancing economic benefits between [15622.72, 19150.50] × 10^8 CNY with enhanced ecosystem services [11].
- Procedure: Couple your optimization model with a spatial land use model like the Patch-based Land Use Simulation (PLUS) model.
FAQ 4: How can I account for future uncertainties, like climate change or economic shifts, in my long-term land use optimization models?
Answer: Use multi-scenario simulation frameworks.
- Procedure:
- Define Scenarios: Develop distinct future scenarios (e.g., Economic-Priority, Ecological-Priority, Balanced Development).
- Embed Ecological Security Patterns (ESPs): Construct ESPs comprising ecological "sources" (core patches) and "corridors" (linking pathways). Embed these ESPs as inviolable "redline" constraints in your land use simulations for the ecological-priority scenario [12].
- Simulate and Compare: Run the PLUS or equivalent model for each scenario and compare outcomes.
- Example Finding: Research in the Liaohe River Basin showed that an Ecological-Priority scenario (PEP) reduced net forest loss by 63.2% compared to an Economic-Priority scenario (PUD), significantly enhancing ecological connectivity [12].
Experimental Protocols & Methodologies
Protocol 1: Multi-Objective Optimization of Land Use Structure
Purpose: To determine the optimal allocation of land use types that maximizes both economic benefits and ecosystem service value (ESV).
Workflow Overview:
Detailed Steps:
Data Collection & Preparation:
- Input Data: Gather spatial data: historical land use/cover maps, Digital Elevation Model (DEM), soil type, precipitation, socio-economic data (GDP, population density) [12] [29].
- Preprocessing: Resample all datasets to a uniform spatial resolution (e.g., 250m) and project to a consistent coordinate system.
Ecosystem Service Assessment:
Define the Multi-Objective Optimization Model:
- Objective Functions:
- Maximize Economic Benefit: Total economic output from different land use types.
- Maximize Total Ecosystem Service Value (ESV): Use value coefficients from modified equivalence factor tables (e.g., Xie et al.'s method) [29].
- Constraints: Include total land area, food security (minimum farmland), environmental protection (maximum pollution), and technological limitations [11].
- Objective Functions:
Model Solving with MOO Algorithms:
Output Analysis & Validation:
- Pareto Front Analysis: Obtain and visualize the set of non-dominated solutions.
- Trade-off Calculation: Use the improved cross-sensitivity analysis to evaluate how transformations between Production-Ecological (P-E) land and other types impact ESV [29].
Protocol 2: Constructing Ecological Security Patterns for Spatial Optimization
Purpose: To identify and map critical ecological areas that must be protected as spatial constraints in land use planning.
Workflow Overview:
Detailed Steps:
Identify Ecosystem Service Bundles:
- Method: Use self-organizing maps (SOM) or K-means clustering on the ES metrics from Step 2 of Protocol 1.
- Output: Regions with similar ES characteristics (e.g., "Comprehensive Service Function Zone," "Agricultural Development Zone") [12].
Delineate Ecological Sources:
- Tool: Use Morphological Spatial Pattern Analysis (MSPA) on core habitat patches (e.g., large forest areas) to identify core, bridge, and branch structures. The most critical core areas become "ecological sources" [12].
Create a Resistance Surface:
- Method: Assign a cost value to each land use type based on its permeability to species movement (e.g., low resistance for forests, high resistance for construction land).
- Refinement: Modify the resistance surface using factors like slope and human disturbance intensity.
Extract Ecological Corridors and Nodes:
- Tool: Use the Minimum Cumulative Resistance (MCR) model to identify the least-cost paths for species movement between ecological sources. These paths are ecological corridors [12].
Construct the Final ESP:
- Output: The ESP consists of the ecological sources (core areas), corridors (linkages), and strategic points (nodes). This network is then used as a no-go or high-restriction zone in land use simulation scenarios [12].
The Scientist's Toolkit: Essential Research Reagents & Solutions
Table 1: Key Models and Algorithms for Multi-Objective Land Use Optimization.
| Tool Name | Type/Category | Primary Function | Application Context |
|---|---|---|---|
| InVEST Model | Ecosystem Service Evaluation | Quantifies and maps multiple ecosystem services (carbon, water, habitat). | Baseline assessment of ecological conditions; calculating ecological objectives [11] [12]. |
| NSGA-III | Evolutionary Algorithm | Solves many-objective (>3) problems using reference directions. | Finding a diverse Pareto front in complex optimizations [27] [28]. |
| PLUS Model | Land Use Simulation Model | Simulates the spatial dynamics of land use changes. | Allocating optimized land quantities into realistic spatial patterns [11] [12]. |
| MCR Model | Spatial Analysis | Calculates least-cost paths across a resistance landscape. | Identifying ecological corridors for ESP construction [12]. |
| Geographical Detector | Statistical Analysis | Quantifies the driving forces behind spatial patterns. | Identifying key factors (e.g., population density) influencing ESV [29]. |
Data Presentation: Comparative Results
Table 2: Exemplary Optimization Outcomes from Case Studies.
| Case Study Region | Optimization Model | Economic Outcome | Ecological Outcome | Key Trade-off Insight |
|---|---|---|---|---|
| Dongting Lake Eco-Economic Zone [11] | Interval Uncertainty Optimization + PLUS | Economic benefits: [15622.72, 19150.50] × 10^8 CNY | Enhanced ecosystem service function & value; reduced pollutant emission. | Achieved higher economic benefits than status quo while improving ecological performance. |
| Liaohe River Basin [12] | ESP-constrained PLUS Simulation (PEP Scenario) | Not specified (Ecological-priority) | 63.2% reduction in net forest loss compared to economic-priority scenario. | Demonstrates the potential of ESPs to effectively curb ecological degradation. |
| Anning River Basin [29] | PLES Transformation Analysis | -- | ESV dropped by 326 M yuan overall (1985-2023), with E-P land declining 766 M yuan. | Ecosystem services are most sensitive to conversions of Ecological-Production (E-P) land. |
| Smart Grid System [30] | NSGA-III | Lowest electricity cost: 62 cents. | Implicit emission reduction. | NSGA-III outperformed ADE and SPEA in cost minimization for energy scheduling. |
Frequently Asked Questions (FAQs)
1. What is a patch-generating model, and how does it differ from traditional Cellular Automata (CA) models? Patch-generating land use simulation models, such as the PLUS model, are advanced spatial simulation frameworks that combine a rule-mining framework with a cellular automata model to simulate the evolution of multiple land use types simultaneously. Unlike traditional CA models, which often struggle with simulating realistic spatial structures and the patch-level dynamics of natural land use types (e.g., forests, grassland), patch-generating models explicitly simulate the growth and competition of discrete land use patches. This allows them to generate more realistic and ecologically meaningful landscape patterns, which is crucial for assessing ecosystem services [31] [32].
2. Why is the PLUS model particularly suited for research on ecosystem services? The PLUS model is highly suited for ecosystem services research because it not only projects future land use patterns but also provides a quantitative understanding of the drivers behind land use change for individual land types. By integrating with ecosystem service assessment models like the InVEST (Integrated Valuation of Ecosystem Services and Tradeoffs) model, researchers can simulate how different land use scenarios (e.g., economic development vs. ecological protection) will impact services such as carbon storage, habitat quality, and water yield. This integrated approach is vital for informing sustainable land use planning that balances multiple objectives [33] [32].
3. My simulated land use patterns appear overly fragmented. How can I improve patch compactness? Fragmented patterns often arise from cell-level transition rules that do not consider patch-level characteristics. To improve compactness:
- Utilize the Patch-Level Operations within models like PSOLA, which include a patch-compactness operator that constrains the shape of generated land use patches during the allocation process [34].
- In the PLUS model, leverage the CARS (CA based on multi-type random patch seeds) module. This module incorporates a threshold-decreasing mechanism to simulate the spontaneous generation of patches of various land use types, which helps create more aggregated and compact patches compared to standard cellular automata approaches [31].
- Ensure your neighborhood weight parameters are appropriately configured to encourage spatial clustering of similar land use types.
4. How do I handle the competition between different land use types, such as urban expansion versus forest conservation? The PLUS model handles inter-type competition through its Land Expansion Analysis Strategy (LEAS) and the CARS module. The LEAS uses a random forest algorithm to mine the contributions of various driving factors to the expansion of each land use type. Then, during simulation, the CARS module calculates a comprehensive probability for each land use type to occupy a cell based on these expansion probabilities, neighborhood effects, and pre-set conversion costs. You can directly influence this competition by:
- Adjusting the conversion cost matrix to make certain transitions (e.g., forest to urban) more difficult.
- Developing different scenarios (e.g., Economic Development, Ecological Protection) that modify the total demand for each land use type and the weights of relevant driving factors [35] [32].
5. What are the essential data inputs and software required to start with a model like PLUS? The core requirements for applying the PLUS model are summarized in the table below.
Table 1: Essential Research Reagents & Data for Patch-Generating Land Use Modeling
| Item Name | Function / Description | Essentiality |
|---|---|---|
| Historical Land Use Maps | Raster maps from at least two different dates for model calibration and rule extraction. | Mandatory |
| Driving Factor Variables | Raster layers of variables like elevation, slope, distance to roads/waterways, population density, and nighttime light data. | Mandatory |
| PLUS Model Software | The official software package, available on GitHub, provides a user-friendly interface for running simulations [36]. | Mandatory |
| Suitability Rasters / Constraints | Maps defining areas where land use change is restricted (e.g., protected areas, water bodies). | Highly Recommended |
| Future Land Demand Data | The total area required for each land use type in the target year, often derived from planning documents or Markov Chain analysis [37]. | Highly Recommended |
| GIS Software (e.g., ArcGIS) | For pre-processing input data, map creation, and post-simulation analysis of results. | Highly Recommended |
Troubleshooting Common Experimental Issues
Issue 1: Poor Model Accuracy and Low Kappa Coefficient after Calibration
Problem: The simulated land use map does not match the actual validation map well.
Solution:
- Verify Input Data Quality: Ensure your historical land use maps are accurately classified and consistent in their classification system across different years. Even minor misclassifications can significantly impact rule mining.
- Re-evaluate Driving Factors: Not all factors are equally important. Use the random forest algorithm within the PLUS model's LEAS module to calculate the Contributions of Driving Factors (see Table 2). Remove factors with very low contribution rates, as they may be introducing noise [31].
- Adjust Sampling Rate: The default random sampling rate for the LEAS module can be increased from the standard 5% to a higher value (e.g., 10-20%) to provide the random forest classifier with more data for learning transition rules, potentially improving accuracy [31].
- Calibrate Neighborhood Parameters: The size and influence (weight) of the neighborhood for each land use type are critical. Experiment with different neighborhood configurations (e.g., 5x5 vs. 7x7) and adjust the weights based on the observed spatial clustering of each land use type in your study area.
Issue 2: Inability to Replicate Observed Patch Size Distributions
Problem: The simulated patches are either too large or too small compared to real-world patterns.
Solution:
- Utilize Patch-Level Seeds: The PLUS model's CARS module uses multi-type random patch seeds. If patch sizes are incorrect, check the parameters related to patch generation, such as the seed threshold.
- Incorporate Patch-Level Metrics: Use external landscape metrics software (e.g., FRAGSTATS) to quantify the patch size distribution of your actual landscape. Use this as a target during model calibration. Models like PSOLA explicitly use patch-size operators to constrain the size of allocated land use patches, a concept you can emulate by adjusting parameters that control patch nucleation and expansion [34].
Issue 3: Unrealistic Land Use Change in Ecologically Sensitive Areas
Problem: The model simulates urban or agricultural expansion into protected zones, wetlands, or steep slopes.
Solution:
- Implement a Land Use Policy Mask: Create a Boolean constraint raster where ecologically sensitive areas are marked as "off-limits" for conversion to specific land use types. Most models, including PLUS, allow you to input such masks to prohibit changes in defined areas [34] [35].
- Re-calibrate Driving Factors: Ensure that driving factors like "distance to protected area" or "slope" are included and have a high contribution weight in the rule-mining phase for the land use types you wish to protect. This will naturally reduce the probability of expansion in these zones.
Experimental Protocols & Data Presentation
Protocol: Calibrating the PLUS Model for Scenario-Based Projections
This protocol outlines the steps to calibrate the PLUS model using historical data, a prerequisite for running credible future simulations [31] [32].
- Data Preparation: Collect and preprocess at least two historical land use maps (e.g., from 2010 and 2020) and a suite of driving factor rasters. All rasters must be aligned to the same extent, resolution, and coordinate system.
- Land Expansion Analysis (LEAS):
- Input the earlier and later land use maps to generate a map of land use expansions.
- Input the expansion map and all driving factor rasters into the LEAS module.
- Set a sampling rate (start with 5%) and run the random forest algorithm to obtain the development probability for each land use type and the contribution of each driving factor.
- Model Calibration & Validation:
- In the PLUS main module, input the earlier land use map (2010) and set the model to simulate the later date (2020).
- Input the development probabilities and land use demand (calculated from the 2020 map).
- Set parameters for the CARS module (neighborhood weight, patch generation parameters).
- Run the simulation and compare the output to the actual 2020 map using the built-in accuracy assessment tools (e.g., Kappa, FoM).
- Iteratively adjust parameters until validation metrics are satisfactory.
- Future Scenario Simulation:
- Once calibrated, use the most recent land use map as the base.
- Define future land demand for your scenarios (e.g., Sustainable, Economic Development) using Markov chains or planning documents [37].
- Run the PLUS model with the calibrated rules and scenario-specific demands to generate future land use maps.
Table 2: Example Quantitative Data from a PLUS Model Application in Wuhan, China [31]
| Driving Factor | Contribution to Built-up Expansion (%) | Contribution to Forest Expansion (%) |
|---|---|---|
| Distance to Roads | 25.5% | 2.1% |
| Population Density | 18.7% | 0.5% |
| Elevation | 3.2% | 30.8% |
| Slope | 4.1% | 25.3% |
| Distance to Water | 8.9% | 5.7% |
Table 3: Impact of Different Scenarios on Ecosystem Carbon Storage (Nanjing Metropolitan Circle) [32]
| Development Scenario | Projected Change in Carbon Storage by 2030 (Terragrams, Tg) | Key Land Use Change Trend |
|---|---|---|
| Ecological Protection (EP) | + 0.50 Tg | Expansion of forested areas; strict control of urban sprawl. |
| Natural Development (ND) | - 1.74 Tg | Continuation of historical trends. |
| Collaborative Development (CD) | - 0.48 Tg | Balanced approach between development and conservation. |
| Economic Development (ED) | - 3.56 Tg | Significant conversion of natural land to urban/industrial uses. |
Workflow Visualization
Frequently Asked Questions (FAQs)
Q1: What is scenario planning and why is it used in ecosystem services research? Scenario planning is a structured process that allows researchers and resource managers to prepare for a range of plausible future conditions rather than relying on a single prediction. It is used to assess how climate, oceans, resource conditions, and human activities may change, and to explore management options that promote adaptation and resilience in the face of uncertainty [38]. It helps in examining established practices and fostering creative thinking for sustainable ecosystem management [39] [38].
Q2: My scenario simulations yield unexpected or illogical land-use changes. What could be wrong? This is often due to improperly defined transition rules or missing spatial constraints. Ensure you have correctly calibrated your land-use model (e.g., the PLUS model) using historical data. Crucially, verify that you have embedded your Ecological Security Patterns (ESPs) as "redline" constraints to prevent ecological sources and corridors from being converted to other land types [12]. Also, check that the probabilities of transition between different land-use types are based on a robust analysis of historical drivers.
Q3: How can I effectively engage stakeholders in the scenario development process? Stakeholder engagement is a key component of successful scenario planning [39]. While workshops are a common method, a detailed digital questionnaire can be a time- and cost-effective alternative to workshops for eliciting input from expert stakeholders. This method can help in defining the focal issue, identifying key uncertainties, and creating plausible and relevant scenarios [40]. Ensure you involve a diverse group of stakeholders to define the problem holistically [39].
Q4: What is the difference between an "Ecological-Priority" and an "Economic-Priority" scenario? These are two common, contrasting scenario archetypes [39] [12]. An Ecological-Priority scenario prioritizes the enhancement of ecosystem services by enforcing strict ecological redlines, leading to reduced forest loss and enhanced spatial integrity. In contrast, an Economic-Priority scenario prioritizes economic development and urban expansion, often resulting in higher conversion of natural habitats and a greater decline in regulating services like carbon storage and habitat quality [12].
Q5: How many scenarios should I develop, and how do I choose? The appropriate number of scenarios is generally considered to be three or four [39]. Two scenarios may not sufficiently expand thinking, while more than four can confuse users. The selected scenarios should be:
- Plausible: Based on the best available science.
- Relevant: Directly focused on the core management question.
- Divergent: Characterizing a wide range of future conditions.
- Challenging: Effective for testing established assumptions [38].
Troubleshooting Guides
Issue: Poorly Defined Focal Issue
- Problem: The scenario planning exercise lacks direction and fails to address a specific management concern.
- Solution:
- Identification: Clearly articulate the specific problem (e.g., "improving coastal resilience" or "maintaining a functional forest landscape") [39].
- Assessment: Conduct a formal assessment using expert knowledge, literature reviews, or integrated models to identify which uncertainties will most impact the focal issue [39].
- Stakeholder Input: Use questionnaires, focus groups, or interviews with a diverse group of stakeholders to ensure the problem is defined broadly and holistically [39] [40].
Issue: Inability to Quantify Ecosystem Services for Scenarios
- Problem: Lack of data or methodology to model ecosystem service outcomes under different future land-use scenarios.
- Solution: Employ established modeling suites like the InVEST (Integrated Valuation of Ecosystem Services and Tradeoffs) model [12] [40]. This tool requires land cover data layers for different scenarios and can quantify services such as:
- Carbon storage
- Habitat quality
- Water yield
- Soil retention
- Food production [12]
- Protocol: Use the InVEST model documentation to prepare input rasters (e.g., land use/cover, biophysical tables). Calibrate the model with local data where available to run simulations for each scenario and compare outputs.
Issue: Scenarios Feel Implausible or Lack Credibility
- Problem: Developed scenarios are dismissed by decision-makers as being unrealistic.
- Solution:
- Consistency Testing: Test scenarios for logical consistency. This can be done qualitatively through stakeholder workshops and expert opinion, or quantitatively by integrating scenarios with computational models to simulate dynamics [39].
- Validate with Science: Ensure scenarios are grounded in the best available science, such as data from Climate Vulnerability Assessments or Ecosystem Assessment Reports [38].
- Create Narratives: Turn quantitative scenarios into compelling narratives or storylines that describe the sequence of events from the present to a hypothetical future, making them more relatable and understandable [39].
Experimental Protocols for Key Analyses
Protocol 1: Developing and Structuring Scenarios This protocol outlines the core steps for creating scenarios for ecosystem management [39] [38].
- Establish Scope: Define the focal issue, spatial scale (e.g., a river basin), and time horizon (e.g., 2030).
- Discover Drivers: Identify key social, economic, and environmental drivers of change. Analyze their uncertainty and potential impact.
- Create Scenarios: Select 3-4 critical, uncertain drivers to form the axes of your scenario framework. Develop a narrative for each quadrant, describing the future world.
- Quantify Land Use: Translate narrative scenarios into quantitative land-use maps using a model like PLUS, with transition rules based on driver combinations.
- Validate: Review scenarios with experts and stakeholders to check plausibility and relevance.
Protocol 2: Constructing an Ecological Security Pattern (ESP) This protocol details the method for identifying key ecological areas to be used as constraints in land-use simulations [12].
- Identify Ecological Sources: Use the InVEST model's habitat quality module to assess ecosystem service capacity. Areas with high, contiguous service values (e.g., high carbon storage and habitat quality) can be identified as ecological "sources."
- Build a Resistance Surface: Create a raster where each land-use type is assigned a resistance value based on its permeability to species movement (e.g., forest has low resistance, urban areas have high resistance).
- Extract Corridors: Use the Minimum Cumulative Resistance (MCR) model to identify potential ecological corridors between the sources.
- Define the ESP: Combine ecological sources and corridors to form a comprehensive ESP, which serves as a spatial constraint in scenario simulations to prevent ecological fragmentation.
Data Presentation
Table 1: Comparison of Scenario Outcomes for Key Ecosystem Services This table compares the projected outcomes of four common scenario archetypes on various ecosystem services, based on model simulations [12].
| Ecosystem Service | Natural Development | Ecological Priority | Economic Priority | Sustainable Pathway |
|---|---|---|---|---|
| Carbon Storage (tons/ha) | Moderate decrease | Highest increase | Largest decrease | Moderate increase |
| Habitat Quality (Index) | Decreased connectivity | Enhanced integrity | Severe fragmentation | Improved connectivity |
| Water Yield (mm) | Increased variability | Stabilized yield | Highly variable | Moderated yield |
| Soil Retention (tons/ha) | Increased erosion | Significantly reduced erosion | Highest erosion | Reduced erosion |
| Food Production | Moderate increase | Slight decrease | Highest short-term increase | Sustainable increase |
Table 2: Essential Research Reagent Solutions for Land-Use Simulation This table lists key data and tools required for conducting scenario-based land-use optimization studies [12].
| Research Reagent | Type | Function in Analysis |
|---|---|---|
| Time-Series Land Use/Land Cover (LULC) Data | Spatial Data | Serves as the base map for analyzing historical change, calibrating models, and validating future projections. |
| Digital Elevation Model (DEM) | Spatial Data | Provides topographic information crucial for modeling hydrological services (e.g., water yield, soil erosion). |
| Meteorological Data (Precipitation, Temperature) | Tabular/Spatial Data | Key input for modeling climate-sensitive ecosystem services like water yield and habitat suitability. |
| Soil Type and Properties Data | Spatial Data | Essential for calculating soil retention capacity and nutrient retention in models like InVEST. |
| InVEST Model Suite | Software | A primary tool for quantifying and mapping the supply of multiple ecosystem services under different scenarios. |
| PLUS Model | Software | A land-use simulation model used to project future land-use patterns based on scenario-driven development demands. |
Workflow Visualization
Scenario-Based Planning Workflow
Ecological Security Pattern Construction
Core Conceptual FAQs
Q1: What is the primary goal of land use optimization in the Dongting Lake Eco-Economic Zone? The primary goal is to achieve coordinated development of regional ecological benefits and socio-economic benefits by using coupled simulation-optimization models. This involves maximizing the net benefit of the land use system while considering ecosystem service function constraints, environmental protection constraints, economic constraints, social constraints, and technical constraints [11] [41] [42].
Q2: What are the key ecosystem services (ES) considered in this optimization? Key ecosystem services assessed include crop production (CP), carbon sequestration (CS), habitat quality (HQ), and forest recreation (RS) [43]. Other studies also evaluate water production, water conservation, soil and water conservation, and carbon storage [11]. The main ecosystem service value (ESV) functions are water containment, waste treatment, soil formation and protection, biodiversity conservation, and climate regulation [44] [45].
Q3: What are the main trade-offs observed between these ecosystem services? The strongest trade-off is observed between crop production and habitat quality, with trade-off areas averaging 57.8%. Trade-offs also exist between crop production and forest recreation, and between carbon sequestration and habitat quality [43].
Q4: What are the most important drivers of ecosystem service values in this region? Driving factors, in descending order of importance, are: human impact index, total primary productivity (GPP), slope, elevation, population, temperature, gross domestic product, precipitation, and PM2.5 [44] [45].
Technical Methodology & Model Troubleshooting
Q1: What integrated modeling framework is used for land use optimization? The coupled model integrates three core components:
- Ecosystem service assessment model (InVEST) for quantifying ecosystem services [11] [41] [42]
- Interval uncertainty optimization model for handling system uncertainties [11] [41] [42]
- Spatial layout model of land use (PLUS) for simulating future land use patterns [11] [41] [42]
Q2: How do I address uncertainty in land use optimization modeling? The Interval Uncertainty Optimization Model is specifically designed to handle the inherent uncertainties of the land use system. It provides results as ranges rather than single values (e.g., economic benefits between [15622.72×10⁸, 19150.50×10⁸] CNY) [11] [41] [42].
Q3: My PLUS model isn't capturing fine-scale land use changes. What should I check? Ensure you're utilizing the PLUS model's full capabilities:
- Use the random forest algorithm to calculate land use development potential [46]
- Apply multi-type random patch seeds (CARS) to model multiple land-use type changes [46]
- Validate simulation results using confusion matrix and kappa coefficient [46]
Land Use Optimization Workflow
Data Analysis & Interpretation Troubleshooting
Q1: How are ecosystem service values (ESVs) calculated from land use data? ESVs are typically calculated using the coefficient method with land use/cover data, where different land use types are assigned specific value coefficients based on their ecosystem service contributions [44] [45]. The formula is:
Q2: I'm getting conflicting results in ecosystem service trade-off analysis. What might be wrong? This is common because:
- Trade-offs and synergies between ES are complex and non-linear [43]
- Use partial least squares-structural equation modeling (PLS-SEM) to explain driving mechanisms [43]
- Consider that socio-economic factors adversely impact most ecosystem services directly but may contribute to crop production and carbon sequestration through suppression effects [43]
Q3: My driving factor analysis isn't capturing non-linear relationships. What advanced methods are available? Instead of linear methods, use:
- XGBoost model (eXtreme Gradient Boosting) to quantify importance of single driving factors [44] [45]
- SHAP (SHapley Additive exPlanation) values to study synergistic effects between different drivers [44] [45]
- This approach captures the non-linear and complex synergistic relationships between ESVs and driving factors [44] [45]
Expected Results & Validation
Table 1: Optimized Land Use Areas for Dongting Lake Eco-Economic Zone (2030)
| Land Use Type | Optimized Area Range (km²) |
|---|---|
| Farmland | [25686.99, 25932.61] |
| Woodland | [22093.37, 22295.23] |
| Grassland | [837.11, 841.41] |
| Water Area | [7536.86, 7767.01] |
| Construction Land | [2660.92, 2987.49] |
| Unutilized Land | [1090.72, 1116.36] |
Table 2: Key Ecosystem Service Trade-offs in Dongting Lake
| Ecosystem Service Pair | Relationship Type | Strength/Notes |
|---|---|---|
| Crop Production vs Habitat Quality | Trade-off | Strongest (57.8% trade-off area) |
| Crop Production vs Forest Recreation | Trade-off | Deteriorating state |
| Carbon Sequestration vs Habitat Quality | Trade-off | Deteriorating state |
| Crop Production vs Carbon Sequestration | Synergy | Relatively stable |
Source: [43]
Ecosystem Service Value Drivers
The Scientist's Toolkit: Research Reagent Solutions
Table 3: Essential Research Tools and Models for Land Use Optimization
| Tool/Model | Primary Function | Application Context |
|---|---|---|
| InVEST Model | Ecosystem service assessment and valuation | Quantifies and maps ecosystem services (water yield, carbon storage, habitat quality) [11] [41] [42] |
| PLUS Model | Patch-generating Land Use Simulation | Simulates future land use patterns at fine spatial scales using random forest and CARS algorithm [11] [46] |
| XGBoost Model | Machine learning for driver analysis | Quantifies importance of individual driving factors and their synergistic effects on ESVs [44] [45] |
| PLS-SEM (Partial Least Squares Structural Equation Modeling) | Analysis of complex cause-effect relationships | Explains driving mechanisms of ecosystem service trade-offs and synergies [43] |
| Interval Uncertainty Optimization | Handling system uncertainties in land use planning | Provides optimized results as value ranges to account for inherent system uncertainties [11] [41] [42] |
| SHAP (SHapley Additive exPlanation) | Interpretable machine learning | Explains how different driving factors synergistically impact ESVs [44] [45] |
Implementation & Scaling Challenges
Q1: How can optimization results be implemented in actual land use planning? The coupled model provides spatially allocated optimization results that give decision-makers a new perspective and tool for developing sustainable regional land use planning. The results show that land use optimization can improve regional economic benefits, reduce pollutant emissions, and enhance ecosystem service functions and values simultaneously [11] [41] [42].
Q2: What is the significance of the "human impact index" as the primary driver? The human impact index emerged as the most important driver of ESVs, indicating that anthropogenic activities have the strongest influence on ecosystem services in the region. This highlights the need for managing human disturbance levels to maintain ecosystem functionality [44] [45].
Q3: How does gross primary productivity (GPP) interact with human impact? When GPP is low (GPP < 900), the SHAP value of the high human impact index is greater than zero, indicating that increasing GPP can enhance ESVs in the Dongting Lake even in areas with significant human impact [44] [45]. This suggests targeted interventions for improving vegetation productivity.
Navigating Complexities: Managing Trade-offs and Enhancing Model Performance
Frequently Asked Questions (FAQs)
FAQ 1: What is the fundamental cause of the trade-off between carbon sequestration and water yield? The trade-off arises because ecological processes that enhance carbon storage often simultaneously increase water consumption. Specifically, vegetation growth, particularly in forests established through afforestation or reforestation, sequesters atmospheric carbon dioxide, building plant biomass (a carbon sink). However, this growing vegetation also transpires large volumes of water and can intercept rainfall, processes that reduce the amount of water available as yield in streams and rivers. This creates a "win-lose" scenario where enhancing one service (carbon storage) leads to a decline in another (water yield) [47] [48].
FAQ 2: Under what conditions might a synergy between carbon and water occur? While a trade-off is common, synergies can be achieved under specific conditions. Improved soil conservation practices can enhance both carbon storage in soils and water infiltration, potentially increasing base flows. Furthermore, restoring native, well-adapted vegetation communities in degraded landscapes can improve soil organic matter (carbon) and soil structure, which improves water retention and regulation, benefiting both services. The relationship is highly dependent on local climate, soil conditions, and vegetation structure [49].
FAQ 3: How does vegetation type influence the carbon-water trade-off? Different vegetation types have distinct water-use efficiencies (WUE), which critically impact the trade-off. Studies show that afforestation with certain tree species in water-limited environments can result in the highest carbon sequestration rates but is also associated with the lowest water yield and WUE. In contrast, natural revegetation patterns may lead to lower carbon sequestration but result in significantly higher water yield and more efficient water use per unit of carbon gained [47]. Therefore, species selection is a key management lever.
FAQ 4: Why is spatial scale important in analyzing these trade-offs? Trade-offs and synergies are scale-dependent. A relationship observed at a local watershed scale (e.g., a trade-off between carbon and water) may not hold, or may be significantly weaker, at a regional or national scale. Furthermore, the drivers of these relationships, such as climate, topography, and land use, exhibit significant spatial heterogeneity. Traditional global statistical models can mask these local variations, making spatially explicit analysis essential for accurate assessment and targeted management [50] [49].
FAQ 5: How can land use optimization help resolve this dilemma? Land use optimization models can be used to design landscape configurations that specifically aim to reduce the spatial mismatch between ecosystem service supply and demand. By treating the mitigation of trade-offs (e.g., minimizing the carbon-water conflict) as explicit objectives in a multi-objective optimization algorithm, these models can generate land-use scenarios that provide a more balanced provision of multiple ecosystem services, moving towards a "win-win" outcome [51].
Troubleshooting Common Experimental Challenges
Issue 1: Inaccurate Quantification of Trade-off Strength
- Problem: The calculated correlation between carbon storage and water yield is weak or nonsensical.
- Solutions:
- Verify Model Parameterization: Ensure that biophysical models (e.g., InVEST) are calibrated with local data. For carbon models, use field-measured carbon density values for different land use types instead of default literature values. For water yield, use local rainfall and soil data [48].
- Check for Non-Linearity: Do not assume a linear relationship. Use methods like the constraint line method to identify and quantify complex, non-linear (e.g., hump-shaped) relationships between services, which correlation coefficients alone might miss [49].
- Account for Spatial Non-Stationarity: Employ local regression models like Geographically Weighted Regression (GWR). This helps reveal how the relationship between carbon and water varies across a landscape, which global models (e.g., ordinary least squares) obscure [50].
Issue 2: Model Outputs Fail to Inform Management Decisions
- Problem: Your assessment maps trade-offs but provides no clear pathway for management interventions.
- Solutions:
- Implement Spatial Zoning: Develop a spatial management zoning framework. Classify your study area into distinct zones based on similar ES trade-off characteristics and supply-demand risk levels. This allows for the design of targeted management strategies for each specific zone [52].
- Incorporate Stakeholder Perspectives: Use methods like the Analytic Hierarchy Process (AHP) to assign weights to different ecosystem services based on the preferences of various stakeholders (e.g., farmers, conservationists, policymakers). This ensures that optimization scenarios are socially relevant and more likely to be implemented [53].
- Develop and Compare Scenarios: Move beyond describing the current state. Use land use simulation models (e.g., PLUS, FLUS) coupled with optimization algorithms (e.g., GMOP) to project land use and ES changes under different future scenarios, such as Natural Development, Rapid Economic Development, or Sustainable Development [6] [54]. This provides decision-makers with clear choices.
Issue 3: Ignoring the Supply-Demand Mismatch
- Problem: The analysis focuses only on the biophysical supply of services, neglecting whether that supply meets societal demand.
- Solutions:
- Quantify Spatial Demand: Map the demand for services like water yield and heat mitigation. Demand can be represented by population density, areas of flood risk, or urban heat islands [51].
- Conduct a Mismatch Analysis: Identify areas of ES supply shortfall (high demand, low supply) and ES surplus (low demand, high supply). This mismatch analysis pinpoints critical areas where management intervention is most needed to enhance human well-being [51].
- Optimize for Mismatch Reduction: Use the identified mismatches as direct objectives in land use optimization models to reconfigure landscapes to better align supply with demand [51].
Key Experimental Protocols & Data
Protocol 1: Field-Based Measurement of Carbon Stocks
This protocol is essential for gathering ground-truth data to calibrate and validate model-based carbon storage estimates [48].
- Stratified Sampling Design: Divide the study area into strata based on dominant land-use/cover types (e.g., Robinia pseudoacacia forest, Pinus tabuliformis forest, cropland, grassland).
- Plot Establishment: Establish sample plots within each stratum.
- Forest Plots: Use a standard 20 m x 20 m plot.
- Shrubland Plots: Use a 3 m x 3 m plot.
- Grassland/Herbaceous Plots: Use a 1 m x 1 m plot.
- Biomass and Carbon Measurement:
- Trees: Record species, Diameter at Breast Height (DBH), and tree height. Calculate above-ground biomass using species-specific allometric equations.
- Shrubs and Herbs: Destructively sample by clipping above-ground parts and excavating roots from a defined volume of soil.
- Litter and Soil Carbon: Collect surface litter from subplots (e.g., 50 cm x 50 cm). Collect soil cores at depth intervals (e.g., 0-10, 10-20, 20-40 cm) for bulk density and organic carbon analysis.
- Carbon Conversion: Convert dry biomass to carbon mass using standard conversion factors (e.g., 0.50 for wood and litter, 0.45 for herbaceous plants) [48].
Protocol 2: Quantifying Trade-offs and Synergies Using Statistical and Spatial Analysis
This protocol provides a workflow for analyzing the relationships between ecosystem services.
- ES Quantification: Use models like InVEST to generate spatial maps of key ES (e.g., Carbon Storage, Water Yield, Soil Retention) for your study area and time periods.
- Sampling: Use a systematic or random sampling grid to extract paired values for the ES of interest (e.g., carbon storage and water yield value for each pixel).
- Global Correlation Analysis: Calculate Spearman's rank correlation coefficient to determine the overall strength and direction (trade-off or synergy) of the relationship across the entire study area.
- Spatially Explicit Trade-off Mapping: To visualize the spatial intensity of the trade-off, calculate the root mean square error (RMSE) between normalized ES values for each pixel. This converts the deviation from an ideal co-benefit state into a mappable trade-off index [55].
- Identify Driving Factors: Use a geographical detector model or GWR to quantify the explanatory power of potential drivers (e.g., land use type, slope, rainfall, vegetation structure) on the observed trade-offs and synergies [50] [49].
Quantitative Data from Key Studies
Table 1: Documented Trade-offs Between Carbon Sequestration and Water Yield
| Study Location | Land Use / Scenario | Carbon Sequestration | Water Yield (Runoff Coefficient) | Water-Use Efficiency | Citation |
|---|---|---|---|---|---|
| Arnás Catchment, Spain | Afforestation | 112 g C·m⁻²·yr⁻¹ | 26% | 1.4 g C·mm⁻¹ | [47] |
| Arnás Catchment, Spain | Natural Revegetation | -27 g C·m⁻²·yr⁻¹ | 50% | 1.7 g C·mm⁻¹ | [47] |
| Caijiachuan Watershed, China | Grain for Green Program | Steady Increase (2002-2024) | Upward trend with high spatial heterogeneity | A consistent significant trade-off (R² ≈ 0.28) | [48] |
Table 2: Key Research Reagents and Solutions for ES Trade-off Analysis
| Item Category | Specific Tool/Model | Primary Function in Analysis | Key Consideration |
|---|---|---|---|
| Biophysical Model | InVEST (Integrated Valuation of ES & Tradeoffs) | Spatially explicit modeling of multiple ES (carbon, water, soil, habitat). | Requires local parameterization for accuracy; modular structure. |
| Land Use Simulation | PLUS (Patch-generating LUS) / FLUS (Future LUS) | Simulates future land use scenarios under different policies. | Uses a random forest algorithm to mine change drivers. |
| Optimization Algorithm | GMOP (Grey Multi-Objective Optimization) / CoMOLA | Optimizes land use quantity structure to meet multiple ES objectives. | Solves objective problems under multiple constraints. |
| Statistical Software | R Language | Performs correlation analysis, regression, and complex statistical testing. | Essential for calculating trade-offs/synergies and driver analysis. |
| Spatial Analysis Tool | Geographical Detector | Identifies driving factors and their interactions on ES spatial patterns. | Quantifies the explanatory power (q-statistic) of each driver. |
Workflow and Relationship Diagrams
Diagram 1: Ecosystem Service Trade-off Analysis Workflow
Diagram 2: The Carbon-Water Trade-off Mechanism
FAQ: Managing Uncertainty in Land Use Optimization Models
Q1: What are the main methodological approaches for handling deep uncertainty in land use planning, and how do they complement each other?
A: The two primary approaches are Robust Decision-Making (RDM) and Dynamic Adaptive Policy Pathways (DAPP), which offer complementary strengths for dealing with deep uncertainty in land use systems [56].
- Robust Decision-Making (RDM): This approach features a clear analytical process that helps identify the conditions under which a land use plan might fail and makes trade-offs between different objectives more transparent. Its main limitation is that the analytical process can be path-dependent and open-ended, requiring many choices from the analyst without providing direct guidance for them [56].
- Dynamic Adaptive Policy Pathways (DAPP): This framework emphasizes dynamic adaptation over time, offering a natural way to handle the vulnerabilities identified through RDM. It is particularly useful for designing plans that can be adjusted as conditions change [56].
For optimal results, these methods can be integrated. RDM can be used to identify critical vulnerabilities in a land use plan, and DAPP can then be employed to design adaptive pathways to manage those vulnerabilities over time.
A: You can perform a sensitivity analysis using tools like the Assess Sensitivity to Attribute Uncertainty tool in ArcGIS. This tool evaluates how your results change when accounting for the uncertainty in your input data [57] [58].
Experimental Protocol:
- Input: Use the output features from your original spatial analysis (e.g., from Hot Spot Analysis or Generalized Linear Regression).
- Define Uncertainty: Specify the uncertainty in your analysis variables. This can be done in three ways:
- Margin of Error: Provide a field from your data that contains the margin of error for each feature (commonly available with U.S. Census Bureau data) [57].
- Upper and Lower Bounds: Provide fields that specify the range of possible values for each feature [57].
- Percent Above and Below: Define a percentage to create a symmetrical range around the original attribute value [57].
- Run Simulations: The tool will repeatedly simulate new datasets based on your original data and its uncertainty measure, then rerun the original analysis. The number of simulations is configurable [58].
- Interpret Results: The output will help you determine the stability of your original results.
- For hot spot analysis, the tool will flag features as "unstable" if they changed categories (e.g., from hot spot to not hot spot) in more than 20% of the simulations [57].
- For regression analysis, the tool provides charts showing the distribution of key diagnostics like R-squared and coefficients across all simulations [57] [58].
If the simulation results closely resemble your original findings, you can be confident in their robustness. Large differences suggest your conclusions should be stated more cautiously [57].
Q3: How can I optimize land use structure under interval uncertainty where parameters are only known to lie within a range?
A: Interval Uncertainty Optimization is designed for this scenario. It does not require knowing the exact probability distributions of uncertain parameters, only their upper and lower bounds. This method has been successfully applied in watershed-level land use planning to balance economic and ecological goals under uncertainty [11] [59].
Experimental Protocol:
- Define the Objective Function: Formulate your goal, such as maximizing total economic benefits from different land use types. The coefficients (e.g., net economic benefit per unit area) can be interval numbers. For example, the economic benefit of farmland might be expressed as an interval [59].
- Set Constraints: Define the system constraints using intervals to capture uncertainty. These typically include:
- Ecological constraints: Minimum areas for forest land or grassland to maintain ecosystem services like carbon storage and water conservation [11].
- Social constraints: Requirements for food security (minimum farmland area) [11] [29].
- Resource constraints: Limits on total land area and water availability [11].
- Technical constraints: Pollution emission caps (air, water, solid waste) [11].
- Solve the Model: Use an interval linear programming solver. The solution will provide optimal land use allocations as intervals.
- Example Output: A study on the Dongting Lake Eco-Economic Zone found that optimized economic benefits could range between [15622.72, 19150.50] × 10⁸ CNY, with corresponding interval allocations for farmland, woodland, and other land types [11].
This approach provides decision-makers with a flexible solution range, allowing them to select a specific plan based on their risk tolerance.
Q4: What is a practical framework for integrating ecosystem services into multi-scenario land use optimization?
A: A robust framework couples ecosystem service assessment with multi-objective optimization and spatial simulation. The following workflow, demonstrated in studies of the Liaohe River Basin and Xinjiang, is widely applicable [12] [60].
Q5: How do I choose an appropriate ensemble method to improve the predictive robustness of my land use model?
A: Ensemble learning methods enhance model robustness by combining multiple weak learners. The choice depends on your problem type (classification or regression) and specific goal. Below is a summary of key algorithms [61].
| Method Value | Algorithm Name | Supported Problems | Key Characteristics |
|---|---|---|---|
Bag |
Bootstrap Aggregation (Bagging) | Binary/Multiclass Classification, Regression | Reduces variance; uses out-of-bag samples for unbiased error estimation and feature importance [61]. |
Subspace |
Random Subspace | Binary/Multiclass Classification | Uses random subsets of predictors; useful for high-dimensional data and can handle missing values [61]. |
LSBoost |
Least-Squares Boosting | Regression | Sequentially builds models to correct errors of previous ones, minimizing squared error [61]. |
AdaBoostM1 |
Adaptive Boosting | Binary Classification | Gives higher weight to misclassified instances in each subsequent model [61]. |
RUSBoost |
Random Undersampling Boosting | Binary/Multiclass Classification | Designed for imbalanced datasets by combining data undersampling with boosting [61]. |
The Scientist's Toolkit: Essential Reagents for Land Use Modeling
| Research Reagent / Tool | Function in Land Use Optimization |
|---|---|
| InVEST Model | A suite of models for mapping and valuing ecosystem services (e.g., carbon storage, habitat quality, water yield) to inform ecological constraints and objectives [11] [12]. |
| PLUS / FLUS Model | Land use simulation models used to spatially allocate optimized land use quantities based on driving factors and development probabilities under different scenarios [11] [12] [60]. |
| NSGA-II | A multi-objective genetic algorithm used to find optimal land use structures that balance conflicting goals (e.g., maximizing both economic output and ecosystem service value) [60]. |
| Interval Optimization | A mathematical programming method that handles uncertainty by allowing parameters and solutions to be expressed as intervals between upper and lower bounds [11] [59]. |
| Geographical Detector | A statistical method used to identify the driving factors behind the spatial heterogeneity of ecosystem services and land use change [12]. |
| Sensitivity Analysis Tool | Tools (e.g., ArcGIS's Assess Sensitivity to Attribute Uncertainty) that measure the stability of spatial analysis results when input data values are uncertain [57] [58]. |
Frequently Asked Questions (FAQs)
FAQ 1: What are the core policy concepts of Ecological Redlines and Basic Farmland Protection, and how do they integrate into land use optimization research?
Ecological Redlines (ERLs) are a spatial regulatory policy in China that delineates and strictly protects critical ecological spaces, such as areas vital for biodiversity, water conservation, and soil retention, to ensure ecosystem integrity and sustainability [62] [63]. Basic Farmland Protection is a policy framework employing various zoning and regulatory strategies to preserve agricultural land from conversion to non-farm uses, recognizing farmland as a vital finite resource [64]. In land use optimization research for multiple ecosystem services, these policies act as critical constraints in spatial models. They guide simulation and optimization by restricting urban development on protected lands, thereby helping to balance economic development with the conservation of key ecological and agricultural functions [62] [41].
FAQ 2: My land use simulation model fails to properly incorporate vector-based policy boundaries, like redline zones. How can I address this?
Many traditional land use simulation models (e.g., CLUE-S, SLEUTH) are limited as they primarily handle policy factors in raster format, which can struggle with the precise vector boundaries of redline policies [62]. To address this, you can adopt the Patch-generating Land Use Simulation (PLUS) model. The PLUS model improves simulation accuracy by specifically addressing area-based and patch-oriented spatial planning policies through its Land Expansion Analysis Strategy (LEAS) and multi-class random patch seeds (CARS) modules [62] [41]. This enhanced capability makes it a powerful tool for examining how ERLs shape future land use trajectories.
FAQ 3: How can I quantitatively evaluate the effectiveness of these policies in safeguarding ecosystem services beyond simple land use change statistics?
Beyond tracking changes in land use categories, a robust method is to integrate your land use simulation with Ecological Network Analysis (EN) and ecosystem service valuation models [62] [63].
- Ecological Network Analysis: Construct ecological networks based on simulated future land use scenarios. You can use the minimum cumulative resistance (MCR) model and circuit theory to identify ecological corridors and nodes. By comparing landscape connectivity metrics (e.g., probability of connectivity, corridor connectivity) across different policy scenarios, you can quantitatively assess the policy's impact on maintaining ecosystem connectivity and function [62].
- Ecosystem Service Assessment: Use models like InVEST (Integrated Valuation of Ecosystem Services and Tradeoffs) to quantify key services such as carbon sequestration, water purification, and habitat quality [41] [63]. Comparing the output values of these services under a policy-constrained scenario versus a business-as-usual development scenario directly demonstrates the policy's benefit in enhancing or maintaining ecosystem service flows [63].
FAQ 4: What is a practical framework for initially delineating or evaluating Ecological Redline Areas in a research context?
A established transdisciplinary framework involves determining Ecological Redline Areas (ERAs) based on multiple scientific criteria and stakeholder input [63]. The process generally follows these steps:
- Select Desired Ecosystem Services: Align with policy goals and conduct stakeholder surveys to select regionally critical ES (e.g., carbon sequestration, water conservation, biodiversity) [63].
- Map Hotspots: Use high-resolution land use data and biophysical models (like InVEST) to map hotspots for:
- Ecosystem Services: Areas providing the top 10-20% of each selected ES.
- Biodiversity: Areas with the most suitable habitat for key species.
- Ecological Fragility: Areas highly vulnerable to major stressors (e.g., soil erosion, coastal erosion) [63].
- Synthesize and Negotiate: Spatially overlay these hotspot maps to identify optimal ERAs. This scientific output then informs a stakeholder negotiation process to define a final, implementable ERA boundary [63].
Detailed Experimental Protocols
Protocol 1: Multi-Scenario Land Use Simulation with Policy Constraints
This protocol outlines the steps for simulating future land use patterns under different Ecological Redline and farmland protection scenarios using the PLUS model [62].
Objective: To project land use patterns under various policy intervention scenarios (e.g., Strict ERL enforcement, No ERL, Farmland Protection) and assess their impacts on urban expansion, ecological land, and farmland.
Methodology:
- Data Preparation: Gather spatial data, including:
- Historical land use maps (at least two time points, e.g., 2005 and 2015).
- Driver variables: Distance to roads, rivers, city centers; topography; population density; etc.
- Policy constraints: Vector boundaries of Ecological Redline Zones and Basic Farmland Protection Areas, converted to raster format.
- Model Calibration & Validation:
- Input historical land use data and driver variables into the PLUS model.
- Use the LEAS module to analyze the drivers of land expansion for each class.
- Use the CARS module to simulate land use for a future year (e.g., predict 2020 using 2005 and 2015 data).
- Compare the simulation with the actual land use map for that year to validate model accuracy. Key accuracy indicators include Kappa coefficient and Figure of Merit (FoM). Calibrate model parameters (e.g., patch generation threshold, expansion coefficient) until satisfactory accuracy is achieved [62].
- Multi-Scenario Simulation:
- Scenario 1 (Strict ERL): Define ERL zones as areas where conversion to construction land is forbidden.
- Scenario 2 (No ERL): Remove all ERL restrictions.
- Scenario 3 (Farmland Protection): Define farmland protection zones where conversion to construction land is forbidden.
- Run the PLUS model for each scenario to generate land use maps for a target year (e.g., 2030 or 2040).
Troubleshooting Tip: If the model shows low accuracy in predicting the distribution of ecological land, ensure that drivers related to ecological suitability (e.g., elevation, slope, proximity to water bodies) are included in the LEAS analysis.
Protocol 2: Evaluating Policy Impact via Ecological Network Construction and Analysis
This protocol describes how to assess the effectiveness of policy scenarios on ecological connectivity by building and analyzing ecological networks [62].
Objective: To quantify and compare the structure and connectivity of ecological networks under the different land use scenarios simulated in Protocol 1.
Methodology:
- Identify Ecological Sources: On the simulated land use maps, identify core patches of key ecological land (e.g., large forests, wetlands, nature reserves). These serve as "sources" in the network.
- Construct Resistance Surfaces: Assign a resistance value to each land use type, where higher values indicate greater difficulty for species movement (e.g., high for construction land, low for forest).
- Generate Ecological Corridors and Nodes:
- Use the Minimum Cumulative Resistance (MCR) model to identify the least-cost paths for species movement between ecological sources—these are your ecological corridors [62].
- Apply circuit theory to further pinpoint key "pinch points" or barriers within these corridors; these are classified as ecological nodes [62].
- Quantify Network Connectivity: Calculate established landscape connectivity metrics for each scenario's network. Key metrics include:
- Probability of Connectivity (PC): Measures the overall connectivity of the landscape.
- Corridor Connectivity: Assesses the quality and integrity of the corridors.
- Compare these metrics across your different policy scenarios to determine which policy best maintains or enhances ecological connectivity.
Troubleshooting Tip: If the resulting ecological network appears overly fragmented, review the resistance surface values assigned to different land use types. Moderately resistant land uses (e.g., agriculture) may have been assigned values that are too high.
Research Reagent Solutions: Essential Models and Tools
The table below lists key computational models and tools essential for conducting research in this field.
| Tool/Model Name | Primary Function | Application in this Research Context |
|---|---|---|
| PLUS Model [62] [41] | Land use simulation under various scenarios and policy constraints. | Projects future land use patterns by integrating Ecological Redline and Farmland Protection zones as spatial constraints. |
| InVEST Model [41] [63] | Spatially explicit assessment of multiple ecosystem services. | Quantifies the output of ES (e.g., carbon storage, water purification) under different simulated land use scenarios to evaluate policy effectiveness. |
| MCR Model & Circuit Theory [62] | Ecological network construction and analysis. | Identifies ecological corridors and nodes based on a resistance surface, allowing for the assessment of landscape connectivity. |
| Interval Uncertainty Optimization Model [41] | Land use structure optimization under uncertainty. | Allocates land use quantities to maximize net benefits (economic & ecological) while respecting policy-driven constraints on land conversion. |
Workflow Diagram
Quantitative Data for Policy Impact Assessment
The table below summarizes example quantitative findings from research, illustrating the potential impacts of different policy scenarios on land use and ecosystem metrics.
Table 1: Example Impact of Ecological Redline Policies in a Case Study (Wuhan) [62]
| Metric | Strict ERL Policy Scenario | No ERL Policy Scenario | Key Observation |
|---|---|---|---|
| Farmland Conservation | Notable effect in preserving farmland | Significant farmland loss | ERLs help mitigate urban expansion on prime agricultural land. |
| Urban Expansion | Mitigated | Significant urban sprawl | - |
| Ecological Corridors | Higher quantity and quality | Fragmented and fewer corridors | Policy directly enhances landscape connectivity. |
| Probability of Connectivity (PC) | Higher value | Lower value | - |
| Corridor Connectivity | Higher value | Lower value | - |
Table 2: Example Economic and Ecological Outcomes from Integrated Optimization [41]
| Optimized Land Type | Optimized Area (km²) | Key Outcomes of Land Use Optimization |
|---|---|---|
| Farmland | 25,686.99 - 25,932.61 | 1. Improved regional economic benefits. 2. Reduced pollutant emissions. 3. Enhanced ecosystem service functions and values. |
| Woodland | 22,093.37 - 22,295.23 | |
| Water Area | 7,536.86 - 7,767.01 | |
| Construction Land | 2,660.92 - 2,987.49 | |
| Economic Benefit (CNY) | 15,622.72×10⁸ - 19,150.50×10⁸ |
Technical Support Center
Troubleshooting Common Data Gap Challenges
FAQ 1: My land cover classification model is confusing different agricultural crop types. What steps can I take to improve its predictive accuracy?
- Problem Diagnosis: This is often a symptom of insufficient spectral-temporal data or incorrect model parameterization. Models can struggle to distinguish between crops that have similar spectral signatures at a single point in time.
- Recommended Solution: Implement a multi-temporal analysis using a time series of high-resolution satellite imagery (e.g., Sentinel-2) to capture the unique phenological stages (growth cycles) of each crop [65] [66]. Furthermore, ensure your model is trained on a balanced and robust set of training data that accurately represents the specific crop varieties in your study area [67].
- Experimental Protocol:
- Data Acquisition: Source a time series of Sentinel-2 Level-2A surface reflectance data for the entire growing season from a provider like Google Earth Engine [65].
- Feature Engineering: Calculate a set of vegetation indices (e.g., NDVI, EVI) for each image date to create a "temporal signature" for each crop type [65].
- Model Training: Use a machine learning algorithm like Random Forest, which has proven effective for complex land cover classification, and train it using the multi-temporal stack of spectral bands and indices as predictors [65] [66].
- Validation: Validate the model's accuracy using a reserved subset of high-quality ground truth data, aiming for an overall accuracy of >85% [65].
FAQ 2: My project involves estimating ecosystem service values, but the available regional land use maps are too coarse. How can I create a more detailed map?
- Problem Diagnosis: Coarse-resolution global land cover datasets (e.g., 30m resolution) often have limited class definitions and can misrepresent small-scale features, leading to inaccurate Ecosystem Service Value (ESV) calculations [6].
- Recommended Solution: Generate a custom, high-resolution land use/land cover (LULC) map by applying a supervised classification workflow to very high spatial resolution (VHSR) imagery, such as Pléiades (0.5m), fused with multi-temporal high-resolution data like Sentinel-2 [66].
- Experimental Protocol:
- Image Fusion: Use a processing chain like the MORINGA methodology, which segments a VHSR image and then extracts spectral and textural predictors from both the VHSR image and a time series of HSR images [66].
- Field Data Collection: Establish a robust field database through systematic and stratified sampling. At each site, record GPS coordinates, take photographs, and delineate homogeneous LULC polygons based on photointerpretation of the VHSR imagery [66].
- Object-Based Classification: Train a Random Forest classifier on the image objects (segments) rather than individual pixels. This approach integrates spatial context and texture, significantly improving classification accuracy for heterogeneous landscapes [66].
- Post-Processing: Cross-check the initial classification output with external GIS data sources and perform manual photointerpretation corrections to refine the final LULC map [66].
FAQ 3: I am concerned that spatial autocorrelation in my training data is inflating my model's performance metrics. How can I validate my model more rigorously?
- Problem Diagnosis: Spatial autocorrelation (SAC) occurs when training and test data are geographically too close, violating the assumption of independence. This leads to over-optimistic accuracy assessments and poor model generalization to new areas [67].
- Recommended Solution: Implement a spatial cross-validation technique instead of a simple random train-test split.
- Experimental Protocol:
- Spectral & Topographic Data: Landsat 8 OLI and Sentinel-2 MSI surface reflectance data; TanDEM-X Digital Elevation Model (DEM) [65] [66].
- Ancillary Data: National land survey data for calibration and validation [6].
- Region-Based Splitting: Divide your study area into multiple distinct spatial folds (e.g., using k-means clustering based on sample coordinates).
- Model Training & Validation: Iteratively train your model on all folds except one, which is used for validation. This ensures the model is tested on geographically distinct areas it hasn't "seen" during training.
- Performance Assessment: Report the mean and standard deviation of accuracy metrics (e.g., Overall Accuracy, Kappa Coefficient) from all validation folds to get a realistic measure of model performance [67].
FAQ 4: My study requires highly accurate topographic data, but the area is densely vegetated. What technology can map the underlying ground surface?
- Problem Diagnosis: Optical imagery and traditional surveying cannot penetrate forest canopies to map the bare earth terrain, creating a critical data gap for hydrological or geological modeling [68].
- Recommended Solution: Use Airborne LiDAR (Light Detection and Ranging), which can penetrate vegetation gaps to provide a detailed model of the ground surface with centimeter-level accuracy [68].
- Experimental Protocol:
- Mission Planning: Plan the LiDAR flight paths with sufficient overlap (e.g., 50%) to ensure complete coverage and data density.
- Data Acquisition: Deploy an airborne LiDAR system over the area of interest. The system emits laser pulses and measures return times to create a dense "point cloud" of the terrain and everything on it [68].
- Data Processing: Classify the point cloud to separate "ground" points from points representing vegetation and buildings using specialized software.
- Product Generation: Interpolate the classified ground points to create a high-resolution Digital Elevation Model (DEM) that represents the bare earth topography [68].
The Scientist's Toolkit: Essential Research Reagents & Materials
Table 1: Key Data Sources and Analytical Tools for Land Cover and Ecosystem Service Research
| Item Name | Type | Primary Function in Research |
|---|---|---|
| Sentinel-2 MSI | Satellite Imagery | Provides high-resolution (10-20m), multi-spectral data with a high revisit frequency, ideal for monitoring vegetation dynamics and land cover change over time [65] [66]. |
| Landsat 8/9 OLI | Satellite Imagery | Offers a long-term, medium-resolution (30m) historical archive for change detection and time-series analysis, supporting climate change impact studies [65]. |
| Pléiades | Satellite Imagery | Delivers very high spatial resolution (0.5m) imagery for precise delineation of small-scale features and validation of coarser land cover maps [66]. |
| Airborne LiDAR | Active Remote Sensing | Generates precise 3D point clouds for creating high-accuracy Digital Elevation Models (DEMs) and quantifying forest structure, even in vegetated areas [68]. |
| TanDEM-X DEM | Topographic Data | A global digital elevation model used to derive topographic predictors (slope, aspect) that influence land use and ecosystem processes [66]. |
| Random Forest | Machine Learning Algorithm | A powerful classifier for land cover mapping that handles complex, non-linear relationships in multi-spectral data and provides estimates of variable importance [65] [66]. |
| Permanent Basic Cropland (PBC) & Ecological Redline (RLE) Data | GIS Data | Serves as a critical spatial constraint in land use optimization models to ensure simulations adhere to real-world land use policies and planning controls [6]. |
Experimental Workflow for High-Resolution Land Cover Mapping
The following diagram illustrates the integrated methodological pipeline for generating high-resolution land cover maps to support ecosystem services research.
Quantitative Data for Land Cover Classification
Table 2: Comparative Performance of Machine Learning Classifiers in Land Cover Mapping (Based on [65])
| Machine Learning Classifier | Overall Accuracy (OA) 2018 | Kappa Coefficient (KC) 2018 | Overall Accuracy (OA) 2022 | Notable Characteristics |
|---|---|---|---|---|
| Random Forest (RF) | 0.87 | 0.83 | Consistently High | Robust to overfitting; handles complex patterns well [65]. |
| Gradient Tree Boosting (GTB) | Not Specified | Not Specified | Performance Increased | High predictive power through sequential boosting [65]. |
| Naive Bayes (NB) | Not Specified | Not Specified | Less Consistent | Can be effective with limited training data [65]. |
Note: The specific OA for GTB and NB in 2018 were not detailed in the source, but the study noted RF's consistent superiority and GTB's performance gain over time [65].
Welcome to the Land Use Optimization Support Center
This technical support center is designed for researchers and scientists navigating the complex challenges of multi-objective land use optimization. The guides and FAQs below address common computational and methodological issues encountered when balancing socio-economic development with critical environmental goals such as carbon sequestration, biodiversity protection, and water resource sustainability within ecosystem services research.
Core Concepts and Definitions
Multi-Objective Optimization (MOO) in land use planning involves simultaneously addressing multiple, often conflicting, objectives rather than optimizing them in isolation. Unlike single-objective optimization that yields a unique solution, MOO identifies a set of optimal compromises known as the Pareto front [69].
A solution is Pareto-optimal if no objective can be improved without adversely affecting at least one other objective. Formally, a solution (x^) is Pareto-optimal if there is no other (x) such that (f_i(x) \leq f_i(x^)) for all objectives (i), with at least one strict inequality [69].
Troubleshooting Guides
Guide: Resolving Suboptimal Pareto Fronts in Spatial Land Use Optimization
Issue Statement: The optimization algorithm converges to a limited set of similar land use configurations, failing to produce a diverse Pareto front that adequately captures the trade-offs between economic development and ecological conservation.
Symptoms & Error Indicators:
- Clustered or few non-dominated solutions in the objective space.
- Significant gaps in the visualized Pareto front.
- Repeatedly obtaining similar land use patterns across independent optimization runs.
Environment Details:
- Common with algorithms like NSGA-II or NSGA-III.
- Occurs when optimizing complex, large-scale spatial land use patterns.
Possible Causes:
- Inadequate diversity preservation mechanism in the genetic algorithm.
- Poor parameter tuning (e.g., crossover/mutation rates).
- Optimization objectives are highly correlated or conflicting in a non-convex manner.
Step-by-Step Resolution Process:
- Verify Algorithm Parameters: Increase the population size and adjust the crossover and mutation probabilities to encourage exploration. For NSGA-III, ensure the reference points are adequately spread across the objective space [70].
- Implement Niching and Crowding: Ensure the algorithm's diversity preservation mechanisms, such as crowding distance calculation or niching, are correctly implemented to prevent premature convergence [70] [69].
- Hybridize Optimization Methods: Combine evolutionary algorithms with local search (memetic algorithms) to refine solutions and explore the objective space more thoroughly.
- Reformulate Objectives: Check for objective function scaling issues. Normalize objectives to comparable ranges to prevent one objective from dominating the selection process.
Escalation Path: If the problem persists, consider switching to a more recent algorithm variant like NSGA-III, which uses a reference point-based diversity preservation mechanism to better handle many-objective problems [70].
Validation Step: A successful resolution will yield a Pareto front with solutions evenly distributed across the range of possible trade-offs, for instance, from high-economic/low-ecological value to low-economic/high-ecological value configurations.
Guide: Addressing Inaccurate Carbon Storage Predictions in the InVEST Model
Issue Statement: The Integrated Valuation of Ecosystem Services and Tradeoffs (InVEST) model outputs for carbon storage show significant deviation from field measurements or expected values after land use change simulation.
Symptoms & Error Indicators:
- Predicted carbon storage values are anomalously high or low for certain land use classes (e.g., forest, cropland).
- Large, unexplained changes in regional carbon stock after minor land use changes.
- Model validation shows low accuracy against ground-truthed data.
Environment Details:
- Using the InVEST Carbon Storage and Sequestration module.
- Often occurs after coupling with a land use prediction model like the PLUS model.
Possible Causes:
- Incorrect or oversimplified carbon pool values assigned to Land Use/Land Cover (LULC) classes.
- LULC map classification errors or misalignment with carbon pool data.
- Failure to account for the impact of climate change scenarios on carbon sequestration rates.
Step-by-Step Resolution Process:
- Audit Carbon Pool Data: Cross-reference the four carbon pools (aboveground biomass, belowground biomass, soil, and dead organic matter) assigned to each LULC class with recent, localized literature or field survey data. Avoid using default values from different biomes [70] [71].
- Validate LULC Map Accuracy: Re-check the accuracy of the base LULC map using a confusion matrix. A kappa coefficient >0.8 and overall accuracy >0.85 are considered reliable for input into InVEST [70].
- Incorporate Climate Scenarios: For future predictions, ensure the model runs are driven by appropriate climate scenarios (e.g., SSP-RCP scenarios from CMIP6) that affect vegetation growth and soil carbon dynamics [70].
- Re-run and Recalibrate: Execute the InVEST model with the revised data. If discrepancies remain, perform a sensitivity analysis to identify which carbon pool has the greatest influence on the output and focus recalibration efforts there.
Escalation Path: For persistent, systematic errors, the underlying ecosystem service mechanism might be oversimplified. Consider moving to a more complex process-based model for carbon cycling or supplementing the InVEST results.
Validation Step: Compare the new model outputs against a reserved subset of field survey data not used in calibration. The correlation coefficient (R²) should show significant improvement.
Guide: Troubleshooting Land Use Simulation Errors in the PLUS Model
Issue Statement: The Patch-generating Land Use Simulation (PLUS) model fails to accurately simulate future LULC patterns, leading to poor prediction performance when used for scenario analysis.
Symptoms & Error Indicators:
- Low validation accuracy (e.g., Kappa coefficient < 0.7) when simulating a known past year.
- The model produces spatially unrealistic land use patches (e.g., excessive fragmentation or illogical land use transitions).
- Simulation crashes or produces null outputs.
Environment Details:
- Using the PLUS model for multi-scenario LULC simulation.
- Input data include historical LULC maps and driving factors (e.g., topography, infrastructure, socioeconomic data).
Possible Causes:
- Inadequate or irrelevant driving factors for the study region.
- Incorrect setting of the land expansion analysis strategy (LEAS).
- Poorly calibrated parameters in the Cellular Automata (CA) model based on the Multi-class Random Forest (CARS) component.
Step-by-Step Resolution Process:
- Review Driving Factors: Conduct a statistical analysis (e.g., correlation or importance analysis) to ensure all selected driving factors (e.g., distance to roads, slope, population density) have a plausible and significant influence on land use changes in your study area. Remove redundant or irrelevant factors [70].
- Calibrate the LEAS Module: Within the LEAS, ensure that the sampling rate and the number of trees in the Random Forest classifier are appropriately set. Use out-of-bag error estimation to evaluate the performance of the Random Forest in capturing land change drivers.
- Tune the CARS Module: Adjust key parameters in the CARS module, including the neighborhood weight for different land types (controlling spatial inertia), the conversion cost matrix (defining which transitions are allowed), and the patch generation threshold (controlling the seed of new patches) [70].
- Validate with a Known Baseline: Always run a simulation for a past year (e.g., simulate 2020 using data from 2010 and 2015) to validate the model's accuracy before proceeding to future predictions.
Escalation Path: If the model continues to fail, rebuild the input LULC maps from source data to check for classification errors or spatial inconsistencies.
Validation Step: A successful simulation of a past year should achieve a kappa coefficient of greater than 0.8, confirming the model's reliability for forecasting [70].
Frequently Asked Questions (FAQs)
Q1: What is the fundamental difference between single-objective and multi-objective optimization in land use planning?
A1: Single-objective optimization seeks a single "best" solution that maximizes or minimizes one performance measure (e.g., maximize economic returns from land). Multi-objective optimization (MOO) acknowledges that real-world planning involves competing goals (e.g., economy vs. ecology). Instead of a single solution, MOO produces a Pareto front—a set of optimal trade-off solutions where improving one objective worsens another. This provides decision-makers with a range of viable choices based on their priorities [69].
Q2: How do I quantify and analyze the "trade-offs" between socio-economic and environmental objectives?
A2: Trade-offs are formally analyzed from the Pareto front. Once you have the set of non-dominated solutions, you can:
- Visualize with 2D/3D Scatter Plots: Plot the solutions in the objective space to observe the relationship between objectives (e.g., GDP on the x-axis and carbon storage on the y-axis). A negative sloping curve indicates a trade-off.
- Calculate Trade-off Rates: The slope between two adjacent solutions on the Pareto front quantifies how much of one objective must be sacrificed to gain a unit of another.
- Use Statistical Correlation: Calculate the correlation coefficients (e.g., Pearson's) between objective values across the Pareto set. A significant negative correlation confirms a trade-off, while a positive correlation suggests a synergistic relationship [70] [71].
Q3: Our team has limited computational resources. What is a relatively efficient method for solving a land use MOO problem with three objectives?
A3: For problems with a few objectives (three is manageable), the epsilon-constraint method is often computationally efficient. This method optimizes one primary objective while treating the other objectives as constraints with defined epsilon ((\epsilon)) levels. By systematically varying the (\epsilon) levels for the secondary objectives, you can generate a representative Pareto front without the high computational cost of more complex evolutionary algorithms [69].
Q4: How can we incorporate future uncertainty, like climate change, into our land use optimization framework?
A4: The best practice is to use a scenario-based approach integrated with your optimization models. Specifically:
- Adopt Climate Scenarios: Utilize established scenario frameworks like the CMIP6's Shared Socioeconomic Pathways (SSPs) and Representative Concentration Pathways (RCPs). These provide coherent narratives and quantitative projections for future climate and socioeconomic development [70].
- Coupled Model Simulation: Feed these scenarios into your land use simulation model (e.g., PLUS) to generate alternative future LULC maps under each scenario.
- Multi-Scenario Optimization: Run your multi-objective optimization for each scenario to produce a distinct Pareto front. This allows you to identify land use configurations that are robust across different future climates or ones that are optimal for a specific anticipated future [70].
Experimental Protocols & Data
Protocol: Coupling the PLUS and InVEST Models for Scenario-Based Ecosystem Service Assessment
This protocol details the integrated LULC-MOGA-PLUS-InVEST (LMPI) framework for predicting changes in ecosystem services under future scenarios [70].
1. Objective: To simulate future land use patterns and quantify their impact on regulating ecosystem services, specifically carbon storage.
2. Materials/Software:
- PLUS model software.
- InVEST model software.
- Historical LULC maps (at least two time points).
- Spatial data for driving factors (topography, infrastructure, climate, etc.).
- Future scenario data (e.g., SSP-RCP projections from CMIP6).
3. Step-by-Step Workflow:
- Data Preparation: Collect, crop, and resample all spatial data to a consistent resolution and extent. Input data include historical LULC maps and spatially explicit driver data.
- PLUS Model Calibration and Validation:
- Input LULC data from Time 1 and Time 2, along with driver data, into the PLUS model.
- Use the LEAS module to analyze the drivers of land use expansion.
- Calibrate the CARS module to simulate land use from Time 1 to Time 2.
- Validate the simulation result for Time 2 against the actual LULC map for Time 2. A kappa coefficient >0.8 and overall accuracy >0.85 are acceptable to proceed [70].
- Future Scenario Simulation:
- Using the calibrated PLUS model, simulate future LULC for your target year (e.g., 2050) under different SSP-RCP scenarios (e.g., SSP1-2.6 for sustainability, SSP5-8.5 for fossil-fueled development).
- Ecosystem Service Quantification:
- Input the simulated future LULC maps into the InVEST model's Carbon Storage and Sequestration module.
- Ensure the carbon pool data (aboveground, belowground, soil, dead matter) for each LULC class are accurate and, if possible, adjusted for future climate conditions.
- Run the InVEST model to obtain maps and total values of carbon storage for each future scenario.
- Analysis: Compare the carbon storage outcomes across different land use scenarios to inform policy and spatial planning.
Quantitative Data for Land Use Optimization and Ecosystem Services
Table 1: Model Performance Metrics for Land Use Simulation and Optimization [70]
| Model/Algorithm | Key Performance Metric | Acceptable Threshold | Excellent Performance | Primary Function |
|---|---|---|---|---|
| PLUS Model | Kappa Coefficient | > 0.70 | > 0.85 | Simulates spatial land use change patterns. |
| PLUS Model | Overall Accuracy | > 0.75 | > 0.90 | Measures total pixel-to-pixel simulation correctness. |
| NSGA-II/III | Pareto Front Spread | - | Uniform, wide distribution | Generates diverse non-dominated solutions. |
| InVEST Model | R² vs. Field Data | > 0.60 | > 0.80 | Validates predicted vs. measured ecosystem service values. |
Table 2: Common Optimization Objectives and Constraints in Land Use Studies [70] [72] [73]
| Category | Specific Objective/Constraint | Typical Metric | Relevance to SDGs |
|---|---|---|---|
| Socio-Economic | Maximize Economic Output | Gross Domestic Product (GDP) | SDG 8: Decent Work & Economic Growth |
| Socio-Economic | Maximize Agricultural Production | Crop Yield (Tons/Ha) | SDG 2: Zero Hunger |
| Environmental | Maximize Carbon Sequestration | Total Carbon Storage (Mg C) | SDG 13: Climate Action |
| Environmental | Protect Water Resources | Water Yield / Quality Index | SDG 6: Clean Water & Sanitation |
| Environmental | Conserve Biodiversity | Habitat Quality / Species Richness | SDG 15: Life on Land |
| Constraint | Urban Growth Boundary | Spatial Zoning Layer | SDG 11: Sustainable Cities |
| Constraint | Minimum Food Self-Sufficiency | % of Caloric Needs Met | SDG 2: Zero Hunger |
The Scientist's Toolkit: Key Research Reagents & Materials
Table 3: Essential "Reagents" for Land Use Optimization Experiments [70] [71] [73]
| Item Name | Specifications / Variants | Primary Function in Research |
|---|---|---|
| LULC Maps | Class resolution (e.g., CORINE, NOAA), temporal frequency, spatial resolution (e.g., 30m Landsat, 10m Sentinel-2). | The fundamental spatial data layer representing the distribution and state of land cover, serving as the base map for analysis and simulation. |
| Spatial Driver Data | Topographic (DEM, Slope), Infrastructure (distance to roads, cities), Socioeconomic (population density, GDP), Biophysical (soil type, precipitation). | Explanatory variables used in models (like PLUS) to understand and predict the causes and locations of land use change. |
| Climate Scenario Data | CMIP6 SSP-RCP scenarios (e.g., SSP1-2.6, SSP5-8.5). | Projections of future climate and socioeconomic conditions used to run models under consistent and scientifically grounded assumptions about the future. |
| Carbon Pool Data | Aboveground biomass, Belowground biomass, Soil organic carbon, Dead organic matter. | Look-up tables required by the InVEST model to convert a LULC map into a total carbon storage value. Must be localized for accuracy. |
| Optimization Algorithm | NSGA-II, NSGA-III, MOEA-D, epsilon-Constraint Method. | The computational engine that searches for the best possible land use allocations that balance multiple, conflicting objectives. |
| Ecosystem Service Model | InVEST, ARIES, SOLUS. | A suite of tools used to quantify the biophysical and economic value of ecosystem services (e.g., carbon storage, water purification, habitat quality) provided by a given LULC map. |
Benchmarking Success: Model Validation, Comparative Analysis, and Policy Efficacy
In land use and land cover (LULC) change modeling for ecosystem services research, selecting the appropriate simulation model is crucial for generating accurate and reliable projections. This technical support guide provides a comparative analysis of three widely used cellular automata-based models—CA-Markov, FLUS (Future Land Use Simulation), and PLUS (Patch-generating Land Use Simulation)—to help researchers select and optimize models for their specific applications in ecosystem services valuation and sustainable land use planning.
Model Performance Comparison
The table below summarizes key performance metrics and characteristics of the three models based on comparative studies:
| Feature | CA-Markov | FLUS | PLUS |
|---|---|---|---|
| Overall Accuracy/Kappa | 0.802 (Kappa) [74] | 0.9433 (Kappa) [75] | 0.983 (Overall), 0.972 (Kappa) [76] |
| FoM Coefficient | Information missing | 0.1080 [75] | 0.509 [76] |
| Spatial Consistency | 87.88% [74] | Information missing | Information missing |
| Key Strengths | Suitable for long-term trend prediction; High stability with limited data [74] | Handles uncertainty and complexity from natural and human factors [75] | High simulation accuracy; Rapid data processing; Effective at patch-level simulation [76] |
| Limitations | Primarily predicts unidirectional transformations [74]; Potential striping artifacts in output [77] | Information missing | Information missing |
| Best Application Context | Long-term trend prediction; Scenarios with data limitations [74] | Multi-scenario simulation with complex human-natural drivers [75] | Fine-scale patch evolution; Complex multi-type land use changes [76] |
Table 1: Quantitative comparison of model performance metrics and characteristics
Model Selection Workflow
The following diagram illustrates the decision-making process for selecting the appropriate model based on research objectives and data constraints:
Troubleshooting Guides
FAQ 1: Why does my CA-Markov output show striping patterns, and how can I resolve this?
Problem: Striping or blocky artifacts appear in the CA-Markov prediction map output, particularly when using multiple land use classes.
Causes:
- Insufficient suitable cells to allocate predicted land class amounts [77]
- Driver variables with inherent striping patterns or insufficient explanatory power [77]
- Equal suitability values across large areas, causing systematic allocation patterns [77]
- Potentially inaccurate input land cover maps or short time intervals between input maps with excessive change [77]
Solutions:
- Verify accuracy of input land cover classifications [77]
- Increase the quality and explanatory power of driver variables [77]
- Extend the time interval between input land cover maps if change appears excessive [77]
- Adjust CA-Markov parameters:
- Experiment with different filter types and sizes
- Modify the number of iterations
- Review and adjust transition probability matrices
FAQ 2: How do I select the most appropriate model for ecosystem services research?
Decision Framework:
- For patch-level simulations with high accuracy requirements: Choose PLUS model (FoM > 0.5) [76]
- For scenario analysis with complex human-natural interactions: Choose FLUS model [75]
- For long-term trend prediction with limited or imbalanced data: Choose CA-Markov [74]
- For capturing bidirectional transformation patterns: Consider deep learning approaches where sample size permits [74]
Validation Protocol:
- Calculate overall accuracy and Kappa coefficient (target: >0.8) [74] [76] [75]
- Compute Figure of Merit (FoM) coefficient (ranges: 0.1-0.5+ depending on model) [76] [75]
- Assess spatial consistency with observed data (target: >85%) [74]
- Validate model stability with sensitivity analysis
FAQ 3: What are the key differences in how these models handle land use transitions?
Transition Patterns:
- CA-Markov: Primarily predicts unidirectional transformations (e.g., farmland to construction land) [74]
- FLUS: Handles uncertainty and complexity under combined natural and anthropogenic influences [75]
- PLUS: Incorporates multi-type stochastic seeding mechanisms for patch evolution [76]
- Deep Learning Alternatives: Capture bidirectional flow features and nonlinear "human decisions-ecological responses" coupling [74]
Implementation Considerations:
- PLUS uses a Land Expansion Analysis Strategy (LEAS) and rule-based mining [76] [26]
- FLUS employs adaptive inertia and competition mechanisms [75]
- CA-Markov relies on transition probability matrices and cellular filters [78]
Research Reagent Solutions
The table below details essential data inputs and their functions for land use change modeling in ecosystem services research:
| Research Reagent | Function | Source Examples |
|---|---|---|
| LULC Data | Base classification of land use/cover categories | Resource and Environment Data Center, Chinese Academy of Sciences [78] |
| Driving Factors | Explanatory variables for land use changes | Digital Elevation Model, slope, population, GDP, distance to roads [76] |
| Socioeconomic Data | Represent human influence on land changes | GDP, population density, night-time light data [78] |
| Environmental Variables | Capture natural constraints and opportunities | Annual precipitation, temperature, soil type, groundwater depth [78] |
| Policy Constraints | Incorporate spatial planning regulations | Ecological protection red lines, capital farmland protection areas [78] |
| Validation Data | Assess model accuracy and performance | Historical LULC data for cross-validation [76] |
Table 2: Essential research reagents for land use change modeling experiments
Experimental Protocols
Standard Model Validation Methodology
Cross-Validation Procedure:
- Use historical land use data (e.g., 2000, 2010) to simulate a known year (e.g., 2020) [76]
- Compare simulated map with actual observed land use data [74]
- Calculate accuracy metrics:
Sample Size Considerations:
- PLUS and FLUS: Require sufficient sample sizes for training [74]
- CA-Markov: Maintains stability even with sample imbalance [74]
- Deep Learning models: Require large, balanced sample sizes for optimal performance [74]
Multi-Scenario Simulation Protocol
Scenario Development:
- Define scenario frameworks:
- Incorporate policy constraints:
- Adjust transition probabilities and constraints according to scenario objectives
Ecosystem Service Valuation Integration:
- Calculate Ecosystem Service Value (ESV) using value coefficients per land use type [78] [75]
- Apply modified value equivalence factors appropriate to study region [75]
- Analyze ESV changes under different simulation scenarios [78] [75]
- Identify tradeoffs between development and conservation objectives
Frequently Asked Questions (FAQs)
FAQ 1: Why is it critical to distinguish between calibration and validation when testing my land-use optimization model? A strict separation between calibration and validation is fundamental to obtaining a truthful assessment of your model's predictive power. Calibration involves estimating and adjusting model parameters to improve agreement with one dataset (e.g., land change between t0 and t1). Validation, conversely, is the process of testing the model's predictive accuracy against a completely independent dataset (e.g., predicting t2 from t1 and comparing to the observed t2 map). Using information from the validation period (like the quantity of land cover at t2) during calibration will lead to over-fitting, where the model describes both the underlying signal and the random noise specific to the calibration data. This gives a false sense of model performance and reduces its ability to extrapolate accurately [79].
FAQ 2: My model appears to perform well, but how can I tell if it's actually better than a simple "no-change" prediction? You should compare your model's performance against a Null model of pure persistence. A Null model predicts that the landscape at time t2 will be identical to the landscape at time t1. Research has shown that for many land-use change models, the agreement between the reference map of t1 and t2 is greater than the agreement between the predicted t2 and the reference t2. If your model does not outperform this naive prediction, it indicates that the model is not capturing the processes of change effectively and is not providing additional predictive power beyond a simple assumption of no change [79].
FAQ 3: What are the most common sources of error I should look for when my validation results are poor? Poor validation results often stem from a few key areas. Using a single metric like "percent correct" can hide the specific sources of error. A robust validation technique should budget the sources of error, helping you identify where the model is failing. Common issues include:
- Error in quantity: The model predicts the wrong total area of a land-use class.
- Error in location: The model allocates the correct total area of a class but in the wrong spatial locations.
- Error in fragmentation/pattern: The spatial configuration of the predicted patches does not match reality, which can be assessed with spatial metrics [79].
FAQ 4: The relationships between ecosystem services in my study area seem inconsistent. Why is this happening? The relationships between ecosystem services (trade-offs and synergies) are often scale-dependent [80]. A trade-off observed at one spatial scale (e.g., a 1 km grid) might appear as a synergy at a broader scale (e.g., an 83 km regional scale). This occurs because different factors control ecosystem services at different scales. At finer scales, relationships may be dominated by local anthropogenic activities, while at broader scales, they may be controlled by the physical environment and climate. Your analysis should therefore explicitly examine these relationships at multiple spatial scales to avoid misleading conclusions [80].
FAQ 5: How can I account for uncertainty when using multiple existing land-use maps to generate training data? When fusing multiple land-use/land-cover (LULC) products to generate training samples, it is crucial to assess their alignment. One method is to use a Reconciliation Index (RI). The RI quantifies the agreement between customized Landsat imagery and the intersection areas of multiple high-quality LULC products. A higher RI for a given land-cover class indicates a more reliable composite image for that class, thereby refining your training samples and reducing uncertainty in the subsequent classification and validation processes [81].
Troubleshooting Common Validation Problems
Problem: Model fails to outperform a Null model of pure persistence.
| Symptom | Potential Cause | Solution |
|---|---|---|
| The agreement between the map of t1 and the observed map of t2 is higher than between your predicted t2 and the observed t2. | The model is not effectively capturing the drivers and processes of land-use change. It may be over-fitted to noise in the calibration data. | Re-evaluate your driving variables. Implement a more rigorous separation of calibration (t0-t1) and validation (t1-t2) periods. Test your model against both a Null model and a Random model to benchmark its performance [79]. |
Problem: Inconsistent or weak correlations between spatial metrics and ecosystem services.
| Symptom | Potential Cause | Solution |
|---|---|---|
| A landscape metric (e.g., for forest fragmentation) shows a strong relationship with an ecosystem service (e.g., water purification) in one area but not in another. | The spatial relationships are scale-dependent. The selected metric or the scale of analysis may not be appropriate for the ecological process governing the service. | Perform a multi-scale analysis. Use geostatistical methods like Factorial Kriging Analysis (FKA) to decompose the spatial variation of ecosystem services into different scale components (e.g., a 12 km local scale and an 83 km regional scale) and analyze relationships at each specific scale [80]. |
| Symptom | Potential Cause | Solution |
|---|---|---|
| The overall accuracy of your predicted land-use map is high, but user's or producer's accuracy for critical classes (e.g., wetlands) is very low. | The validation relying only on "percent correct" masks allocation errors. The model may be systematically misclassifying a rare but important class. | Move beyond single-value accuracy assessments. Use a confusion matrix (also called an error matrix) to budget errors by land class. Calculate Producer's Accuracy (errors of omission) and User's Accuracy (errors of commission) for each class to identify specific weaknesses [81]. |
Experimental Protocols for Key Validation Analyses
Protocol 1: Conducting a Multi-Scale Analysis of Ecosystem Service Relationships
Purpose: To identify the trade-offs and synergies between multiple ecosystem services at different spatial scales. Methodology:
- Quantify Ecosystem Services: Use spatially explicit models (e.g., InVEST, SWAT) to map multiple ES across your study area. Example services include nitrogen purification, phosphorus purification, water yield, and soil retention [80].
- Spatial Sampling: Extract ES values from a sufficient number of randomly located points (e.g., 10,000 points) across the study area [80].
- Factorial Kriging Analysis (FKA):
- Fit a Linear Model of Coregionalization (LMC) to the ES data.
- This model will decompose the total spatial variation of each ES into distinct spatial components, each with a characteristic range (e.g., a 12 km local component and an 83 km regional component) [80].
- Scale-Specific Correlation Analysis: Calculate correlation coefficients between the different ES within each spatial component derived from the FKA. This reveals whether ES relationships are synergistic or trade-offs at each specific scale [80].
- Identify Dominant Factors: Use stepwise multiple regression at each spatial scale to determine the dominant biophysical (e.g., climate, soil) and socio-economic (e.g., land use intensity) factors driving the ES relationships at that scale [80].
Diagram 1: Multi-Scale ES Relationship Analysis Workflow
Protocol 2: Implementing a Rigorous Model Validation Framework
Purpose: To thoroughly assess the predictive performance of a land-use change model against naive baselines and across multiple resolutions. Methodology:
- Temporal Data Split: Secure land-use maps for three time points: t0 (for initial state), t1 (for calibration), and t2 (for validation, must be withheld during calibration) [79].
- Run the Optimization Model: Calibrate your model using only data from t0 and t1. Predict the land-use pattern for time t2 [79].
- Establish Baseline Models:
- Null Model: Assume pure persistence. The prediction for t2 is simply the map from t1.
- Random Model: Generate a random allocation of land-use change based on the observed quantity of change.
- Calculate Multiple Metrics of Agreement: Compare the following maps to the observed map of t2:
- Budget Sources of Error: Analyze the confusion matrix to distinguish between errors in the quantity of change versus errors in the location of change [79].
- Multi-Resolution Analysis: Aggregate the maps to progressively coarser resolutions and repeat the comparison. This reveals the scales at which your model's predictions are most useful [79].
The Scientist's Toolkit: Essential Reagents & Materials
Table 1: Key Data Inputs and Analytical Tools for Validation
| Item Name | Function / Purpose | Key Specifications |
|---|---|---|
| Time-Series Land Use/Land Cover (LULC) Maps | Serves as the fundamental observational data for calibrating and validating land-change models. Requires at least three time points (t0, t1, t2). | Minimum of 3 time points; Resolution appropriate to process (e.g., 30m Landsat, 10m Sentinel); Consistent classification scheme. |
| Spatial Metrics Software (e.g., FRAGSTATS) | Quantifies the spatial pattern of landscape elements, allowing researchers to measure fragmentation, connectivity, and patch structure of predicted vs. observed land use. | Calculates metrics like Patch Density, Edge Density, Mean Patch Size, Contagion; Works with raster data formats. |
Geostatistical Analysis Package (e.g., R gstat, geoR) |
Performs advanced spatial analysis like Factorial Kriging to decompose spatial variance and correlation into multiple scales, critical for understanding scale-dependent ES relationships. | Capable of variogram modeling, kriging, and linear model of coregionalization (LMC). |
| Ecosystem Service Modeling Suite (e.g., InVEST, ARIES) | Generates spatially explicit maps of ecosystem service supply (e.g., water purification, carbon storage, habitat quality) for correlation analysis with land-use patterns. | Module-based; Uses LULC and biophysical data as inputs; Produces raster outputs of ES provision. |
| Confusion Matrix (Error Matrix) | A standard table used to assess the accuracy of a classification by comparing predicted vs. observed data. It is the foundation for calculating key validation metrics. | Calculates Producer's Accuracy, User's Accuracy, Overall Accuracy; Essential for budgeting errors by land class [81]. |
Diagram 2: Validation Framework for Land Use Optimization
Core Methodologies for ESV Assessment and Scenario Simulation
FAQ: What are the established methodologies for quantifying Ecosystem Service Value (ESV)?
Researchers primarily employ the Equivalent Factor Method and biophysical modeling to quantify ESV. The Equivalent Factor Method, pioneered by Costanza and refined by Xie et al. for China's conditions, assigns monetary value coefficients per unit area of different land use types (e.g., forest, cropland, wetland) [82] [29] [83]. These factors are often adjusted using regional parameters like grain yield and the Normalized Difference Vegetation Index (NDVI) to improve accuracy [82]. Biophysical models, such as the InVEST model, use spatial data to simulate and map the provision of services like carbon storage, habitat quality, and water yield [12].
FAQ: How are future land use scenarios developed and simulated?
Future land use patterns under different development pathways are simulated using specialized models. A common approach involves coupling a model for quantitative optimization of land use demand with a model for spatial allocation [6].
- Gray Multi-objective Optimization (GMOP): This model is often used to optimize the quantity of different land use types under multiple constraints and objectives, such as economic growth and ecological protection [6].
- Spatial Simulation Models: Models like the Patch-generating Land Use Simulation (PLUS) model and the Conversion of Land Use and its Effects at small regional extent (CLUE-S) model are then used to allocate these quantitative demands spatially. The PLUS model, which uses a random forest algorithm to mine the drivers of land use change, has been recognized for its high simulation accuracy at the patch level [82] [6] [12].
Troubleshooting Common Analytical Challenges
FAQ: How can we address trade-offs and synergies between different ecosystem services?
Trade-offs (where one service increases at the expense of another) and synergies (where two services increase or decrease together) are central challenges [1]. To manage them:
- Identify Relationships: Use correlation analysis (e.g., Pearson correlation) or statistical models like geographically weighted regression to quantify the relationships between pairs of ecosystem services [1] [12].
- Apply Multi-objective Optimization: Frameworks like the Constrained Multi-objective Optimization of Land use Allocation (CoMOLA) can be used to find land use configurations that balance multiple, often competing, ES objectives [51].
- Define Ecological Security Patterns (ESPs): Based on the assessment of key ecosystem services and their synergies, ESPs can be delineated. These patterns, which include ecological sources and corridors, can then be embedded as "redline" constraints in spatial simulations to prevent the uncontrolled expansion of construction land into critical ecological zones [12].
FAQ: What is the best way to handle mismatches between ecosystem service supply and social demand?
Spatial mismatches occur when the supply of an ES does not align with the areas of high demand, which is common in urban settings [51].
- Spatial Mismatch Analysis: First, map the supply of ES (e.g., heat mitigation from vegetation) and the demand (e.g., population density and surface temperature in urban areas). The mismatch can then be quantified [51].
- Demand-driven Optimization: Use the identified spatial mismatches as direct objectives in land use optimization models. The goal is to re-allocate land use, for example by increasing green space in high-demand areas, to minimize the mismatch and maximize the number of beneficiaries [51].
FAQ: How should we integrate real-world policy constraints into our models?
Ignoring land planning controls is a major disconnection between research and practical management [6].
- Incorporate Spatial Constraints: Key policy zones should be integrated as spatial constraints in models like PLUS or CLUE-S. These typically include:
- Permanent Basic Cropland (PBC): Strictly protected from conversion to construction land.
- Boundaries for Urban Development (BUD): Construction land expansion is largely restricted to within these boundaries.
- Red Lines for Protecting Ecosystems (RLE): Within these zones, conversion to construction land or farmland is prohibited, but conversions between woodland, grassland, and unused land may still occur and should not be completely locked [6].
Essential Research Reagent Solutions
The table below details key data, models, and tools essential for conducting research in this field.
| Research Reagent | Primary Function & Application |
|---|---|
| Land Use/Land Cover Data | The fundamental input for assessing ESV and simulating change. High-resolution (e.g., 30m) data from sources like the Resource and Environmental Science Data Center (RESDC) is critical [6] [51]. |
| PLUS (Patch-generating Land Use Simulation) Model | A sophisticated model for simulating the spatial dynamics of land use change at the patch level, offering high accuracy by mining the contributions of various driving factors [82] [6] [12]. |
| InVEST (Integrated Valuation of Ecosystem Services and Tradeoffs) Model | A suite of biophysical models used to map and quantify the supply of multiple ecosystem services, such as carbon storage, habitat quality, and water yield [12]. |
| Equivalent Factor Table | A value coefficient table that assigns a standard monetary value per unit area to different ecosystem types, providing a standardized method for calculating the total ESV [82] [29] [83]. |
| Geographic Detector Model | A statistical tool used to assess the spatial stratified heterogeneity of ESV and to quantify the explanatory power of various driving factors (e.g., NDVI, population density, soil type) [82] [29]. |
Experimental Protocol: A Standard Workflow for ESV Scenario Analysis
Objective: To quantify and compare the improvements in Ecosystem Service Value under different future land use scenarios. Conceptual Workflow Diagram:
Step-by-Step Protocol:
Data Collection and Preparation: Assemble spatiotemporal data for your study area. This includes a time series of land use/cover data, biophysical data (DEM, soil type, annual precipitation), and socio-economic data (GDP, population density) [82] [12]. All datasets should be unified in projection and resolution.
Historical Baseline Assessment:
Scenario Definition: Establish distinct future development pathways for a target year (e.g., 2030). Typical scenarios include [6] [12]:
- Natural Development (ND): Extends historical trends.
- Rapid Economic Development (RED): Prioritizes expansion of construction land.
- Ecological Land Protection (ELP): Focuses on conserving and expanding forests and grasslands.
- Sustainable Development (SD): A balanced approach that integrates economic and ecological goals.
Land Use Optimization and Simulation:
- Use the GMOP model to generate the optimal quantity structure of land use for each scenario, adhering to constraints like the total land area and policy goals [6].
- Use the PLUS model to spatially allocate the optimized land use quantities. Input the GMOP results as the demand and incorporate spatial constraints like permanent basic cropland and ecological redlines [6].
Future ESV Quantification and Comparison: Calculate the total ESV under each simulated future land use scenario. Compare the outcomes to the baseline and across scenarios to quantify improvements and identify the pathway that best enhances overall ecosystem services or mitigates specific trade-offs [1] [51].
Scenario Analysis Logic and Outputs
Decision Flow for Scenario Comparison Diagram:
Quantitative Data from Scenario Analyses:
Table 1: Exemplary ESV Outcomes from Different Scenario Simulations
| Study Region | Scenario | Key Quantitative Findings (vs. Baseline) | Reference Context |
|---|---|---|---|
| Huaihe River Ecological Economic Belt | Ecological Protection | Highest ESV achieved among all scenarios by 2030. | [82] |
| Ningxia Region | Sustainable Development | Steady, slight increase in total ESV; prevents uncontrolled construction land expansion and mitigates "governance while destruction". | [6] |
| Liaohe River Basin | Ecological-Priority (PEP) | Reduced net forest loss by 63.2% compared to the Economic-Priority scenario (PUD). | [12] |
| Guangdong-Hong Kong-Macao Greater Bay Area | Demand-driven Optimization | Increased beneficiaries of heat mitigation by 15% and recreation by 14%; reduced population exposed to flood risk by 37%. | [51] |
Frequently Asked Questions (FAQs)
1. What are land-use function conflicts, and why are they important in ecosystem services research? Land-use function conflicts (LUFCs) are states of mismatch and disharmony that arise from competition between different land-use methods and benefit forms, such as agricultural production, urban construction, and ecological protection [84]. They are crucial in ecosystem services research because they represent a critical constraint on sustainable land utilization, jeopardizing ecological conservation, environmental governance, and food security [85]. Diagnosing these conflicts is essential for optimizing territorial spatial configurations and balancing the trade-offs between various ecosystem services, such as water yield, sediment conservation, and crop yield [86].
2. What are the primary data sources for identifying and assessing land-use conflicts? The primary data sources include:
- Land Survey Data: High-resolution, authoritative land management data is ideal for accurate identification. The minimum patch size for land survey has been increased to 400 m², making fine-scale data (e.g., below 30 m resolution) crucial for meeting actual land management needs [6].
- Remote Sensing Data: Land use/cover change (LUCC) data derived from remote sensing image interpretation is commonly used, though it may lack the validation and accuracy of official land survey data [6].
- Socioeconomic and Environmental Data: Data on population density, economic indicators, precipitation, nighttime light index, and NDVI (Normalized Difference Vegetation Index) are vital for analyzing driving factors [87] [84].
3. What methods are used to measure the intensity of land-use conflicts? Two prominent methodological frameworks are used, often in combination:
- Landscape Pattern Index (LPI): This method adopts landscape pattern indices from ecological risk models to measure the sources, receptors, and effects of risks. It comprehensively reflects the intensity of LUCs and can accurately locate conflict occurrences [87] [84] [85].
- Comprehensive Evaluation Method / Multi-Criteria Evaluation: This method evaluates and compares various attributes (natural, socioeconomic, policy, and location conditions) at the same spatial location. It has become an effective means of identifying the specific locations, types, and intensities of LUCs [87] [84].
4. How can future land-use conflicts be simulated and predicted? Future conflicts are typically predicted using coupled model frameworks that integrate:
- Land Use Change Simulation Models: Models like the Patch-generating Land Use Simulation (PLUS) model are widely used. The PLUS model uses a random forest algorithm to mine land use change triggers and can simulate patch-level changes across multiple land-use categories [6] [85].
- Scenario Analysis: Researchers develop multiple future scenarios, such as Natural Development (ND), Rapid Economic Development (RED), Ecological Protection (EP), and Sustainable Development (SD), to explore how different development pathways might influence the emergence and intensity of conflicts [86] [87] [6].
5. What is the relationship between ecosystem service value (ESV) and land-use conflicts? There is a strong, inverse relationship. Land-use conflicts often lead to a deterioration of ecological quality and a decrease in ecosystem service value [87] [84]. Therefore, ESV is used as a key metric to assess, compare, and select optimal land-use scenarios. A scenario that minimizes conflict areas often corresponds with a higher total ESV, making the "ecological priority" scenario frequently the most favorable for sustainable development [87] [6].
Troubleshooting Common Experimental Challenges
Challenge 1: Inaccurate Spatial Location of Conflicts
- Problem: The model identifies general areas of conflict but fails to pinpoint precise spatial locations.
- Solution: Ensure you are using the highest-resolution land use data available. Incorporate a "conflict risk–ecological benefit" assessment, which superimposes conflict risk zones with areas of declining ecological benefit to accurately locate conflicts with adverse effects [87]. Additionally, verify that spatial driving factors (e.g., distance to roads, elevation, slope) are correctly calibrated in your model.
Challenge 2: Model Fails to Capture Patch-Level Dynamics
- Problem: Simulated land-use changes appear too uniform and do not reflect the fragmented, patchy nature of real-world landscapes.
- Solution: Utilize the PLUS model, which is specifically designed to address this limitation. It incorporates a random seed generation and a threshold-decreasing mechanism to simulate the patch-level evolution of multiple land use types simultaneously, leading to more realistic spatial patterns [6] [85].
Challenge 3: Optimization Solution is Not Robust Across Multiple Future Scenarios
- Problem: A land-use pattern optimized for a single future scenario performs poorly under other plausible scenarios, increasing systemic risk.
- Solution: Move beyond single-scenario optimization. Use multi-scenario simulations to identify highly adaptive land-use patterns that can meet a broader spectrum of ecosystem service demands (e.g., water yield, crop yield, sediment conservation) across different socioeconomic and climate futures [86].
Challenge 4: Results are Disconnected from Real-World Land Management Policies
- Problem: The research findings and optimized layouts are not adopted by planners because they ignore existing land-use controls.
- Solution: Integrate spatial policy constraints directly into your optimization and simulation models. Key constraints include Permanent Basic Cropland (PBC), the Red Lines for protecting Ecosystems (RLE), and Boundaries for Urban Development (BUD) as defined in local Territorial Spatial Plans [6].
Key Experimental Protocols and Data
Protocol 1: Land-Use Conflict Identification Based on "Conflict Risk–Ecological Benefit"
This protocol provides a holistic method for identifying conflicts that have tangible ecological consequences [87].
- Calculate the Conflict Risk Index (CRI): Use a landscape pattern index method. Select indices from dimensions of landscape complexity, vulnerability, and stability (e.g., fragmentation, isolation, dominance) to construct a comprehensive CRI.
- Calculate the Ecosystem Service Value (ESV): Use a modified equivalence factor method per unit area to assign values to different land-use types. Sum the values to get a total ESV for the study area.
- Identify Conflict Zones: Superimpose the CRI and ESV maps over two time periods (e.g., T1 and T2). Areas where conflict risk has increased and ecological benefit has decreased from T1 to T2 are identified as genuine land-use conflict zones.
- Classify Conflict Intensity: Classify the identified conflict zones into different levels (e.g., weak, low, intense) based on the magnitude of the CRI change and ESV loss.
Protocol 2: Multi-Scenario Land Use Optimization and Conflict Simulation
This protocol is used to forecast future conflicts and test mitigation strategies under different development pathways [86] [6].
- Scenario Definition: Define at least three development scenarios:
- Natural Development (ND): Projects historical trends forward.
- Rapid Economic Development (RED): Prioritizes economic growth and urban expansion.
- Ecological Priority (EP): Emphasizes ecological conservation and restoration.
- Land Demand Projection: Use a system dynamic (SD) or Gray Multi-objective Optimization (GMOP) model to calculate the future quantitative demand for each land-use type under each scenario.
- Spatial Allocation: Employ the PLUS model to spatially allocate the future land demands. Input land use data, driving factors, and territorial spatial planning constraints (PBC, RLE, BUD) into the PLUS model to generate future land-use maps for 2030 for each scenario.
- Conflict and ESV Estimation: Apply the conflict identification method from Protocol 1 to the simulated future land-use maps. Simultaneously, calculate the ESV for each scenario to evaluate ecological outcomes.
Diagram Title: Land-Use Conflict Diagnosis Workflow
Quantitative Data from Case Studies
Table 1: Conflict Area Proportions under Different Future Scenarios in Hechi City [87]
| Scenario | Year | Total Conflict Area (% of Total) | High-Level Conflict Area (% of Total) |
|---|---|---|---|
| Ecological Priority | 2025 | 5.39% | 2.17% |
| Ecological Priority | 2030 | 7.92% | 1.12% |
| Economic Lead | 2030 | Not Specified | 2.94% |
Table 2: Future Ecosystem Service Demands in the Yanhe Watershed (2020-2050) [86]
| Demand Type | 2020 Baseline | 2050 Projected Range | Percentage Increase |
|---|---|---|---|
| Crop Demand | 141.3 million kg | 196.3 - 208.1 million kg | > 39% |
| Water Demand | 65.8 million m³ | 87.4 - 122.5 million m³ | > 32% |
The Scientist's Toolkit: Essential Research Reagents & Models
Table 3: Key Tools and Models for Land-Use Conflict Research
| Tool/Model Name | Type | Primary Function | Key Reference |
|---|---|---|---|
| PLUS Model | Software Model | Simulates patch-level land use changes across multiple scenarios; uses random forest to extract development probabilities. | [6] [85] |
| InVEST Suite | Software Model | Models and maps the delivery, distribution, and economic value of ecosystem services under alternative scenarios. | [88] |
| Gray Multi-objective Optimization (GMOP) | Mathematical Model | Optimizes future land use quantities by solving for multiple objectives under uncertainty and multiple constraints. | [6] |
| Landscape Pattern Indices | Analytical Metric | Quantifies landscape structure (fragmentation, shape, connectivity) to assess spatial stability and conflict risk. | [87] [84] [85] |
| Geographical Detector | Statistical Tool | Identifies driving factors of spatial patterns and assesses the interaction power between two factors. | [84] |
Troubleshooting Guide: Frequently Asked Questions
FAQ 1: How can I accurately isolate the policy impact of Ecological Redlines from other influencing factors?
- Challenge: Ecological changes result from multiple intertwined factors, making it difficult to attribute outcomes solely to the Ecological Redline Policy.
- Solution: Employ the Propensity Score Matching (PSM) model to control for selection bias and non-random policy implementation. This method creates a statistically valid control group by matching treated areas (within redlines) with untreated areas (outside redlines) that have similar ecological backgrounds and historical trends [89]. This controls for pre-existing differences, such as the fact that protected areas are often established in ecologically sensitive regions with limited development potential, allowing for a more accurate measurement of the policy's true effect [89]. Studies using PSM have found that comparisons between subregions can underestimate policy effectiveness because they fail to account for these underlying differences [89].
FAQ 2: My land use simulation model does not effectively handle vector-format policy boundaries. What should I do?
- Challenge: Many traditional cellular automata (CA) models or CLUE-S can only process policy factors in raster format, limiting their ability to incorporate spatial boundaries from vector-based planning documents [62].
- Solution: Use the Patch-generating Land Use Simulation (PLUS) model. The PLUS model integrates a Land Expansion Analysis Strategy (LEAS) and a multi-class random patch seeds (CARS) module to improve simulation accuracy. It is specifically designed to handle area-based and patch-oriented spatial planning policies in vector format, making it superior for policy-sensitive evaluations [62] [89].
FAQ 3: How do I quantitatively assess the impact of spatial policies on habitat connectivity, not just land cover?
- Challenge: Land use simulations show spatial patterns but may not reveal changes in ecological connectivity and network integrity.
- Solution: Integrate land use simulation outputs with Ecological Network (EN) analysis using the Minimum Cumulative Resistance (MCR) model and circuit theory [62]. This "source-corridor-node" paradigm allows you to:
- Construct ecological networks from simulated future land use maps.
- Quantify changes in landscape connectivity metrics (e.g., probability of connectivity, corridor connectivity).
- Identify priority areas for conservation and corridor restoration by comparing different policy scenarios [62].
FAQ 4: How can I model future land use and ecosystem impacts under different development scenarios?
- Challenge: Forecasting future land use patterns and their ecological consequences is complex and uncertain.
- Solution: Implement multi-scenario simulation using integrated modeling frameworks. A standard workflow includes [62] [12]:
- Define Scenarios: Typical scenarios include Natural Development, Economic Priority, Ecological Priority, and Historical Trend [62] [12].
- Simulate Land Use: Use the PLUS model to simulate future land use under each scenario, with Ecological Redlines or other spatial constraints as inputs [62] [89].
- Evaluate Ecosystem Impacts: Feed the simulated land use maps into ecosystem assessment models like InVEST to quantify changes in habitat quality, carbon storage, or other services [90] [12] [89].
FAQ 5: What is the most effective way to communicate complex policy impacts to decision-makers?
- Challenge: Technical results on ecosystem services and connectivity are not easily translatable into policy actions.
- Solution:
- Utilize Ecosystem Service Bundles: Apply unsupervised classification algorithms like self-organizing maps (SOM) to identify distinct "ecosystem service bundles" [12]. This groups areas with similar service profiles, simplifying complex data into actionable management zones (e.g., "Comprehensive Service Function Zone", "Agricultural Development Priority Zone") for targeted policy [12].
- Adopt a "Production-Living-Ecological Space" (PLES) Framework: Analyze land use transformation through the PLES lens, which aggregates land into primary functional types. This aligns with spatial planning concepts and helps illustrate trade-offs, such as how the expansion of production and living spaces can compress ecological space and degrade ecosystem service value [29].
Experimental Protocols and Methodologies
Table 1: Core Models for Policy Impact Evaluation
| Model/Tool Name | Primary Function | Key Application in Redline Evaluation | Technical Note |
|---|---|---|---|
| PLUS Model(Patch-generating Land Use Simulation) | High-accuracy, multi-scenario land use simulation [62]. | Projects future land use patterns with/without redline policy constraints [62] [89]. | Superior to CA-Markov and FLUS for handling vector-format policy boundaries [62]. |
| InVEST Model(Integrated Valuation of Ecosystem Services and Tradeoffs) | Spatially explicit ecosystem service quantification [90] [12]. | Evaluates policy impacts on habitat quality, carbon storage, water yield, etc. [90] [12] [89]. | Requires local biophysical and land use data for calibration [12]. |
| MCR Model & Circuit Theory(Minimum Cumulative Resistance) | Ecological network construction and connectivity analysis [62]. | Assesses how redlines impact ecological corridors and landscape connectivity [62]. | Follows a "source-corridor-node" paradigm [62]. |
| Propensity Score Matching (PSM) | Statistical method to reduce selection bias in non-experimental data [89]. | Isolates the causal effect of the redline policy by creating matched treatment and control groups [89]. | Crucial for accurate impact attribution; controls for pre-existing regional differences [89]. |
Table 2: Key Ecosystem Services and Assessment Methods
| Ecosystem Service | Metric/Model | Data Inputs Required | Relevance to Redline Policy |
|---|---|---|---|
| Habitat Quality | InVEST Habitat Quality Module [90] | Land use/cover, threat sources (e.g., built-up areas, roads), threat sensitivity [90]. | Directly measures policy effectiveness in reducing habitat degradation from human activities [90]. |
| Carbon Storage | InVEST Carbon Storage Module [89] | Land use/cover, carbon pool data (above/biomass, soil, dead organic matter) [89]. | Evaluates contribution of redlines to climate mitigation goals [89]. |
| Water-Related Services | InVEST Seasonal Water Yield, Nutrient Delivery Ratio [11] | Land use, precipitation, soil depth, topography [11]. | Critical for delineating and evaluating redlines in watershed protection [11]. |
| Soil Retention | InVEST Sediment Delivery Ratio [12] | Land use, rainfall erosivity, soil erodibility, topography [12]. | Assesses effectiveness in controlling erosion, especially in fragile regions [12]. |
Detailed Protocol: Evaluating ERL Impact via Land Use and Ecological Network Analysis
This protocol assesses how Ecological Redlines (ERLs) shape future land use and the structure of ecological networks [62].
Multi-Scenario Land Use Simulation with the PLUS Model
- Objective: Project land use patterns under different ERL policy scenarios.
- Steps:
- Data Preparation: Collect historical land use maps (e.g., 2005, 2015), driver data (topography, climate, proximity to roads/centers), and the ERL boundary in vector format [62].
- Scenario Definition:
- Natural Development Scenario (NDS): Project trends without ERL constraints.
- Ecological Protection Scenario (EPS): Enforce ERLs as areas where conversion to construction land is prohibited [62].
- Model Calibration & Simulation:
- Use the LEAS module to analyze land expansion drivers.
- Use the CARS module to simulate patch-level changes.
- Calibrate model parameters (e.g., patch generation threshold, expansion coefficient) by simulating a past year and validating against actual data [62].
- Output: High-accuracy land use maps for 2030/2050 under each scenario.
Ecological Network (EN) Construction and Analysis
- Objective: Quantify the impact of simulated land use on ecological connectivity.
- Steps:
- Identify Ecological Sources: Select core habitat patches from the simulated land use maps, typically large areas of forest, grassland, or water [62] [12].
- Build Resistance Surfaces: Assign a cost value to each land use type for species movement (low for natural areas, high for built-up areas) [62].
- Extract Corridors and Nodes:
- Quantify EN Connectivity: Calculate landscape metrics (e.g., Probability of Connectivity, Corridor Connectivity) for each scenario [62].
Impact Evaluation
- Objective: Determine the effectiveness of different ERL policies.
- Analysis: Compare the structure, connectivity, and components (patches, corridors, barriers) of the ENs derived from the different land use scenarios. The scenario that maintains a more interconnected and robust network demonstrates higher ecological effectiveness [62].
Model Integration Workflow for ERL Policy Evaluation
The Scientist's Toolkit: Essential Research Reagents and Solutions
Table 3: Key Research Reagent Solutions for Spatial Policy Evaluation
| Research "Reagent" | Function/Description | Example Application in Thesis |
|---|---|---|
| Land Use/Cover Data | The foundational spatial dataset representing earth's surface. | Used as primary input for land use change analysis, ecosystem service modeling, and ecological network construction [62] [12] [29]. |
| Ecological Redline (ERL) Boundaries | The vector polygon dataset delineating protected spatial zones. | Served as a key constraint in PLUS model scenarios to simulate land use under policy intervention [62] [89]. |
| Socio-Economic Driving Factors | Data on population, GDP, night-time lights, and infrastructure. | Used as explanatory variables in the LEAS module of the PLUS model to understand and simulate urban expansion [62] [89]. |
| Carbon Pool Data | Tables containing carbon density values for different land use types (above/belowground, soil, dead matter). | A critical input for the InVEST Carbon Storage model to estimate sequestration impacts of land use policies [89]. |
| Threat Data and Sensitivity Tables | Raster layers of anthropogenic threats (urban, roads) and tables defining each habitat's sensitivity. | Required by the InVEST Habitat Quality model to calculate levels of degradation and habitat quality [90]. |
Logical Flow of Research Components
Conclusion
The optimization of land use for multiple ecosystem services represents a critical frontier in sustainable development. This synthesis demonstrates that integrated modeling frameworks, which couple ecosystem service evaluation with spatial simulation, provide powerful tools for actionable insights. Success hinges on explicitly managing trade-offs, incorporating robust policy constraints, and utilizing high-fidelity data. Future efforts must focus on enhancing model interoperability, deepening the integration of ecological security patterns into spatial planning, and developing dynamic frameworks that can adapt to climate change and evolving socio-economic conditions. For researchers and practitioners, this approach provides a scientifically-grounded pathway to achieve the dual goals of ecological integrity and human well-being.
References
- 1. Land use optimization based on ecosystem service ... [https://www.sciencedirect.com/science/article/abs/pii/S0264837717312590]
- 2. Land-use/land-cover change and ecosystem service ... [https://www.sciencedirect.com/science/article/abs/pii/S0048969716315248]
- 3. Impacts of land use and land cover change on ecosystem ... [https://www.sciencedirect.com/science/article/pii/S2405844022035344]
- 4. Ecosystem services scenario simulation in Guangzhou ... [https://www.nature.com/articles/s41598-025-98248-w]
- 5. Projecting LUCC dynamics and ecosystem services in an ... [https://www.sciencedirect.com/science/article/abs/pii/S0048969724052501]
- 6. Multi-Scenario Land Use Optimization Simulation and ... [https://www.mdpi.com/2073-445X/13/4/557]
- 7. Effect of Land Use and Land Cover Change on Ecosystem ... [https://www.mdpi.com/2071-1050/17/1/167]
- 8. The contributions of climate and land use/cover changes to ... [https://pmc.ncbi.nlm.nih.gov/articles/PMC10550635/]
- 9. Investigating the spatio-temporal interactive relationship ... [https://www.sciencedirect.com/science/article/pii/S1470160X23014577]
- 10. Spatial Relationship between Land Use Patterns and ... [https://www.mdpi.com/2073-445X/11/8/1168]
- 11. Optimization of land use structure integrating ecosystem ... [https://www.sciencedirect.com/science/article/pii/S266597272500025X]
- 12. Multi-scenario simulation of land use optimization based ... [https://www.frontiersin.org/journals/environmental-science/articles/10.3389/fenvs.2025.1647039/full]
- 13. Ecosystem Service Values - BASIN Field Manual [https://docs.basin.global/appendix/selected-value-types-and-valuation-methods/ecosystem-service-values]
- 14. A novel unit value method for urban ecosystem services ... [https://pmc.ncbi.nlm.nih.gov/articles/PMC12094765/]
- 15. Spatial–temporal evolution of ESV and its response to land ... [https://www.nature.com/articles/s41598-022-17464-w]
- 16. The co-evolution and driving mechanism analysis of ... [https://www.nature.com/articles/s41598-025-00601-6]
- 17. National Ecosystem Services Classification System Plus [https://www.epa.gov/eco-research/national-ecosystem-services-classification-system-plus-frequently-asked-questions]
- 18. National Ecosystem Services Classification System ... [https://www.epa.gov/eco-research/national-ecosystem-services-classification-system-nescs-plus]
- 19. Evaluating conceptual definitions of ecosystem services ... [https://www.sciencedirect.com/science/article/abs/pii/S0921800915300549]
- 20. Use a Troubleshooting Methodology for More Efficient IT ... [https://www.comptia.org/en-us/blog/use-a-troubleshooting-methodology-for-more-efficient-it-support/]
- 21. Questions and Answers on Current Good Manufacturing ... [https://www.fda.gov/drugs/guidances-drugs/questions-and-answers-current-good-manufacturing-practice-regulations-production-and-process]
- 22. I can not start Invest - Software Support [https://community.naturalcapitalproject.org/t/i-can-not-start-invest/1040]
- 23. Getting Started — InVEST® documentation - Googleapis.com [https://storage.googleapis.com/releases.naturalcapitalproject.org/invest-userguide/latest/en/getting_started.html]
- 24. Coupling PLUS–InVEST Model for Ecosystem Service - ProQuest [https://www.proquest.com/scholarly-journals/coupling-plus-invest-model-ecosystem-service/docview/2761213290/se-2]
- 25. A Coupled InVEST-PLUS Model for the [https://www.proquest.com/docview/3046958656/8B2D5B9262C74715PQ/4]
- 26. Tutorial A User Manual of The PLUS Model 20250501 [https://www.scribd.com/document/885230758/Tutorial-A-User-Manual-of-the-PLUS-model-20250501]
- 27. A Multi-Objective Optimization and Evaluation Framework ... [https://www.mdpi.com/2079-8954/13/12/1053]
- 28. A tutorial on multiobjective optimization: fundamentals and ... [https://pmc.ncbi.nlm.nih.gov/articles/PMC6105305/]
- 29. Research on the synergistic evolution of land use ... [https://www.nature.com/articles/s41598-025-12657-5]
- 30. Multi-objective optimization framework for enhancing ... [https://www.sciencedirect.com/science/article/abs/pii/S019689042500603X]
- 31. Understanding the drivers of sustainable land expansion ... [https://www.sciencedirect.com/science/article/abs/pii/S0198971520303021]
- 32. Dynamic simulation of land use and land cover and its ... [https://www.frontiersin.org/journals/ecology-and-evolution/articles/10.3389/fevo.2023.1102015/full]
- 33. Spatiotemporal simulation of sustainable development ... [https://pubmed.ncbi.nlm.nih.gov/39903707/]
- 34. PSOLA: A Heuristic Land-Use Allocation Model Using Patch ... [https://pmc.ncbi.nlm.nih.gov/articles/PMC4913917/]
- 35. Modeling future land use and land cover under different ... [https://www.frontiersin.org/journals/environmental-science/articles/10.3389/fenvs.2024.1362666/full]
- 36. HPSCIL/Patch-generating_Land_Use_Simulation_Model [https://github.com/HPSCIL/Patch-generating_Land_Use_Simulation_Model]
- 37. Forecasting Urban Land Use Dynamics Through Patch ... [https://www.mdpi.com/2071-1050/16/23/10255]
- 38. Scenario Planning: A Tool for Climate-Informed Decision ... [https://www.fisheries.noaa.gov/national/climate/scenario-planning-tool-climate-informed-decision-making]
- 39. Scenario Planning for Managing Ecosystem Services and ... [https://edis.ifas.ufl.edu/publication/FR465]
- 40. Building scenarios for ecosystem services tools [https://www.sciencedirect.com/science/article/pii/S0016328715001639]
- 41. Optimization of Land Use Structure Integrating Ecosystem ... [https://papers.ssrn.com/sol3/papers.cfm?abstract_id=4928227]
- 42. Optimization of Land Use Structure Integrating Ecosystem ... [https://papers.ssrn.com/sol3/papers.cfm?abstract_id=4988156]
- 43. Spatiotemporal characteristics and socio-ecological drivers ... [https://www.sciencedirect.com/science/article/pii/S1470160X24011919]
- 44. Ecosystem Service Values in the Dongting Lake Eco ... [https://pmc.ncbi.nlm.nih.gov/articles/PMC8910509/]
- 45. Ecosystem Service Values in the Dongting Lake Eco ... [https://www.mdpi.com/1660-4601/19/5/3121]
- 46. Urban land use optimization prediction considering carbon ... [https://cbmjournal.biomedcentral.com/articles/10.1186/s13021-024-00285-x]
- 47. Carbon sequestration and water yield tradeoffs following ... [https://www.sciencedirect.com/science/article/pii/S0013935121015048]
- 48. Spatiotemporal Dynamics and Trade-Off Analysis of ... [https://www.mdpi.com/2073-4395/15/7/1707]
- 49. Study on spatio-temporal evolution of ecosystem services ... [https://www.frontiersin.org/journals/environmental-science/articles/10.3389/fenvs.2024.1445833/full]
- 50. Modeling the spatially heterogeneous relationships ... [https://www.sciencedirect.com/science/article/abs/pii/S0048969722059332]
- 51. Matching Ecosystem Services Supply and Demand through ... [https://pmc.ncbi.nlm.nih.gov/articles/PMC7967713/]
- 52. Integrating trade-offs and supply-demand into ecosystem ... [https://www.nature.com/articles/s41598-025-11536-3]
- 53. Integrating ecosystem services, stakeholders' perspective ... [https://link.springer.com/article/10.1007/s10980-024-01886-0]
- 54. Land use optimization research based on FLUS model and ... [https://www.sciencedirect.com/science/article/pii/S2212095521002145]
- 55. Water-carbon-structure cascade effect nonlinearly impacts ... [https://www.nature.com/articles/s43247-025-02885-y]
- 56. Comparing Robust Decision-Making and Dynamic ... [https://www.sciencedirect.com/science/article/pii/S1364815216307186]
- 57. How Assess Sensitivity to Attribute Uncertainty works [https://pro.arcgis.com/en/pro-app/latest/tool-reference/spatial-statistics/how-assess-sensitivity-to-attribute-uncertainty-works.htm]
- 58. Assess Sensitivity to Attribute Uncertainty (Spatial Statistics) [https://pro.arcgis.com/en/pro-app/latest/tool-reference/spatial-statistics/assess-sensitivity-to-attribute-uncertainty.htm]
- 59. Optimal Modeling of Sustainable Land Use Planning under ... [https://www.mdpi.com/2073-445X/12/5/1099]
- 60. Exploring the Balance Between Ecosystem Services and ... [https://www.mdpi.com/2073-445X/14/5/920]
- 61. Ensemble Algorithms - MATLAB & Simulink [https://www.mathworks.com/help/stats/ensemble-algorithms.html]
- 62. Evaluating ecological redline policies: Integrating multi ... [https://www.sciencedirect.com/science/article/abs/pii/S0304380025003436]
- 63. Developing China's Ecological Redline Policy using ... [https://www.nature.com/articles/s41467-018-05306-1]
- 64. Farmland Protection [https://www.planning.org/knowledgebase/farmlandprotection/]
- 65. Land Cover Mapping Using High-Resolution Satellite ... [https://www.mdpi.com/2072-4292/17/15/2591]
- 66. Generating high-resolution land use and land cover maps ... [https://www.nature.com/articles/s41597-024-03750-x]
- 67. Challenges in data-driven geospatial modeling for ... [https://www.nature.com/articles/s41467-024-55240-8]
- 68. The Role of LiDAR in High Precision Surveying ... [https://www.lja.com/news/the-role-of-lidar-in-high-precision-surveying-for-informed-land-development/]
- 69. Balancing Competing Objectives in Multi-Objective Optimization [https://nag.com/insights/balancing-competing-objectives-in-multi-objective-optimization/]
- 70. Spatial optimization of land use and carbon storage ... [https://www.sciencedirect.com/science/article/abs/pii/S2210670724007443]
- 71. Progress in regulating ecosystem services research [https://www.nature.com/articles/s40494-025-01674-2]
- 72. Dynamic Land Use and Socioeconomic-Environmental ... [https://www.frontiersin.org/research-topics/71869/dynamic-land-use-and-socioeconomic-environmental-interaction-patterns-bridging-sustainability-and-developmentundefined]
- 73. Optimization of Spatial Pattern of Land Use - PubMed Central [https://pmc.ncbi.nlm.nih.gov/articles/PMC9142005/]
- 74. A study on land use change simulation based on PLUS ... [https://www.sciencedirect.com/science/article/pii/S1470160X25005497]
- 75. Multi-Scenario Simulation of Land Use Change and ... [https://www.mdpi.com/2071-1050/16/14/6237]
- 76. Prediction of land use for the next 30 years using the PLUS ... [https://www.nature.com/articles/s41598-024-64014-7]
- 77. Errors in the CA-Markov prediction map output [https://forums.clarklabs.org/hc/en-us/community/posts/21567265443091-Errors-in-the-CA-Markov-prediction-map-output]
- 78. A Comparative Study of Various Land Use and Land Cover Change... [https://pmc.ncbi.nlm.nih.gov/articles/PMC9779269/]
- 79. Useful techniques of validation for spatially explicit land ... [https://www.sciencedirect.com/science/article/abs/pii/S0304380004002716]
- 80. Spatial multi-scale relationships of ecosystem services [https://www.nature.com/articles/s41598-017-09863-1]
- 81. An inclusive classification optimization model for land use ... [https://www.nature.com/articles/s41598-025-91260-0]
- 82. Study on dynamic changes in land use and ecosystem ... [https://www.frontiersin.org/journals/environmental-science/articles/10.3389/fenvs.2025.1617829/full]
- 83. Spatio-temporal evolution and trend prediction of urban ... [https://pmc.ncbi.nlm.nih.gov/articles/PMC10562314/]
- 84. Concept and Method of Land Use Conflict Identification ... [https://www.mdpi.com/2071-1050/16/24/11177]
- 85. Multi-scenario simulation of land use spatial conflicts [https://link.springer.com/article/10.1007/s10668-025-06329-7]
- 86. Land use optimization for future ecosystem service demands [https://www.sciencedirect.com/science/article/pii/S0959652625014714]
- 87. Identifying the Optimal Scenario for Reducing Land-Use ... [https://www.mdpi.com/2073-445X/13/12/2234]
- 88. Frequently Asked Questions - Stanford Natural Capital Project [https://naturalcapitalproject.stanford.edu/software/invest/support/frequently-asked-questions]
- 89. Evaluation of Effectiveness and Multi-Scenario Analysis ... [https://www.mdpi.com/2073-445X/13/11/1918]
- 90. Assessing the effectiveness of Ecological Conservation ... [https://www.sciencedirect.com/science/article/pii/S1470160X23008841]