Integrating Analytic Hierarchy Process (AHP) for Robust Ecosystem Services Assessment: A Framework for Researchers and Drug Development
This article provides a comprehensive guide to applying the Analytic Hierarchy Process (AHP) in ecosystem services (ES) assessment, tailored for researchers and drug development professionals.
Integrating Analytic Hierarchy Process (AHP) for Robust Ecosystem Services Assessment: A Framework for Researchers and Drug Development
Abstract
This article provides a comprehensive guide to applying the Analytic Hierarchy Process (AHP) in ecosystem services (ES) assessment, tailored for researchers and drug development professionals. It explores the foundational principles of AHP as a Multi-Criteria Decision Analysis (MCDA) tool and its unique value in structuring complex environmental and biomedical valuation problems. The content details a step-by-step methodological framework—from constructing a decision hierarchy and performing pairwise comparisons using Saaty's scale to calculating weights and ensuring consistency. It further addresses common challenges like inconsistency management and stakeholder integration, supported by real-world case studies from recent research. Finally, the article examines validation strategies, including the critical comparison of model outputs with stakeholder perceptions, and discusses the profound implications of these integrated assessments for sustainable decision-making in biomedical research and environmental health.
Understanding AHP and Its Critical Role in Ecosystem Services Valuation
The Analytic Hierarchy Process (AHP) is a structured, multi-criteria decision-making (MCDM) methodology that combines mathematics and psychology to help decision-makers organize and analyze complex problems [1] [2]. Developed by Professor Thomas L. Saaty in the 1970s, AHP provides a comprehensive framework for dealing with complex decisions involving multiple criteria, stakeholders, and both quantitative and qualitative factors [3] [4]. Its ability to incorporate human judgment while maintaining mathematical rigor has made it particularly valuable in fields requiring structured assessment approaches, including ecosystem services research where diverse criteria must be evaluated systematically [5] [6].
AHP decomposes a complex decision problem into a hierarchical structure, facilitates comparative judgments through pairwise comparisons, and synthesizes priorities to provide a rational basis for decision-making [2]. This systematic approach is especially beneficial in environmental and ecosystem services assessment, where decision-makers must often balance ecological, economic, and social factors with varying degrees of importance and uncertainty [5].
Historical Development and Theoretical Foundations
Origins and Key Innovators
The Analytic Hierarchy Process emerged from the work of Thomas L. Saaty at the Wharton School of the University of Pennsylvania during the 1970s [4]. Saaty sought to create a decision-making method that integrated mathematical rigor with human psychology, resulting in a practical tool that non-experts could apply in real-world settings [3]. The earliest publication on AHP dates to 1972, with a more comprehensive description appearing in the Journal of Mathematical Psychology in 1977 [2].
In 1983, Saaty partnered with Ernest Forman to develop Expert Choice, one of the first software implementations of AHP, making the methodology more accessible to practitioners [1] [2]. Since its introduction, AHP has been extensively studied, refined, and applied across numerous disciplines, establishing itself as one of the most widely used multi-criteria decision-making methods globally [2].
Influences and Predecessors
AHP drew inspiration from several earlier psychological and decision-making concepts. The use of pairwise comparisons, fundamental to AHP, was previously employed by psychologists such as Thurstone (1927) and Yokoyama (1921) [2]. The hierarchical formulation of criteria was first proposed in Miller's 1966 doctoral dissertation and applied in subsequent publications [2]. The distinctive 1-9 ratio scale used in AHP is grounded in psychological observations related to human ability to make distinctions between stimuli, building on Fechner's work in psychophysics [2].
Core Principles and Methodology
The Hierarchical Structure
The foundation of AHP is the decomposition of complex problems into hierarchical structures. This breakdown progresses from the overall goal at the top level, through criteria and sub-criteria at intermediate levels, to alternatives at the bottom [1] [2]. In ecosystem services research, this hierarchical approach enables researchers to systematically analyze relationships between various environmental factors and services [5].
Pairwise Comparisons and Saaty's Scale
AHP uses pairwise comparisons to evaluate the relative importance of elements at each hierarchy level. Decision-makers compare elements two at a time, using Saaty's fundamental 1-9 scale of relative importance [4]. This scale translates subjective judgments into quantitative values, allowing for mathematical processing of preferences [3].
Table 1: Saaty's Fundamental Scale of Relative Importance
| Intensity of Importance | Definition | Explanation |
|---|---|---|
| 1 | Equal importance | Two activities contribute equally to the objective |
| 3 | Moderate importance | Experience and judgment slightly favor one activity over another |
| 5 | Strong importance | Experience and judgment strongly favor one activity over another |
| 7 | Very strong importance | An activity is favored very strongly over another |
| 9 | Extreme importance | The evidence favoring one activity over another is of the highest possible order of affirmation |
| 2, 4, 6, 8 | Intermediate values | Used when compromise is needed |
The pairwise comparisons are organized into a reciprocal matrix where if element A is rated 3 compared to element B, then element B is automatically 1/3 compared to element A [3]. This matrix forms the mathematical basis for deriving priority weights.
Mathematical Framework and Consistency
The mathematical foundation of AHP involves calculating the principal eigenvector of the pairwise comparison matrix to derive priority weights [3] [4]. This eigenvector represents the relative priorities of the compared elements. A crucial step in AHP is verifying the consistency of judgments through the Consistency Ratio (CR) [4] [2].
The consistency ratio measures how consistent the pairwise comparisons are relative to large samples of random comparisons. A CR ≤ 0.10 is generally considered acceptable, while higher values may indicate inconsistent judgments that should be reviewed [4] [2]. This mathematical check on logical consistency is one of AHP's distinctive features, providing a validity measure for the decision-making process.
Experimental Protocols and Application Notes
Standard AHP Implementation Protocol
Protocol Title: Standard AHP Implementation for Multi-Criteria Decision Analysis
Purpose: To provide a structured methodology for applying AHP to complex decision problems, particularly suited for ecosystem services assessment where multiple quantitative and qualitative criteria must be evaluated.
Materials and Equipment:
- Decision hierarchy template
- Pairwise comparison questionnaires
- Calculation software (Expert Choice, TransparentChoice, or computational tools like MATLAB/R)
- Consistency validation tools
Procedure:
Problem Structuring
- Define the decision goal clearly and precisely
- Identify all relevant criteria and sub-criteria through literature review and stakeholder consultation
- Identify all potential alternatives for evaluation
- Construct a hierarchical model with the goal at the top, criteria/sub-criteria at intermediate levels, and alternatives at the bottom [1] [2]
Data Collection through Pairwise Comparisons
- For each set of elements (criteria, sub-criteria, alternatives) under a common parent node, develop pairwise comparison matrices
- Use Saaty's 1-9 scale to rate the relative importance/performance of each pair [4]
- For group decisions, collect judgments from all relevant stakeholders independently
Priority Derivation
Synthesis of Global Priorities
- Multiply local priorities through the hierarchy to obtain global priorities for alternatives [2]
- Sum global priorities for each alternative to obtain overall scores
Sensitivity Analysis
- Test robustness of results by varying weights of key criteria
- Identify which criteria have the most influence on the overall ranking [2]
Validation and Quality Control:
- Ensure all relevant stakeholders are represented in comparisons
- Verify logical consistency through consistency ratios
- Document all judgments and calculations for transparency
Specialized Protocol: Ecosystem Services Assessment Using AHP
Protocol Title: AHP for Integrated Ecosystem Services Assessment and Valuation
Purpose: To adapt AHP specifically for evaluating and prioritizing ecosystem services, incorporating both scientific data and stakeholder perceptions, as demonstrated in recent environmental research [5] [6].
Materials and Equipment:
- Spatial data on ecosystem services (if available)
- Stakeholder mapping tools
- AHP software with spatial integration capabilities
- GIS software for mapping results (optional)
Procedure:
Ecosystem Services Selection
- Identify relevant ecosystem services based on ecological context and stakeholder input
- Categorize services into provisioning, regulating, cultural, and supporting services
- Define measurable indicators for each service [5]
Stakeholder Identification and Engagement
- Map all relevant stakeholder groups (local communities, government agencies, experts, NGOs)
- Develop appropriate engagement strategies for each group
- Design AHP questionnaires tailored to different stakeholder knowledge levels [5]
Hierarchy Construction for ES Assessment
- Structure hierarchy with ecosystem conservation/management at the goal level
- Organize ecosystem services as criteria and sub-criteria
- Include management alternatives or conservation scenarios at the lowest level [6]
Weight Elicitation
Integration with Biophysical Data
Spatial Prioritization (if applicable)
- Map AHP results spatially to identify priority areas for conservation/management
- Identify trade-offs and synergies between different ecosystem services [5]
Validation and Quality Control:
- Compare AHP results with other valuation methods (e.g., Choice Experiments) [6]
- Assess robustness through sensitivity analysis on key criteria weights
- Validate results with stakeholder feedback sessions
Application in Ecosystem Services Research
Case Study: National Ecosystem Services Assessment in Portugal
A recent 2024 study published in Scientific Reports demonstrates AHP's application in ecosystem services assessment at a national scale [5]. Researchers developed the ASEBIO index (Assessment of Ecosystem Services and Biodiversity) to depict combined ES potential based on CORINE Land Cover data, using AHP with weights defined by stakeholders [5].
Table 2: Ecosystem Services Indicators and Stakeholder Weights from Portuguese Case Study
| Ecosystem Service Indicator | Relative Weight | Key Findings |
|---|---|---|
| Water purification | Highest contributor | Consistently showed high potential throughout 1990-2018 period |
| Recreation | Major contributor | Doubled its potential between 1990-2000 |
| Habitat quality | Medium contributor | Showed twice the potential compared to climate regulation, drought regulation |
| Climate regulation | Lowest contributor | Declined significantly from 1990 to 2018 |
| Drought regulation | Medium contributor | Showed largest improvement, especially in central and southern regions |
| Erosion prevention | Low contributor | Very low potential in 1990 but improved over time |
The study revealed a significant mismatch between ES potential perceived by stakeholders and model outputs, with stakeholder estimates being 32.8% higher on average [5]. This highlights the importance of integrating both scientific modeling and stakeholder perspectives in environmental decision-making.
Case Study: Water Ecosystem Services in Peru
Another application in the Tilacancha River Microbasin in northern Peru used AHP to prioritize attributes of water ecosystem services [6]. Researchers compared AHP with Choice Experiments (CE) to understand stakeholder preferences for WES attributes.
The AHP process identified Quality Maintenance and Water Regulation as the highest priority attributes, while Sediment Control and Water Yield were less valued [6]. This prioritization helped guide water security management decisions in the region.
The Researcher's Toolkit: Essential Materials and Reagents
Table 3: Essential Research Tools for AHP Applications in Ecosystem Services
| Tool Category | Specific Tools/Software | Function/Purpose | Application Context |
|---|---|---|---|
| Specialized AHP Software | Expert Choice [4] [2] | Comprehensive AHP implementation with sensitivity analysis | Full-scale AHP projects requiring detailed analysis |
| TransparentChoice [3] | Web-based AHP for collaborative decision making | Group decisions and stakeholder engagement | |
| Prioritization Helper [4] | Salesforce-integrated AHP tool | Organizational decision support systems | |
| Computational Tools | MATLAB, R, Python | Custom AHP implementation and analysis | Research requiring customized algorithms or integration with other models |
| Data Collection Tools | Structured questionnaires | Pairwise comparison data collection | Fieldwork with stakeholders |
| Online survey platforms | Remote data collection from distributed stakeholders | Large-scale or geographically dispersed stakeholder engagement | |
| Supplementary Analysis Tools | GIS software | Spatial representation of AHP results | Ecosystem services mapping and spatial prioritization |
| Statistical packages | Consistency checking and data validation | Robustness verification and data quality control |
Methodological Variations and Advanced Approaches
Fuzzy AHP (FAHP)
Fuzzy AHP incorporates fuzzy set theory to handle uncertainty and imprecision in human judgments [3] [2]. This extension allows stakeholders to express preference judgments as ranges rather than fixed numerical values, making it particularly valuable for complex environmental decisions where precise quantification is challenging.
Analytic Network Process (ANP)
ANP is a generalization of AHP that handles interdependencies and feedback between criteria and alternatives through a network structure rather than a strict hierarchy [3] [2]. This is especially relevant for ecosystem services assessment, where complex interdependencies often exist between different ecological components.
Hybrid Approaches
AHP is frequently combined with other decision-making methods, including:
- AHP with other MCDM methods (TOPSIS, VIKOR, PROMETHEE) to enhance ranking under constraints [3]
- AHP with Entropy Method (AHP-EM) to correct judgment weights using objective data [1]
- AHP with Choice Experiments to compare revealed and stated preferences [6]
Workflow Visualization
Application Notes on ES Categorization and Valuation
Core Categorization Frameworks
Ecosystem Services (ES) are the direct and indirect benefits that ecosystems provide to humans [7]. The Millennium Ecosystem Assessment (MA) established a foundational classification system that organizes these benefits into four primary categories, as detailed in Table 1 [8].
Table 1: Core Categories of Ecosystem Services as Defined by the Millennium Ecosystem Assessment
| Category | Description | Examples |
|---|---|---|
| Provisioning Services | Material or energy outputs from an ecosystem [7]. | Food, forage, fiber, fresh water, natural gas, oils, and medicinal resources [8] [7]. |
| Regulating Services | Benefits obtained from the moderation or control of ecosystem processes [7]. | Pollination, decomposition, water purification, erosion and flood control, and carbon storage and climate regulation [8]. |
| Cultural Services | Non-material benefits that contribute to cultural and social development [7]. | Recreational opportunities, tourism, aesthetic appreciation, cultural heritage, and spiritual enrichment [8]. |
| Supporting Services | Fundamental ecosystem processes necessary for the production of all other ES [8]. | Photosynthesis, nutrient cycling, soil formation, and the water cycle [8]. |
A critical advancement in ES classification is the distinction between final and intermediate ecosystem services [9]. Final Ecosystem Services (FES) are the components of nature that flow directly to and are directly used or appreciated by humans, such as water in a stream used for kayaking [9]. Conversely, Intermediate Ecosystem Services are input-output relationships within the ecosystem that support FES but do not directly benefit people; examples include plant transpiration and cloud formation, which are part of the causal chain leading to precipitation [9]. This distinction is vital for avoiding double-counting in environmental accounting and for identifying metrics that are most relevant to human well-being [9].
Key Valuation Challenges
Placing an economic value on ecosystem services is fraught with methodological and conceptual difficulties, primarily because many ES are public goods—they are non-excludable and non-rivalrous—and lack direct market prices [10]. The primary challenges are summarized in Table 2.
Table 2: Primary Challenges in the Economic Valuation of Ecosystem Services
| Challenge Category | Specific Limitations | Impact on Valuation |
|---|---|---|
| Non-Market Nature | Absence of direct market prices and transactions for services like air purification [10]. | Prevents the use of standard market-based valuation techniques; values must be inferred indirectly. |
| Methodological Limitations | Revealed Preference methods (e.g., Travel Cost) are limited to use values and can be data-intensive [10]. Stated Preference methods (e.g., Contingent Valuation) are susceptible to hypothetical bias and framing effects [10]. | Struggles to capture non-use values (e.g., existence value); results may not reflect real-world economic behavior. |
| System Complexity | High interdependence of services; context-dependent value (e.g., flood protection is more valuable in a populated city) [10]. | Makes it difficult to isolate and value individual services without undervaluing others or causing double-counting. |
| Scale and Uncertainty | Services operate from local to global scales; future service flows are subject to change from climate and land-use change [10]. | Complicates aggregation of values and introduces significant uncertainty into long-term valuations. |
Experimental Protocols for ES Assessment
Integrated Workflow for ES Assessment and AHP Prioritization
For research framed within an Analytical Hierarchy Process (AHP) methodology, an integrated evaluation approach is effective. The following workflow, Fig. 1, outlines the protocol for moving from initial scoping to prioritized design strategies and can be adapted for urban planning or restoration projects [11].
Fig. 1: ES Assessment and AHP Prioritization Workflow.
Protocol 2.1.1: Scoping and Final Ecosystem Services (FES) Identification
- Objective: To identify relevant stakeholders, beneficiaries, and the Final Ecosystem Goods and Services (FEGS) for assessment.
- Procedure:
- Utilize the FEGS Scoping Tool, a structured decision-making tool from the EPA, to identify and prioritize stakeholders and the environmental attributes they value [9].
- Define the system boundary (e.g., a specific urban zone, wetland, or forest area).
- Create a comprehensive list of FES relevant to the decision context, using classification systems like NESCS Plus to ensure consistency and avoid double-counting [9].
Protocol 2.1.2: ES Accounting and Field Measurement
- Objective: To quantify the biophysical supply of key ecosystem services identified in the previous step.
- Procedure:
- Select Metrics: Choose appropriate biophysical metrics for each FES. For example, in a tidal flat assessment, "food provision" can be measured by the biomass of harvestable species, and "water quality regulation" by nutrient removal capacity [12].
- Field Data Collection: Collect necessary ecological data. This may involve:
- Biodiversity Surveys: Species richness and abundance surveys for flora and fauna.
- Soil and Water Sampling: Analyzing parameters like nutrient levels, suspended solids, and carbon content.
- Habitat Mapping: Using GIS and remote sensing to quantify land cover and habitat types.
- Quantification: Use models from resources like the EcoService Models Library (ESML) to translate raw data into ES supply metrics [9]. The state of each service can be scored against a reference condition (e.g., a pristine natural site) to normalize data, as demonstrated in the Coastal Ecosystem Index (CEI) methodology [12].
Protocol 2.1.3: AHP Model Implementation for Priority Setting
- Objective: To determine the relative importance of different ecosystem services and prioritize landscape design or management strategies [11].
- Procedure:
- Construct Hierarchy: Build an AHP model with the goal at the top (e.g., "Optimal Urban Landscape Design"), the relevant ecosystem service categories and/or metrics as the middle-level criteria, and the specific design or management strategies as the alternatives at the bottom [11].
- Expert Elicitation: Conduct surveys with experts and stakeholders to perform pairwise comparisons of all elements at each level of the hierarchy. Participants judge, on a standardized scale (e.g., 1-9), how much more important one element is than another with respect to the element above it [11].
- Calculate Weights & Validate:
- Compute the priority weights for each criterion and alternative using eigenvector calculations.
- Calculate a Consistency Ratio (CR) to ensure that the pairwise comparisons are logically consistent. A CR value of less than 0.10 is generally acceptable.
- Synthesize Results: Aggregate the weights across the hierarchy to determine the overall priority score for each design alternative. The strategy with the highest score is the most preferred based on the integrated evaluation of ecosystem service delivery [11].
Protocol for Quantitative Evaluation of ES: The Coastal Ecosystem Index (CEI)
For focused research on coastal ecosystems, the CEI method provides a quantifiable approach [12].
Protocol 2.2.1: Establish Reference Points and Calculate Service Scores
- Objective: To develop a composite index that reflects the overall health and service provision capacity of a coastal ecosystem.
- Procedure:
- Define Services & Factors: Identify a suite of services (e.g., food provision, coastal protection, recreation, biodiversity) and create a conceptual model linking each service to its key environmental factors [12].
- Set Reference Points: Select a natural, well-functioning reference site (e.g., a natural tidal flat) within the same biogeographic region. The state of the service at this reference site sets the target, often scored as 100 [12].
- Score Services: For each service at the assessment site, calculate a score (0-100) based on its state relative to the reference point. The formula for a simple linear scaling is:
Service Score = (Current State Value / Reference Point Value) * 100[12]. - Calculate Trend: Assess the trend of each service over a recent period (e.g., the past 5 years) to account for sustainability, scoring it from -1 (declining) to +1 (improving) [12].
- Compute Composite Index: The overall CEI score is a weighted average of the individual service scores, potentially incorporating the trend score to reflect future trajectory:
CEI = Σ (Service Weight * Service Score * (1 + Trend Score))[12].
The Scientist's Toolkit: Research Reagent Solutions
Table 3: Essential Tools and Frameworks for Ecosystem Services Research
| Tool / Framework Name | Type | Function in ES Research |
|---|---|---|
| Analytical Hierarchy Process (AHP) | Methodological Tool | A multi-criteria decision-making method used to prioritize ecosystem services or landscape strategies based on expert and stakeholder input [11]. |
| NESCS Plus (National Ecosystem Services Classification System Plus) | Classification Framework | An EPA-developed system that provides a common language and structure for defining and grouping Final Ecosystem Services, crucial for avoiding double-counting [9]. |
| FEGS Scoping Tool | Decision Support Tool | An EPA tool that uses structured decision-making to identify stakeholders, beneficiaries, and the environmental attributes most relevant to a specific project [9]. |
| EcoService Models Library (ESML) | Model Repository | An online database for finding, examining, and comparing ecological models that can be used to quantify ecosystem goods and services [9]. |
| EnviroAtlas | Geospatial Tool | An interactive web-based tool from the EPA that provides maps, data, and other resources on ecosystem services for informed decision-making [9]. |
| Coastal Ecosystem Index (CEI) | Quantitative Method | A method for scoring and quantifying ecosystem services in coastal areas, enabling comparison against a reference condition and tracking changes over time [12]. |
Visualization of ES Causal Chains
A fundamental concept in ES assessment is understanding the causal pathway from an ecological structure to a human benefit. The following diagram, Fig. 2, illustrates this chain, highlighting the critical distinction between intermediate and final services [9].
Fig. 2: Causal Chain from Ecology to Human Benefit.
The integration of the Ecosystem Services (ES) concept into environmental policy and management necessitates robust decision-support tools that can handle multiple, often competing, criteria. Multi-Criteria Decision Analysis (MCDA) offers a structured framework for such complex evaluations. Within the MCDA toolkit, the Analytical Hierarchy Process (AHP) emerges as a particularly powerful method for ES assessment. This application note details the theoretical underpinnings, a standardized operational protocol, and a real-world case study demonstrating AHP's efficacy in prioritizing ES. By providing a step-by-step methodology and associated research tools, this guide aims to equip researchers and environmental professionals with the means to deploy AHP for transparent, consistent, and stakeholder-informed ecosystem service valuations.
Ecosystem Services (ES), defined as the direct and indirect contributions of ecosystems to human well-being, provide a critical framework for understanding human-nature interdependencies [13]. The Millennium Ecosystem Assessment and subsequent classifications, such as the Common International Classification of Ecosystem Services (CICES), have cemented the importance of ES in scientific research and policy agendas [14]. However, integrating this concept into practical environmental management requires methods to assess and weigh often competing services, such as timber production versus recreational value or climate regulation versus biodiversity.
Multi-Criteria Decision Analysis (MCDA) is a systematic approach designed to evaluate complex decision-making scenarios involving multiple, conflicting objectives [13]. The Analytical Hierarchy Process (AHP), developed by Thomas Saaty, is a prominent MCDA technique that breaks down a complex problem into a hierarchical structure, enabling decision-makers to use pairwise comparisons to derive priority scales for criteria and alternatives [4]. Its convergence with ES assessment is powerful: AHP provides the structured, quantitative methodology needed to navigate the intangible and interconnected nature of ecosystem services, transforming qualitative stakeholder judgments into a defensible ranking of management or policy options.
Theoretical Foundations: AHP and ES Compatibility
The synergy between AHP and ES assessment stems from their shared capacity to handle complexity and subjectivity.
- Structuring Complex Systems: The ES concept encompasses a wide array of services, from provisioning (e.g., food, water) to regulating (e.g., climate, floods) and cultural (e.g., recreation, aesthetics) [14]. AHP's fundamental principle is to deconstruct such a complex problem—"Which alternative provides the optimal ES supply?"—into a manageable hierarchy of goal, criteria (the ES), sub-criteria, and alternatives [4]. This structure brings clarity to the assessment process.
- Incorporating Intangible Values: Many ES, particularly cultural and regulating services, are not easily quantified in monetary terms. AHP is uniquely capable of integrating both quantitative data and qualitative, subjective judgments through its pairwise comparison mechanism [13]. This allows for the inclusion of stakeholder preferences on abstract services, which is often critical for holistic and socially accepted environmental management.
- Addressing Interdependencies and Bias: A known challenge in ES assessment is the potential for double-counting, particularly when intermediate and final services are not clearly distinguished [13]. AHP's structured hierarchy, if carefully designed using a classification system like CICES, can help mitigate this. Furthermore, research has shown that while AHP is susceptible to overestimating more abstract services (like cultural ES) due to its hierarchical simplification, its built-in Consistency Ratio provides a check on the reliability of the subjective judgments entered [15]. For studies requiring even higher accuracy and accounting for strong interdependencies between criteria, the Analytic Network Process (ANP) is recommended, though it is more time-consuming [15].
Application Protocol: A Step-by-Step Guide for ES Assessment
This protocol outlines the standardized methodology for applying AHP to an ES assessment, from problem scoping to result interpretation. An overview of the workflow is provided in Figure 1.
Figure 1: AHP Workflow for Ecosystem Services Assessment. The diagram outlines the sequential stages, from problem definition to result reporting, including key sub-processes for hierarchy construction, pairwise comparison, and mathematical validation.
#3.1 Phase 1: Problem Structuring and Hierarchy Development
- Define the Goal: Clearly articulate the primary objective of the assessment (e.g., "Prioritize Ecosystem Services in a protected wetland" or "Select the optimal forest restoration strategy").
- Identify Criteria and Sub-Criteria: Select the relevant ecosystem services that serve as the criteria for evaluating the alternatives. It is good practice to use a standardized ES classification system (e.g., CICES) to ensure comprehensiveness and avoid double-counting [13]. For instance, a hierarchy might include:
- Criterion 1: Provisioning Services (e.g., Timber Production, Water Supply)
- Criterion 2: Regulating & Maintenance Services (e.g., Climate Change Mitigation, Flood Protection)
- Criterion 3: Cultural Services (e.g., Recreational Attractiveness)
- Define Alternatives: List the different scenarios, management options, or geographical areas that are being evaluated (e.g., "Baseline (no action)," "Selective Thinning," "Thinning from Below") [14].
- Construct Pairwise Comparison Matrices: For each level of the hierarchy, develop matrices to compare all elements against each other with respect to their parent element above.
- Utilize Saaty's Scale: Stakeholders or experts judge the relative importance of one element over another using the standard 1-9 scale, where 1 indicates equal importance and 9 indicates extreme importance of one over the other [4]. This is performed for all ES criteria relative to the goal, and then for all alternatives relative to each ES criterion. Software tools like Expert Choice or Prioritization Helper can streamline this process [4].
#3.3 Phase 3: Computation and Validation
- Calculate Priority Weights: For each comparison matrix, compute the normalized principal eigenvector. This vector provides the priority weights (relative importance) of the criteria or the performance scores of the alternatives [4].
- Check Consistency: Calculate the Consistency Index (CI) and Consistency Ratio (CR). A CR value of less than 0.10 (or 10%) is generally considered acceptable [4]. A higher CR indicates inconsistent judgments (e.g., if A is preferred to B, B to C, but C is preferred to A), and the comparisons should be reviewed.
#3.4 Phase 4: Synthesis and Sensitivity Analysis
- Synthesize Results: Aggregate the local priorities across all levels of the hierarchy using a weighted-sum model to obtain global priority scores for each alternative [4]. The alternative with the highest final score is typically the most preferred.
- Perform Sensitivity Analysis: Test the robustness of the ranking by varying the criteria weights. This reveals how sensitive the final outcome is to changes in stakeholder preferences and identifies which criteria are the key drivers of the decision [4].
Case Study: AHP for Forest Restoration in Central Italy
A 2021 study in the Annals of Forest Science provides a clear example of AHP applied to evaluate the impact of forest restoration strategies on ES supply [14].
- Goal: Identify the optimal forest restoration practice to improve ES supply in the degraded Monte Morello forest in Central Italy.
- Criteria (ES): Three key ecosystem services were assessed:
- Wood Production: Quantified by harvested wood volume and local market prices.
- Climate Change Mitigation: Quantified by changes in carbon stock and sequestration in biomass and soil.
- Recreational Opportunities: Assessed via face-to-face questionnaire surveys with 200 visitors to evaluate the impact of thinning on scenic beauty and recreational attractiveness.
- Alternatives (Scenarios):
- Baseline: No active restoration.
- Selective Thinning: Removal of trees to improve stand structure.
- Thinning from Below: Removal of smaller, suppressed trees.
The quantitative data collected for the alternatives across the three ES criteria is summarized in Table 1.
Table 1: Quantified Ecosystem Service Performance for Three Forest Management Scenarios [14].
| Ecosystem Service | Metric Used | Baseline Scenario | Selective Thinning Scenario | Thinning from Below Scenario |
|---|---|---|---|---|
| Wood Production | Wood Volume / Economic Value | Low / Low | High / High | Medium / Medium |
| Climate Change Mitigation | C-Stock & C-Sequestration | Medium | Slight decrease post-harvest, but long-term increase | Slight decrease post-harvest, but long-term increase |
| Recreational Opportunities | Visitor Preference Score | Low | High | Medium |
The AHP analysis, which involved weighting the importance of the three ES and synthesizing the performance data, yielded a clear ranking of the alternatives. The Selective Thinning scenario was identified as the optimal strategy, as it best balanced the objectives of enhancing recreational attractiveness and wood production, with acceptable impacts on climate regulation [14]. This outcome provides a scientifically-grounded and transparent decision-support tool for forest managers and policymakers.
The Researcher's Toolkit for AHP in ES Assessment
Successful implementation of AHP in ES research relies on a combination of conceptual frameworks, software tools, and methodological checks. Table 2 outlines essential "research reagents" for this field.
Table 2: Essential Tools and Frameworks for AHP-based ES Research.
| Tool / Solution | Type | Function & Application in AHP-ES Research |
|---|---|---|
| CICES Framework | Conceptual | Provides a standardized classification system for ecosystem services, minimizing double-counting and ensuring a comprehensive criteria set [13]. |
| Saaty's Fundamental 1-9 Scale | Methodological | The core of AHP, enabling the quantification of subjective preferences during pairwise comparisons of ES and alternatives [4]. |
| Consistency Ratio (CR) | Analytical / QC | A key metric to validate the logical consistency of expert/stakeholder judgments; a CR < 0.1 is required for reliable results [4]. |
| Expert Choice Software | Software | A dedicated commercial software platform that automates AHP calculations, consistency checks, and sensitivity analysis [4]. |
| Stakeholder Workshops | Protocol | A structured forum for eliciting the pairwise comparisons and preference judgments that form the primary data input for the AHP model [13]. |
| Sensitivity Analysis Module | Analytical | An integral part of AHP software (or scripts) used to test the robustness of the final ranking against changes in ES weights [4]. |
The Analytical Hierarchy Process offers a robust, flexible, and transparent methodology that powerfully converges with the needs of modern ecosystem services assessment. Its capacity to structure complex environmental decisions, incorporate both tangible and intangible values, and provide a mathematically-validated ranking of alternatives makes it an indispensable tool in the researcher's toolkit. By adhering to the detailed protocols and leveraging the essential tools outlined in this application note, scientists and environmental professionals can enhance the rigor, credibility, and practical utility of their work in valuing and managing our natural capital.
The Analytic Hierarchy Process (AHP) is a structured, multi-criteria decision-making (MCDA) technique that supports complex decision-making by organizing and analyzing decisions in a hierarchical structure [4] [1]. Developed by Thomas Saaty in the 1970s, AHP has evolved into a widely recognized methodology for integrating both qualitative and quantitative factors in decision problems [4]. In the context of ecosystem services (ES) assessment, AHP provides a robust framework for evaluating trade-offs between competing management objectives, such as balancing timber production with biodiversity conservation or weighing carbon sequestration against recreational value [16] [13] [17]. The power of AHP lies in its ability to break down complex environmental problems into manageable components, quantify subjective judgments through pairwise comparisons, and synthesize diverse stakeholder perspectives into a coherent decision-making framework [18] [19].
For researchers and practitioners working in environmental management and ecosystem services assessment, AHP offers particular value through its capacity to integrate diverse forms of knowledge, reconcile conflicting stakeholder priorities, and create transparent, defensible decision processes [19] [13]. The method has been successfully applied across various environmental domains, including forest management [16] [19] [17], water resource planning [13], and landscape-level conservation strategy [16]. Its structured approach helps overcome common challenges in ES assessment, such as dealing with multiple spatial and temporal scales, incorporating both ecological and socio-economic criteria, and addressing the inherent uncertainties in ecosystem valuation [13] [17].
Core Terminologies and Their Definitions
Decision Hierarchies
A decision hierarchy is a fundamental component of the AHP methodology, representing a stratified system that decomposes a complex decision problem into increasingly specific levels of elements [4] [1]. In AHP, hierarchies are structured with the overall goal or objective at the apex, followed by successive levels of criteria, sub-criteria, and finally the decision alternatives at the base [4] [20]. This hierarchical organization enables decision-makers to focus on discrete components of the problem while maintaining awareness of their relationships to the whole system [1].
In ecosystem services assessment, a typical decision hierarchy might be structured across four primary levels:
- Level 1: Overall Goal - The primary objective of the decision process (e.g., "Optimize ecosystem service provision in a forest landscape")
- Level 2: Criteria - The main categories of ecosystem services under consideration (e.g., provisioning services, regulating services, cultural services)
- Level 3: Sub-criteria - Specific ecosystem services within each category (e.g., under regulating services: carbon sequestration, water purification, erosion control)
- Level 4: Alternatives - The different management options or scenarios being evaluated [13] [17]
The hierarchical approach is particularly valuable in ES assessment as it allows researchers to explicitly represent the multi-dimensional nature of environmental decisions, capture relationships between different types of ecosystem services, and provide a transparent structure for stakeholder engagement [18] [13].
Criteria
In AHP, criteria represent the factors, attributes, or standards against which alternatives are evaluated with respect to the overall goal [4] [1]. Criteria form the intermediate levels between the overarching goal and the specific alternatives in the decision hierarchy [20]. In ecosystem services assessment, criteria typically correspond to different categories of ecosystem services or specific services themselves, though they may also include socioeconomic considerations that complement purely ecological valuations [13].
Ecosystem services criteria in AHP applications commonly include:
- Provisioning Services: Criteria related to material outputs from ecosystems (e.g., wood production, water supply, non-timber forest products) [17]
- Regulating Services: Criteria concerning benefits obtained from ecosystem processes (e.g., climate regulation, flood protection, erosion control) [13]
- Cultural Services: Criteria encompassing non-material benefits (e.g., recreational opportunities, aesthetic value, cultural heritage) [13]
- Supporting Services: Criteria necessary for producing other ecosystem services (e.g., soil formation, nutrient cycling) though these require careful handling to avoid double-counting [13]
The selection of appropriate criteria is a critical step in AHP applied to ES assessment, as it establishes the value framework for subsequent evaluation. Best practices recommend using established ES classification systems like CICES (Common International Classification of Ecosystem Services) to ensure comprehensive coverage while avoiding double-counting of intermediate and final services [13].
Alternatives
Alternatives in AHP represent the various choices, options, or courses of action available to the decision-maker [4] [1]. In the context of ecosystem services assessment, alternatives typically correspond to different management scenarios, policy options, or spatial allocations of land use that could be implemented to achieve the stated goal [16] [17].
Examples of alternatives in ES assessment include:
- Different forest management strategies (e.g., even-aged management, uneven-aged management, conservation-oriented management) [16]
- Various land-use planning scenarios (e.g., different spatial configurations of protected areas, sustainable harvesting zones, and recreational areas) [17]
- Distinct policy interventions (e.g., payment for ecosystem service schemes, regulatory approaches, community-based management) [19]
- Multiple landscape-level planning scenarios, each maximizing different ecosystem services (e.g., timber production scenario, carbon sequestration scenario, biodiversity conservation scenario) [16]
The development of meaningful alternatives requires careful consideration of feasibility, stakeholder interests, and biophysical constraints. In participatory ES assessment, alternatives are often developed through collaborative processes that engage diverse stakeholders to ensure the options reflect multiple perspectives and value systems [18] [17].
Table 1: Summary of Key AHP Terminologies in Ecosystem Services Assessment
| Terminology | Definition | Example in ES Assessment | Considerations for ES Context |
|---|---|---|---|
| Decision Hierarchy | A multi-level structure that decomposes a complex decision from goal to alternatives [4] [1] | Goal: Sustainable forest management → Criteria: ES categories → Sub-criteria: Specific ES → Alternatives: Management scenarios | Should reflect ecosystem service classification systems; avoid double-counting of intermediate and final services [13] |
| Criteria | Factors or standards used to evaluate alternatives with respect to the goal [4] [20] | Categories of ecosystem services (provisioning, regulating, cultural); specific services (timber production, carbon storage) | Use established ES classifications (e.g., CICES); may include complementary socioeconomic criteria [13] [17] |
| Alternatives | Different choices, options, or courses of action available [4] [1] | Management scenarios (conservation, production); policy options; spatial allocations of land use | Should be feasible, cover a range of stakeholder interests, represent distinct trade-offs [16] [17] |
Experimental Protocol for AHP in Ecosystem Services Assessment
Problem Structuring and Hierarchy Development
The initial phase of AHP involves structuring the decision problem and developing the hierarchical model that will guide the entire assessment process.
Table 2: Protocol for Problem Structuring and Hierarchy Development
| Step | Procedure | Details & Considerations | ES-Specific Applications |
|---|---|---|---|
| 1. Define Goal | Formulate clear, specific decision goal | Conduct stakeholder analysis; define temporal and spatial scope | Goals should reflect ES trade-offs (e.g., "balance timber production with biodiversity conservation") [17] |
| 2. Identify Criteria | Select relevant ES criteria and sub-criteria | Use standardized ES classifications (e.g., CICES); avoid double-counting | Include provisioning, regulating, cultural services; consider adding socioeconomic criteria [13] |
| 3. Specify Alternatives | Develop realistic management scenarios | Ensure alternatives are mutually exclusive, collectively exhaustive | Develop alternatives that represent different ES prioritizations (e.g., max timber, max biodiversity, balanced) [16] |
| 4. Construct Hierarchy | Organize elements into hierarchical levels | Goal at top, criteria/sub-criteria in middle, alternatives at bottom | Typically 3-4 levels; can incorporate spatial considerations for landscape-level planning [17] |
The core analytical phase of AHP involves systematic pairwise comparisons to derive weights for criteria and scores for alternatives.
Protocol:
- Develop Comparison Matrices: For each level of the hierarchy, create pairwise comparison matrices where decision elements are compared two at a time with respect to their parent element [4] [20].
- Apply Judgment Scale: Use Saaty's fundamental scale of absolute judgments (1-9) to quantify the relative importance or preference between elements [4]:
- 1: Equal importance
- 3: Moderate importance
- 5: Strong importance
- 7: Very strong importance
- 9: Extreme importance
- 2,4,6,8: Intermediate values
- Elicit Stakeholder Judgments: Engage relevant stakeholders (experts, community representatives, policymakers) to provide pairwise comparison judgments [18] [19]. This can be done through workshops, surveys, or interviews.
- Calculate Priority Vectors: For each comparison matrix, compute the eigenvector (priority vector) that represents the relative weights of the elements [4]. This is typically done using the eigenvalue method.
- Check Consistency: Calculate the consistency ratio (CR) to ensure that the pairwise comparisons are logically coherent [4]. A CR value of ≤0.10 is generally considered acceptable; if higher, the comparisons should be revisited.
Table 3: Saaty's Fundamental Scale for Pairwise Comparisons [4]
| Intensity of Importance | Definition | Explanation | ES Application Example |
|---|---|---|---|
| 1 | Equal importance | Two activities contribute equally to the objective | Carbon storage and water purification equally important for climate regulation |
| 3 | Moderate importance | Experience and judgment slightly favor one activity over another | Timber production moderately more important than recreational value for local economy |
| 5 | Strong importance | Experience and judgment strongly favor one activity over another | Biodiversity conservation strongly more important than aesthetic values in protected area |
| 7 | Very strong importance | An activity is favored very strongly over another; its dominance demonstrated in practice | Flood protection very strongly more important than non-timber forest products in riparian zone |
| 9 | Extreme importance | The evidence favoring one activity over another is of the highest possible order of affirmation | Endangered species habitat extremely more important than any other service in critical habitat |
| 2,4,6,8 | Intermediate values | Used to compromise between two judgments | When compromise is needed between adjacent scales |
Synthesis and Results Analysis
The final phase involves synthesizing the local priorities into global priorities for the alternatives and analyzing the results.
Protocol:
- Aggregate Local Priorities: Combine the priority vectors from all levels of the hierarchy using a weighted-sum model to calculate global priorities for each alternative [4]. This involves multiplying the criteria weights by the alternative scores and summing the products.
- Rank Alternatives: Sort the alternatives based on their global priorities, with higher values indicating better alignment with the overall goal and stakeholder preferences [1].
- Conduct Sensitivity Analysis: Test the robustness of the results by examining how changes in criteria weights affect the ranking of alternatives [13]. This is particularly important in ES assessment where stakeholder values may be uncertain or contested.
- Interpret and Report Results: Present the findings in a format accessible to decision-makers, highlighting key trade-offs, dominant alternatives, and critical sensitivity points [19] [17].
Visualization of AHP Methodology in Ecosystem Services Assessment
The following diagram illustrates the structured workflow of the AHP methodology as applied to ecosystem services assessment:
AHP Workflow for Ecosystem Services Assessment
Table 4: Research Reagent Solutions for AHP in Ecosystem Services Assessment
| Tool Category | Specific Tools/Software | Function in AHP for ES Assessment | Application Notes |
|---|---|---|---|
| AHP Software | Expert Choice [4] | Commercial software for AHP implementation; provides user interface for hierarchy construction, pairwise comparisons, and results analysis | Suitable for complex ES assessments with multiple stakeholders; automates consistency checks and sensitivity analysis |
| Prioritization Helper [4] | Cloud-based AHP application integrated with Salesforce platform | Useful for organizational ES assessments where decision tracking and collaboration are important | |
| Multi-criteria Analysis Tools | Criterium Decision Plus (CDP) [16] | Software for multi-criteria decision analysis that implements AHP among other methods | Used in forest management planning to combine AHP with other MCDA approaches [16] |
| Excel with AHP templates [19] | Spreadsheet-based implementation of AHP calculations | Accessible option for researchers; requires manual setup but offers flexibility | |
| Stakeholder Engagement Methods | Delphi method [17] | Structured communication technique for eliciting and refining group judgments | Used in ES assessment to build consensus among experts on criteria weights and alternative evaluation |
| Participatory workshops [18] [19] | Facilitated group sessions for hierarchy development and pairwise comparisons | Effective for incorporating local knowledge and values in ES assessment; enhances legitimacy of results | |
| ES Classification Frameworks | CICES (Common International Classification of Ecosystem Services) [13] | Standardized framework for defining and categorizing ecosystem services | Helps ensure comprehensive coverage of ES criteria and avoids double-counting in hierarchy development |
| MEA (Millennium Ecosystem Assessment) categories [13] | Provisioning, regulating, cultural, and supporting services classification | Widely recognized framework useful for communicating with diverse stakeholders |
Application Notes from Recent Ecosystem Services Case Studies
Forest Management in Turkey
A recent study in Turkey demonstrated the application of AHP for prioritizing ecosystem services in forest management planning [17]. Researchers engaged multiple stakeholders to weight seven different ecosystem services, resulting in the following priority order: wood production (0.2536) > biodiversity conservation (0.2012) > soil protection (0.1339) > water production (0.1272) > carbon storage (0.1196) > recreation (0.0935) > national defense function (0.0711) [17]. The study highlighted how AHP can effectively integrate scientific data with stakeholder preferences to guide the allocation of forest stands to different management priorities. The resulting ecosystem service suitability maps provided valuable spatial decision support for forest management planning, demonstrating the practical utility of AHP in real-world environmental management contexts [17].
Landscape-Level Planning in Portugal
In a Portuguese case study, AHP was integrated with optimization models to rank landscape-level forest management scenarios based on stakeholder preferences and ecosystem service performance [16]. Five scenarios were developed, each maximizing a different ecosystem service (timber production, carbon sequestration, wildfire resistance, biodiversity conservation, and erosion control). Stakeholder preferences elicited through AHP surveys significantly influenced scenario rankings, with the timber production scenario ranked highest under stakeholder-weighted evaluations, while the wildfire resistance scenario emerged as top-ranked under equal weighting conditions [16]. This hybrid approach demonstrates how AHP can complement biophysical modeling in complex environmental decision contexts, providing a mechanism to incorporate social preferences into technically-driven planning processes.
Participatory Environmental Management
The flexibility of AHP makes it particularly valuable for participatory decision-making in natural resource management [18]. By providing a structured framework for eliciting and quantifying subjective judgments, AHP enables the inclusion of diverse stakeholder perspectives in environmental decisions. Different hierarchy creation techniques and judgment elicitation approaches allow adaptation to various decision-making contexts, from expert-driven technical assessments to community-based participatory processes [18]. This adaptability is crucial in ecosystem services assessment, where both scientific rigor and social legitimacy are important for effective implementation of management decisions [19].
Application Note: Integrating AHP for Rural Landscape Quality Assessment
Background and Rationale
The assessment of rural landscape quality has emerged as a critical dimension in the pursuit of sustainable rural development and long-term resilience of rural territories. Rural landscapes represent multifaceted entities that intertwine natural ecosystems, cultural heritage, and socio-economic functions, requiring integrative assessment approaches that transcend traditional sectoral analyses. Within this context, the Analytic Hierarchy Process (AHP) provides a systematic methodology for quantifying and weighting diverse landscape features through structured hierarchical evaluations based on expert judgment [21].
Case Study: Pingpan Village Assessment
A recent study demonstrated the application of AHP within a symbiotic framework to assess rural landscape quality in Pingpan Village, Fujian Province, China [21]. The research employed symbiosis theory as a foundational framework, emphasizing interdependent and co-evolutionary relationships among ecological, cultural, and functional elements. This approach enabled researchers to construct a comprehensive assessment index system encompassing symbiotic units, environment, interfaces, and models.
Table 1: AHP Indicator Weightings for Rural Landscape Assessment
| Assessment Dimension | Specific Indicator | Weight Assignment | Composite Score |
|---|---|---|---|
| Ecological Quality | Vegetation coverage | 20.89% (highest weight) | 0.6190 |
| Cultural Integrity | Historical preservation | To be determined | To be determined |
| Functional Diversity | Recreational facilities | To be determined | To be determined |
| Landscape Dynamism | Seasonal variation | To be determined | To be determined |
The results revealed that ecological quality was the highest-scoring indicator with a composite score of 0.6190, categorizing the landscape quality as satisfactory [21]. However, areas such as landscape dynamism and functional diversity required significant improvement, providing clear direction for policy interventions and resource allocation.
Protocol: AHP Implementation for Landscape Assessment
Materials and Equipment:
- Expert panel (minimum 5-7 participants)
- AHP data collection software (e.g., Expert Choice, Super Decisions)
- Remote sensing data (e.g., GF-6 imagery with 2m × 2m resolution)
- Geographic Information System (GIS) software
Step-by-Step Procedure:
- Hierarchy Construction: Define the decision problem through a three-level hierarchy structure (goal, criteria, alternatives)
- Criteria Selection: Identify assessment criteria aligned with theoretical framework (e.g., symbiosis theory)
- Pairwise Comparison: Expert panel compares elements pairwise according to established scale (1-9)
- Consistency Verification: Calculate consistency ratio (CR < 0.1 acceptable)
- Weight Synthesis: Aggregate judgments to derive priority weights
- Result Validation: Compare AHP results with field measurements and stakeholder feedback
Application Note: AHP-EWM Combined Weighting for Karst Urban Green Space Assessment
Background and Rationale
Karst regions present unique assessment challenges due to their distinctive geological conditions, ecological sensitivity, and relatively low ecosystem stability and resilience [22]. The integration of AHP with Entropy Weight Method (EWM) creates a balanced approach that combines subjective expert judgment with objective data dispersion analysis, overcoming the constraints of using either method alone [22].
Case Study: Yunyan District Assessment
A study of urban green spaces (UGS) in Yunyan District of Guiyang City, China, implemented an AHP-EWM combined weighting TOPSIS evaluation model to assess ecological and landscape services from both ecological and cultural benefits perspectives [22]. The research revealed that the distribution of Karst UGS ecosystem service generally shows a "high in the east and low in the west" pattern, while landscape perception service shows nonlinear distribution.
Table 2: Karst UGS Assessment Indicators and Findings
| Assessment Category | Key Indicators | Notable Findings | Policy Implications |
|---|---|---|---|
| Ecological Environment Services | Soil conservation (SC), Biodiversity conservation (BC) | SC has highest weight (20.89%); GSA significantly correlates with 7 other indicators | Prioritize soil conservation in management planning |
| Landscape Perception Services | Visual quality, Cultural value, Aesthetic services | Non-linear distribution patterns | Develop targeted interventions for different zones |
| Overall Assessment | Composite scoring | 89.63% classified as low-quality UGS | Significant investment needed for improvement |
Protocol: AHP-EWM Combined Weighting Approach
Research Reagent Solutions:
- Remote Sensing Data: GF-6 imagery (2m × 2m resolution) for land cover classification
- Meteorological Data: Temperature, precipitation, and sunshine duration records
- Topographic Data: Slope information (30m × 30m resolution)
- Population Distribution Data: Demographic information for accessibility analysis
- Survey Instruments: Standardized questionnaires for landscape perception assessment
Step-by-Step Procedure:
- Indicator System Establishment: Select indicators representing ecological, residential, and social perspectives
- Data Normalization: Process raw data to eliminate dimensional differences
- AHP Weighting: Derive subjective weights through expert pairwise comparisons
- EWM Weighting: Calculate objective weights based on data dispersion
- Combined Weight Calculation: Integrate AHP and EWM weights using linear combination
- TOPSIS Evaluation: Rank alternatives based on proximity to ideal solution
- Spatial Analysis: Map results using GIS for pattern identification
Application Note: Uncertainty Assessment in Integrated Ecosystem Services Evaluation
Background and Rationale
Integrating ecosystem services and life cycle assessment introduces additional uncertainties, particularly relevant for evaluating the sustainability of nature-based solutions [23]. A novel protocol for assessing uncertainties in combined ecosystem services-life cycle assessment focuses on three primary sources: ecosystem services accounting, life cycle inventory of foreground systems, and life cycle impact assessment characterization factors [23].
Key Findings from Uncertainty Research
Application of multi-method global sensitivity analysis to a nature-based solution case study revealed significant uncertainties, especially in life cycle impact assessment characterization factors, with the extent varying by impact category [23]. Uncertainties in foreground life cycle inventory, particularly in land use of nature-based solutions scenario, were also notable. Compared to these, uncertainties associated with indicators of impact on ecosystem services were relatively lower.
Protocol: Uncertainty Assessment for Integrated ES-LCA
Materials and Equipment:
- Statistical analysis software (R, Python with uncertainty packages)
- Global sensitivity analysis tools (Sobol, Morris method)
- Life cycle inventory databases
- Ecosystem services models (InVEST, ARIES)
Step-by-Step Procedure:
- Uncertainty Source Identification: Categorize uncertainty sources (parameter, model, scenario)
- Probability Distributions: Assign appropriate distributions to uncertain parameters
- Monte Carlo Simulation: Propagate uncertainties through integrated model
- Global Sensitivity Analysis: Identify most influential parameters using multiple methods
- Convergence Testing: Ensure sufficient iterations for stable results
- Robustness Assessment: Evaluate result reliability through statistical tests
- Communication: Visualize uncertainty information for decision-makers
Application Note: Policy Integration and Implementation Frameworks
Background and Rationale
Ecosystem services assessments must ultimately inform policy decisions to achieve conservation and sustainable development goals. Recent developments demonstrate increasing recognition of landscape-level approaches in federal policy frameworks, though implementation challenges persist [24] [25].
Federal Policy Context
The proposed rescission of the Conservation and Landscape Health Rule (published May 9, 2024) highlights ongoing debates about the appropriate balance between conservation and multiple-use mandates on public lands [24]. Simultaneously, the President's FY2025 budget request includes several increases compared to the FY2024 budget for climate change, biodiversity, parks, water, and transportation, indicating continued policy relevance of landscape-level approaches [25].
Protocol: Translating AHP Results to Policy Recommendations
Step-by-Step Procedure:
- Stakeholder Identification: Map all relevant decision-makers and affected parties
- Priority Alignment: Connect AHP-derived priorities to existing policy frameworks
- Trade-off Analysis: Explicitly evaluate compromises among competing objectives
- Implementation Planning: Develop phased approaches for policy roll-out
- Monitoring Framework: Establish indicators for tracking policy effectiveness
- Adaptive Management: Create feedback mechanisms for policy refinement
The Scientist's Toolkit: Essential Research Reagents and Materials
Table 3: Key Research Reagent Solutions for Ecosystem Services Assessment
| Reagent/Material | Function | Application Context | Data Source |
|---|---|---|---|
| GF-6 Remote Sensing Imagery | High-precision land cover classification (2m × 2m resolution) | Karst UGS assessment, landscape change detection | Geovis Earth Data Cloud |
| AHP Software Tools | Structured decision-making with pairwise comparisons | Rural landscape quality assessment, priority setting | Expert Choice, Super Decisions |
| System Dynamics Models | Simulate feedback loops and temporal dynamics | Projecting landscape changes under scenarios | Vensim, Stella |
| TOPSIS Evaluation Model | Rank alternatives based on ideal solution proximity | Comparative assessment of multiple sites | Various MCDA platforms |
| Entropy Weight Method | Objective weight determination based on data dispersion | Combined weighting with AHP | Statistical software |
| Multi-method Global Sensitivity Analysis | Uncertainty assessment across parameter space | Evaluating robustness of integrated models | R, Python with SALib |
The integration of AHP within comprehensive assessment frameworks provides robust methodological foundations for both landscape management and policy development. Current applications demonstrate particular strength in addressing multi-dimensional challenges requiring balanced consideration of ecological, cultural, and functional priorities. The protocols outlined herein provide actionable pathways for researchers seeking to enhance the policy relevance of ecosystem services assessments while maintaining scientific rigor.
Future directions should emphasize uncertainty-aware decision processes, enhanced stakeholder engagement throughout the assessment workflow, and development of standardized indicator sets that enable comparative analysis across diverse landscape contexts. Particularly promising is the integration of AHP with emerging technologies like AI-powered data analysis and real-time monitoring systems, which could significantly enhance the temporal resolution and predictive capability of landscape assessments.
A Step-by-Step Guide to Implementing AHP in Ecosystem Services Assessment
Structuring a decision hierarchy is the foundational first step in applying the Analytical Hierarchy Process (AHP) to ecosystem services (ES) assessment. This phase translates a complex environmental decision problem into an organized hierarchical model, facilitating systematic evaluation and comparison of competing elements. A well-constructed hierarchy ensures that subsequent AHP steps—pairwise comparisons, priority derivation, and consistency checks—are based on a logical and comprehensive representation of the system under study. Within the broader context of ES research, this structuring is critical for managing the inherent trade-offs and synergies between provisioning, regulating, and cultural services, thereby supporting more sustainable and transparent land management and policy decisions [26] [13].
The AHP, when combined with the ES concept, provides a structured framework for multi-criteria decision analysis (MCDA). This is particularly valuable in environmental management, where decisions often involve balancing a multitude of ecological, social, and economic objectives. The integrated approach helps in organizing complex information, incorporating stakeholder values, and systematically evaluating the impacts of different management scenarios on various ES [13].
Theoretical Foundation: Integrating the ES Concept into AHP
The ES concept offers a vital framework for understanding the benefits humans derive from nature. The Millennium Ecosystem Assessment (MEA) classification—categorizing ES into provisioning, regulating, cultural, and supporting services—is frequently used as a starting point for building AHP hierarchies [13] [27]. Supporting services are sometimes broadened to include habitat services [13].
A key challenge during hierarchy construction is avoiding double-counting, particularly between intermediate ecosystem processes (often supporting services) and the final services that directly benefit human well-being. For instance, if the value of the regulating service "nitrogen removal" is calculated based on the value of the provisioning service "clean drinking water," summing these values would constitute double-counting [13]. Structuring the hierarchy with a clear distinction between means (criteria) and ends (the overall goal) helps mitigate this risk. Frameworks like the Common International Classification of Ecosystem Services (CICES) can provide a more detailed typology of final ecosystem services for this purpose [13].
Furthermore, environmental decision-making often requires criteria beyond ES. A comprehensive AHP hierarchy for an ES problem may need to integrate socio-economic criteria—such as jobs, regional economy, or implementation costs—alongside ecological criteria to provide a complete picture for decision-makers [13].
Methodological Protocol: Constructing the Decision Hierarchy
Stage 1: Define the Goal and Scope
- Primary Action: Clearly articulate the primary objective of the decision-making process. This becomes the top level (Level 1) of the hierarchy.
- Protocol: The goal must be unambiguous. Example goals include: "Select the most sustainable land management scenario for the Loess Plateau" or "Assess rural landscape quality in Pingpan Village for revitalization planning" [26] [21].
- Scoping: Define the spatial extent (e.g., watershed, administrative region), temporal scale, and the key management alternatives or scenarios to be evaluated. Scenarios such as "Business-as-usual," "Ecological Restoration," and "Sustainable Intensification" are common [26].
Stage 2: Identify and Classify Criteria and Sub-criteria
- Primary Action: Identify the principal elements influencing the goal. These form the intermediate levels (Level 2 and below) of the hierarchy.
- Protocol:
- Literature Review: Conduct a systematic review to identify relevant ES and other criteria used in similar studies.
- Stakeholder Engagement: Elicit input from stakeholders, experts, and decision-makers to identify criteria that reflect local or contextual values and priorities. Most MCDA case studies in ES elicit stakeholder preferences [13].
- Adopt a Standard ES Classification: Use an established ES typology (e.g., MEA, CICES) as a checklist to ensure comprehensive coverage. Table 1 provides a standardized set of criteria and indicators.
- Decompose Complex Criteria: Break down broad criteria into measurable sub-criteria. For example, "Regulating Services" can be decomposed into "Water Yield," "Soil Conservation," and "Carbon Sequestration" [26].
Stage 3: Organize the Hierarchy Structurally
- Primary Action: Arrange all identified elements into a multi-level hierarchical structure.
- Protocol:
- Place the overall Goal at the apex (Level 1).
- Place the main Criteria (e.g., ES categories and other key objectives) at Level 2.
- Place specific Sub-criteria (e.g., individual ES or metrics) under their relevant parent criterion at Level 3.
- The lowest level of the hierarchy typically contains the Alternatives or scenarios to be evaluated.
- Validation: Review the hierarchy with experts to ensure logical connections, completeness, and the absence of double-counting.
Table 1: Common Ecosystem Service Criteria and Indicators for AHP Hierarchies
| ES Category (Level 2 Criterion) | Specific Service/Indicator (Level 3 Sub-criterion) | Measurement Unit / Model | Relevance to Decision-Making |
|---|---|---|---|
| Provisioning Services | Crop Yield [26] | kg/ha; Economic value (yuan) [26] | Food security; economic benefit for farmers. |
| Food Production (FP) [28] | Yield for main crops (e.g., wheat, corn) [28] | Regional food self-sufficiency. | |
| Livestock Capacity [27] | Animal units per area | Livelihood and grazing management. | |
| Regulating Services | Water Yield (WY) [26] [28] | mm/year; InVEST model [26] [28] | Water availability for human use and irrigation. |
| Soil Conservation (SC) [26] [28] | tons/ha/year; RUSLE model [26] [28] | Control of land degradation and soil fertility. | |
| Carbon Sequestration [26] | tons C/ha; NPP as a proxy [26] | Climate change mitigation. | |
| Supporting / Habitat Services | Habitat Quality (HQ) [26] [28] | Unitless index (0-1); InVEST model [26] [28] | Biodiversity conservation; ecological security. |
| Net Primary Productivity (NPP) [26] [28] | g C/m²/year; CASA model [26] [28] | Underlying ecosystem function and energy base. | |
| Cultural Services | Recreational Opportunity | Qualitative score; visitor surveys | Tourism revenue and human well-being. |
| Aesthetic Quality [21] | Expert or visitor scoring [21] | Landscape value, often for tourism. |
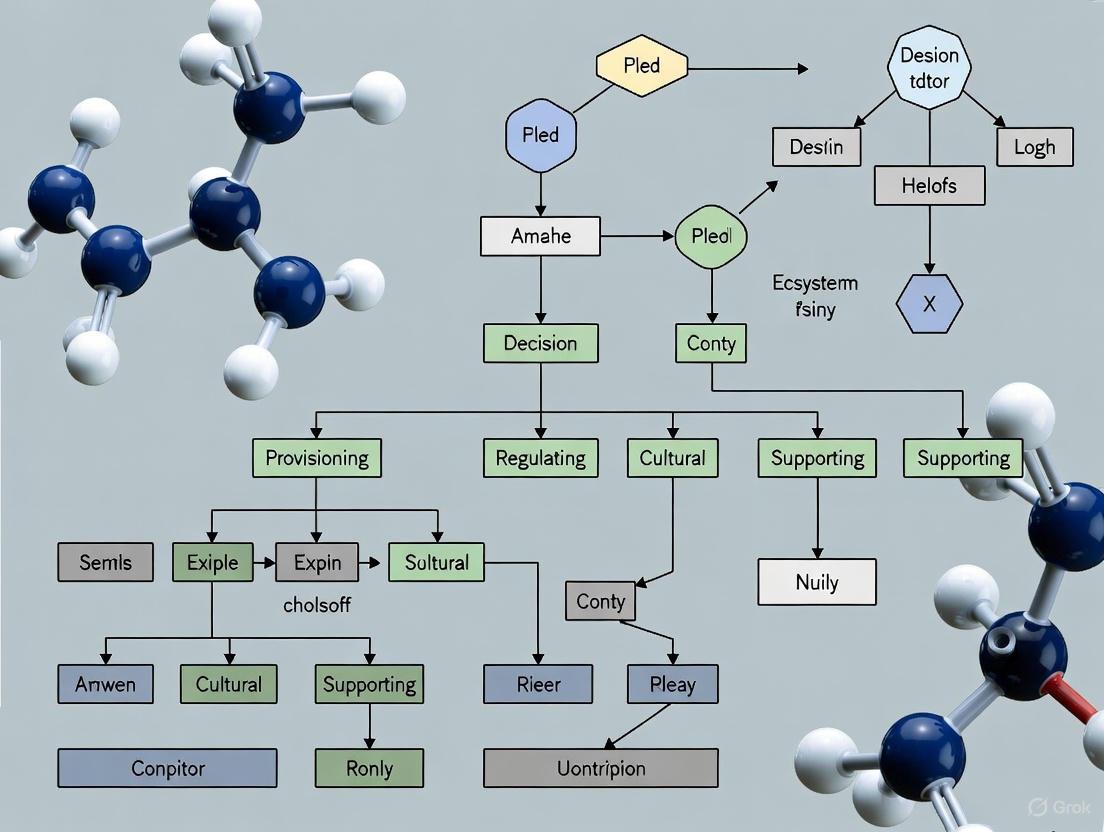
Stage 4: Formalize the Structure Diagrammatically
A visual representation of the hierarchy is essential for communication and verification. The following diagram, generated using Graphviz DOT language, illustrates a generic yet comprehensive hierarchy for an ES-based land management problem.
Diagram: Generic AHP Hierarchy for ES Management. This structure organizes the decision problem from the overall goal down to the specific management alternatives, with criteria based on the ES framework.
Application in Research: Case Study Contexts
Case Study 1: Loess Plateau Land Management
A study in China's Loess Plateau structured its assessment to evaluate trade-offs between agricultural production and other ecosystem services under three scenarios: Business-as-usual, Ecological Restoration, and Sustainable Intensification [26].
- Goal: Achieve sustainable land management in the Loess Plateau.
- Criteria & Sub-criteria:
- Provisioning Services: Crop yield (modeled), economic benefit.
- Regulating Services: Water yield (InVEST model), soil conservation (RUSLE model), carbon sequestration.
- Supporting Services: Biodiversity (habitat quality via InVEST model).
- Application: The hierarchy allowed for the clear quantification of trade-offs, showing that the ecological restoration scenario maximized regulating and supporting services but reduced agricultural output, while sustainable intensification increased agricultural production with moderate ecosystem service provision [26].
Case Study 2: Rural Landscape Assessment
Research on Pingpan Village used a symbiosis theory-based AHP framework to assess rural landscape quality, integrating ecological, cultural, and functional elements [21].
- Goal: Assess rural landscape quality for sustainable revitalization.
- Criteria: The hierarchy was built around symbiotic units, environment, interfaces, and models, which included:
- Ecological Quality: The highest-scoring indicator (composite score of 0.6190).
- Cultural Elements: Reflecting local heritage and identity.
- Functional Diversity: Pertaining to the practical uses of the landscape.
- Application: This structured evaluation identified landscape dynamism and functional diversity as areas requiring significant improvement, providing targeted insights for policymakers [21].
The Scientist's Toolkit: Essential Research Reagents and Models
Table 2: Key Analytical Tools and Models for ES Assessment in AHP
| Tool/Model Name | Primary Function in ES Assessment | Application Context in AHP |
|---|---|---|
| InVEST (Integrated Valuation of Ecosystem Services and Tradeoffs) | Spatially explicit modeling of multiple ES, including water yield, soil conservation, and habitat quality [26] [28]. | Provides quantitative data (sub-criterion performance) for evaluating and comparing alternatives. |
| CASA (Carnegie-Ames-Stanford Approach) Model | Estimates Net Primary Productivity (NPP) using remote sensing data, a key proxy for carbon sequestration and ecosystem function [26]. | Serves as an indicator for regulating and supporting services in the hierarchy. |
| RUSLE (Revised Universal Soil Loss Equation) | An empirical model that predicts soil erosion based on rainfall, soil properties, and land-use [26]. | Quantifies the soil conservation sub-criterion under regulating services. |
| Random Forest Algorithm | A machine learning algorithm for robust land-use and land-cover classification from remote sensing imagery [26]. | Generates critical input data (land-use maps) for many ES models like InVEST and RUSLE. |
| GIS (Geographic Information Systems) | Platform for spatial data management, analysis, and visualization of ES indicators and trade-offs [28] [21]. | Essential for creating maps of ES bundles, ecological security patterns, and spatial resistance surfaces. |
| AHP Software (e.g., Expert Choice, R packages) | Software dedicated to structuring the hierarchy, performing pairwise comparisons, calculating weights, and conducting sensitivity analysis. | The primary tool for implementing the AHP methodology once the hierarchy is structured and data is collected. |
The Analytic Hierarchy Process (AHP) serves as a powerful multi-criteria decision-making (MCDM) tool, enabling researchers to decompose complex problems into hierarchical structures. A critical phase in this methodology is Conducting Pairwise Comparisons, a systematic process for deriving ratio-scale priorities among elements at each level of the hierarchy [29] [4]. This step transforms subjective judgments into quantitative data, providing a mathematical basis for decision-making.
In the specific context of ecosystem services assessment, where decisions often involve intangible factors and multiple stakeholder perspectives, the pairwise comparison step brings necessary rigor and structure. For instance, AHP has been successfully applied to evaluate the ecological recreation adaptability of urban parks, helping to determine the relative importance of factors such as ecological environment carrying capacity versus social and economic conditions [30]. Similarly, this method has been utilized to prioritize sustainable urban indicators, creating assessment tools that respond to local ecological and social dynamics [31].
The fundamental principle behind pairwise comparison is that humans are more capable of making accurate judgments between two elements at a time rather than simultaneously weighing multiple factors [32]. By systematically comparing each pair of criteria or alternatives, researchers can build a robust framework for evaluating complex ecosystem service trade-offs and synergies.
Saaty's Fundamental 1-9 Ratio Scale
Central to the pairwise comparison process is Saaty's 1-9 scale, a numerical scale that translates qualitative judgments about the relative importance between two elements into quantitative values [29] [4]. Developed by Thomas Saaty, the founder of AHP, this scale ranges from 1 to 9, where 1 indicates equal importance and 9 represents extreme importance of one element over another [32]. The scale and its interpretation are detailed in Table 1.
Table 1: Saaty's Fundamental Scale of Absolute Numbers with Definitions and Explanations
| Intensity of Importance | Definition | Explanation |
|---|---|---|
| 1 | Equal importance | Two activities contribute equally to the objective [32] |
| 2 | Weak or slight | |
| 3 | Moderate importance | Experience and judgment slightly favor one element over another [32] |
| 4 | Moderate plus | |
| 5 | Strong importance | Experience and judgment strongly favor one element over another [32] |
| 6 | Strong plus | |
| 7 | Very strong importance | An element is favored very strongly over another; its dominance demonstrated in practice [32] |
| 8 | Very, very strong | |
| 9 | Extreme importance | The evidence favoring one element over another is of the highest possible order of affirmation [32] |
| Reciprocals | If element i has one of the above numbers assigned to it when compared to element j, then j has the reciprocal value when compared to i |
The scale employs both integers and their reciprocals. When element A is judged to be more important than element B, it receives a value from the fundamental scale (3, 5, 7, 9). Conversely, when element B is less important than element A, it is assigned the reciprocal value (1/3, 1/5, 1/7, 1/9) [29]. This reciprocal property ensures mathematical consistency throughout the comparison matrix.
For ecosystem services research, this scale enables researchers to quantify judgments about the relative importance of various criteria, such as determining how much more important "water yield" is compared to "carbon storage" when evaluating overall ecosystem service value in regions like the Yunnan-Guizhou Plateau [33].
Structured Protocol for Conducting Pairwise Comparisons
Preparation Phase
Before commencing pairwise comparisons, proper preparation is essential:
Define the Decision Hierarchy: Clearly structure your decision problem into a hierarchy comprising the overall goal at the top level, criteria and sub-criteria at intermediate levels, and alternatives at the bottom level [29]. For ecosystem services assessment, this might involve breaking down the overall goal of "evaluating ecological recreation adaptability" into criteria such as "ecological environment carrying capacity," "ecological recreation behavior," "ecological recreation resources," and "social and economic conditions" [30].
Identify Comparison Elements: Determine which elements at each level of the hierarchy require pairwise comparison. This typically includes all elements at the same level relative to their parent element in the level above [29].
Select Appropriate Judges: Identify qualified experts or stakeholders to perform the comparisons. In recent studies, social networks have proven more effective than conventional methods for identifying and contacting experts in specialized fields [31].
Comparison Matrix Construction
The pairwise comparison process requires constructing a reciprocal matrix where each element is compared against every other element:
Create Pairwise Comparison Matrix: Develop an n×n matrix, where n represents the number of elements being compared. Label rows and columns with the element names [29].
Perform Pairwise Judgments: For each cell (i,j) in the matrix, pose the question: "How much more important is the element in row i than the element in column j?" Select the appropriate numerical value from Saaty's scale based on expert judgment [29].
Apply Reciprocal Values: Once a value is assigned for comparison (i,j), automatically assign its reciprocal to the opposite position (j,i) in the matrix [32]. The diagonal elements of the matrix always equal 1, as each element is equally important when compared to itself [29].
Table 2: Example Pairwise Comparison Matrix for Ecosystem Services Criteria
| Criteria | Water Yield | Carbon Storage | Habitat Quality | Soil Conservation |
|---|---|---|---|---|
| Water Yield | 1 | 1/3 | 1/5 | 1/2 |
| Carbon Storage | 3 | 1 | 1/2 | 2 |
| Habitat Quality | 5 | 2 | 1 | 3 |
| Soil Conservation | 2 | 1/2 | 1/3 | 1 |
Specialized Protocol for Ecosystem Services Research
When applying pairwise comparisons specifically to ecosystem services assessment, researchers should consider these specialized steps:
Incorporate Both Quantitative and Qualitative Factors: Ecosystem services assessments often involve both measurable factors (e.g., species richness, distribution density of recreational resources) and subjective factors (e.g., recreational space layout, aesthetic value). The pairwise comparison process accommodates both types of factors [30].
Engage Interdisciplinary Experts: Given the multifaceted nature of ecosystem services, involve experts from various disciplines including ecology, sociology, economics, and urban planning to ensure comprehensive perspective representation [31].
Contextualize Judgments to Local Conditions: Recognize that the relative importance of ecosystem services may vary significantly based on local environmental, social, and economic conditions. For instance, water yield might be more critical in arid regions compared to water-rich areas [33].
Calculation of Priority Weights
Eigenvector Method
After completing the pairwise comparison matrix, the next step involves deriving priority weights for each element. The most accurate approach employs the eigenvector method:
- Square the Matrix: Multiply the pairwise comparison matrix by itself [29].
- Calculate Row Sums: Sum the values in each row of the squared matrix [29].
- Normalize the Row Sums: Divide each row sum by the total of all row sums to obtain an initial priority vector [29].
- Iterate to Stability: Repeat the squaring and normalization process until the priority vector stabilizes with minimal changes between iterations [29].
Approximation Method
For practical applications without specialized software, a simplified approximation method can be used:
- Sum Each Column: Calculate the sum of values in each column of the pairwise comparison matrix [32].
- Normalize the Matrix: Divide each value in the matrix by its column sum [32].
- Calculate Row Averages: Compute the average of each row in the normalized matrix to derive the priority weights [32].
Table 3: Priority Weight Calculation from Normalized Matrix
| Criteria | Water Yield | Carbon Storage | Habitat Quality | Soil Conservation | Priority Weight |
|---|---|---|---|---|---|
| Water Yield | 0.091 | 0.087 | 0.098 | 0.077 | 0.088 |
| Carbon Storage | 0.273 | 0.261 | 0.244 | 0.308 | 0.272 |
| Habitat Quality | 0.455 | 0.522 | 0.488 | 0.462 | 0.482 |
| Soil Conservation | 0.182 | 0.130 | 0.171 | 0.154 | 0.159 |
| Column Sum | 11.000 | 3.833 | 5.033 | 2.500 | Total = 1.001 |
The example in Table 3 shows the calculation process for four ecosystem service criteria, with "Habitat Quality" emerging as the highest priority (0.482), followed by "Carbon Storage" (0.272), "Soil Conservation" (0.159), and "Water Yield" (0.088).
Consistency Assessment
Consistency Ratio Calculation
A key advantage of AHP is its ability to measure the logical consistency of judgments through the Consistency Ratio (CR). The step-by-step calculation is as follows:
- Calculate Weighted Sum Vector: Multiply the pairwise comparison matrix by the priority vector [4].
- Compute Consistency Vector: Divide each element of the weighted sum vector by the corresponding priority weight [4].
- Determine Lambda Max (λmax): Calculate the average of the consistency vector values [4].
- Calculate Consistency Index (CI): Apply the formula CI = (λmax - n)/(n - 1), where n is the number of elements compared [4].
- Compute Consistency Ratio (CR): Divide CI by the Random Index (RI) value for the corresponding matrix size (CR = CI/RI) [4].
Random Index values vary by matrix size, with standard values being: 0.00 for n=1, 0.58 for n=3, 0.90 for n=4, 1.12 for n=5, 1.24 for n=6, 1.32 for n=7, 1.41 for n=8, and 1.45 for n=9 [4].
Interpretation and Handling of Inconsistency
- Acceptable Consistency Threshold: A Consistency Ratio of 0.10 or less is generally considered acceptable, indicating reasonable consistency in judgments [32].
- High CR Resolution: If CR exceeds 0.10, review and revise the most inconsistent judgments. Research indicates that using online tools and software can significantly help reduce inconsistencies during data collection [31].
- Diagnostic Tools: Specialized AHP software typically identifies the specific pairwise comparisons contributing most to inconsistency, allowing for targeted revisions [32].
Workflow Visualization
Diagram 1: AHP Pairwise Comparison Workflow for Ecosystem Services
Application in Ecosystem Services Assessment
The pairwise comparison methodology has demonstrated particular utility in ecosystem services research, where decisions typically involve multiple competing criteria with both quantitative and qualitative dimensions. Recent applications include:
Urban Park Evaluation: Researchers applied AHP to assess ecological recreation adaptability in Yangshan Park, China. Through pairwise comparisons, they determined that "ecological environment carrying capacity" (weight: 0.5762) was significantly more important than "ecological recreation behavior" (0.2152), "ecological recreation resources" (0.1614), and "social and economic conditions" (0.0472) [30].
Sustainable Neighborhood Assessment: AHP facilitated the prioritization of sustainability indicators for neighborhood development in Cuenca, Ecuador. The pairwise comparison process enabled researchers to adapt international sustainability assessment tools to local contexts by weighting indicators according to regional priorities [31].
Comprehensive Ecosystem Services Assessment: The methodology supports the evaluation of multiple ecosystem services—including water yield, carbon storage, habitat quality, and soil conservation—by providing a structured approach to weigh their relative importance in specific geographical contexts such as the Yunnan-Guizhou Plateau [33].
Research Reagent Solutions
Table 4: Essential Tools and Software for AHP Implementation in Ecosystem Services Research
| Tool/Software | Type | Primary Function | Application Context |
|---|---|---|---|
| Expert Choice | Commercial Software | Comprehensive AHP implementation with user-friendly interface | Full-scale AHP projects with complex hierarchies [4] |
| Prioritization Helper | Cloud-based Application | AHP analysis integrated with Salesforce platform | Organizational decision-making within Salesforce environment [4] |
| ArcGIS Pairwise Comparison Tool | Geospatial Tool | Calculate weights for suitability models within GIS environment | Ecosystem services mapping and spatial decision support [32] |
| R (decisionSupport Package) | Open-source Statistical Package | AHP implementation within comprehensive statistical environment | Research applications requiring advanced statistical analysis [31] |
| Python (pyanp Library) | Programming Library | Custom AHP implementation and automation | Tailored applications and integration with other analytical models [33] |
| Online Survey Platforms | Web-based Tools | Distributed data collection from multiple experts | Gathering judgments from geographically dispersed stakeholders [31] |
Best Practices and Lessons from Recent Applications
Recent research applications of AHP in ecosystem services assessment have yielded valuable insights for optimizing the pairwise comparison process:
Structured Expert Recruitment: Leverage professional networks and social media to identify and recruit qualified experts, as these channels have proven more effective than conventional methods for specialized research domains [31].
Virtual Implementation: Conduct pairwise comparison surveys using virtual platforms, which have demonstrated effectiveness even in challenging circumstances such as pandemic restrictions [31].
Software Utilization: Employ specialized AHP software to optimize time and resources while minimizing computational errors, particularly for complex hierarchies with numerous elements [31].
Contextual Framework Development: Build the decision hierarchy through comprehensive literature review, ensuring inclusion of all relevant criteria specific to ecosystem services assessment. Studies have successfully structured hierarchies around dimensions including ecology, infrastructure, transportation, resources, social well-being, and neighborhood environment [31].
Handling Subjectivity: Acknowledge and document the inherent subjectivity in pairwise comparisons while using the consistency ratio as a quality control measure. The method's strength lies in its ability to transform these subjective judgments into quantitatively consistent priorities [4] [31].
When rigorously applied following these protocols, the pairwise comparison process using Saaty's scale provides a robust foundation for ecosystem services assessment, enabling researchers to make informed decisions that balance multiple ecological, social, and economic considerations.
Within the framework of an ecosystem services assessment, the Analytical Hierarchy Process (AHP) provides a structured method for integrating diverse stakeholder preferences and complex environmental data. After structuring the decision hierarchy and performing pairwise comparisons, the critical third step involves deriving mathematically sound priority weights and validating the logical consistency of the judgments. This step transforms qualitative comparisons into quantitative weights that accurately reflect stakeholder priorities, forming the foundation for a robust and defensible multi-criteria analysis. This protocol details the methodologies for calculating these priority weights and the essential consistency ratio.
Experimental Protocols & Application Notes
Protocol: Calculating Priority Weights from a Pairwise Comparison Matrix
This protocol describes the eigenvalue method for deriving priority weights, which represent the relative importance of each criterion (e.g., ecosystem services like timber production, wildfire resistance, or carbon sequestration) based on the pairwise comparison matrix obtained from stakeholder surveys [29].
Workflow Overview:
Required Materials & Reagents:
- Research Reagent Solutions:
Reagent / Software Solution Function in Protocol Pairwise Comparison Matrix The primary input data; a square matrix of stakeholder-derived preference ratios between criteria [29]. Mathematical Software (Excel, R, Python) To perform complex matrix operations (e.g., squaring, eigenvector calculation) accurately and efficiently [29]. Specialized AHP Software (e.g., Criterium Decision Plus (CDP), SpiceLogic AHP) Automates weight and consistency calculations, reducing computational effort and error [16] [34].
Step-by-Step Procedure:
Input the Pairwise Comparison Matrix (A): Begin with the completed pairwise comparison matrix, where the diagonal elements are 1 and the off-diagonal elements are the reciprocal judgments (e.g., if criterion i is rated '3' over j, then j is '1/3' relative to i) [29].
- Example Matrix for criteria: Timber, Water, Biodiversity:
Square the Matrix (A²): Multiply the matrix by itself. For each element in the resulting squared matrix, calculate the dot product of the corresponding row and column from the original matrix [29].
Calculate Row Totals: Sum the values in each row of the squared matrix [29].
Compute the Initial Priority Vector: a. Sum all the row totals from the previous step. b. Divide each individual row total by this overall sum. The resulting vector is the first estimate of the priority weights [29].
Iterate to Stability: Use the resulting priority vector to repeat the process (steps 2-4) by constructing a new matrix and recalculating the vector. This iterative process refines the weights. Continue until the difference between successive priority vectors is negligible (e.g., changes are less than 0.0001) [29]. The final output is the set of stable priority weights.
Protocol: Calculating the Consistency Ratio (CR)
The Consistency Ratio is a diagnostic metric that ensures the pairwise comparisons made by stakeholders are logically coherent. An acceptable CR (≤ 0.10) indicates that the derived weights are a reliable representation of their preferences [35] [34].
Workflow Overview:
Required Materials & Reagents:
- Research Reagent Solutions:
Reagent / Software Solution Function in Protocol Principal Eigenvalue (λ_max) A scalar value derived from the pairwise matrix and priority weights; the key component for calculating inconsistency [35] [34]. Random Index (RI) Table A predefined statistical benchmark based on matrix size (n), used to normalize the Consistency Index [35]. Consistency Diagnostic Tools Features in AHP software that identify the most inconsistent pairwise comparisons, guiding efficient revisions [35].
Step-by-Step Procedure:
Calculate the Weighted Sum Vector (SW): For each criterion i in the original pairwise comparison matrix, calculate the weighted sum [35].
- Formula: ( SWi = \sum{j=1}^{n} (a{ij} \times wj) )
- Example: For the 'Timber' row, multiply each value (1, 3, 5) by the corresponding weight (wT, wW, w_B) and sum the results.
Calculate the Eigenvalue for each Row (λ_i): Divide the weighted sum for each criterion by its corresponding priority weight [35].
- Formula: ( \lambdai = \frac{SWi}{w_i} )
Compute the Principal Eigenvalue (λmax): Calculate the average of all the λi values [35] [34].
- Formula: ( \lambda{max} = \frac{1}{n} \sum{i=1}^{n} \lambda_i )
Calculate the Consistency Index (CI): This measures the average deviation from perfect consistency [35] [34].
- Formula: ( CI = \frac{\lambda_{max} - n}{n - 1} )
Determine the Random Index (RI): Look up the RI value corresponding to the number of criteria (n) in the established table [35]:
n 2 3 4 5 6 7 8 9 RI 0.00 0.58 0.90 1.12 1.24 1.32 1.41 1.45 Compute the Consistency Ratio (CR): Divide the CI by the RI [35] [34].
Data Presentation
Table 1: Key Formulas for Weight and Consistency Calculation
| Calculation | Formula | Description |
|---|---|---|
| Priority Vector (initial) | ( wi = \frac{\text{Row Total}i}{\sum \text{All Row Totals}} ) | Estimates relative weights from the squared comparison matrix [29]. |
| Principal Eigenvalue (λ_max) | ( \lambda{max} = \frac{1}{n} \sum{i=1}^{n} \frac{SWi}{wi} ) | The average of individual eigenvalues, indicating matrix consistency [35] [34]. |
| Consistency Index (CI) | ( CI = \frac{\lambda_{max} - n}{n - 1} ) | Measures the degree of inconsistency in the pairwise comparisons [35] [34]. |
| Consistency Ratio (CR) | ( CR = \frac{CI}{RI} ) | The final metric for assessing the acceptability of consistency [35] [34]. |
Worked Example in Ecosystem Services Context
Suppose a survey for a forest management plan yields this pairwise comparison matrix for three ecosystem services: Timber (T), Water Quality (W), and Biodiversity (B) [16].
Table 2: Example Pairwise Comparison Matrix and Consistency Check
| Criterion | Timber (T) | Water (W) | Biodiversity (B) | Weights (w_i) | Weighted Sum (SW_i) | λ_i |
|---|---|---|---|---|---|---|
| Timber (T) | 1 | 3 | 5 | 0.637 | 1.936 | 3.039 |
| Water (W) | 1/3 | 1 | 3 | 0.258 | 0.789 | 3.055 |
| Biodiversity (B) | 1/5 | 1/3 | 1 | 0.105 | 0.318 | 3.037 |
| λ_max = | 3.044 |
Calculations:
- CI = (3.044 - 3) / (3 - 1) = 0.022
- RI (for n=3) = 0.58 [35]
- CR = 0.022 / 0.58 = 0.038
Interpretation: The CR of 0.038 is well below the 0.10 threshold, indicating the stakeholder's judgments for this part of the hierarchy are highly consistent and thus trustworthy for the subsequent ranking of management scenarios [35] [34].
Within the framework of ecosystem services (ES) assessment, the Analytical Hierarchy Process (AHP) is a powerful multi-criteria decision-making tool. When this process involves multiple experts, synthesizing individual judgments into a cohesive group decision is a critical step. This protocol details the methodologies for aggregating individual judgments and priorities in a group AHP setting, with specific application to ES assessment, such as weighting the relative importance of different ecosystem services or evaluating conservation alternatives [5].
The core challenge in group AHP is to reconcile the inputs from various stakeholders or experts into a single set of group priorities. This document provides detailed, actionable procedures for the two principal aggregation approaches and methods for handling varying levels of decision-maker expertise.
Aggregation Methods: Protocols and Applications
Two mainstream methodological approaches exist for synthesizing group inputs in AHP: Aggregation of Individual Judgments (AIJ) and Aggregation of Individual Priorities (AIP). The choice between them depends on the nature of the group and the goal of the decision-making process [36].
Protocol for Aggregation of Individual Judgments (AIJ)
The AIJ method operates at the level of the pairwise comparison matrices. It is used when the group is deemed to act as a single new "individual," effectively constructing a group comparison matrix.
Experimental Protocol:
- Collect Individual Matrices: Ensure all decision-makers (
DM1,DM2, ...,DMk) have evaluated the same hierarchical structure and provided complete pairwise comparison matrices for each node (criteria, sub-criteria, alternatives). - Construct Group Matrix: For each cell in the pairwise comparison matrices, compute the weighted geometric mean of the corresponding judgments from all decision-makers. The formula for a single cell comparing element
ito elementjis: ( GroupJudgment{ij} = \prod{m=1}^{k}(Judgment{m,ij})^{wm} ) where ( wm ) is the weight of them-thdecision-maker, and ( \sum{m=1}^{k} w_m = 1 ). If all DMs are equally weighted, this simplifies to the standard geometric mean. - Compute Group Priorities: Once the aggregated group pairwise comparison matrix is built, derive the final priority vector for that node using the standard AHP method (e.g., the eigenvector method) [36] [37].
Application Example in ES Assessment: A group of ecologists, urban planners, and local policymakers pairwise compare ES criteria like "Climate Regulation," "Water Purification," and "Recreation." Their individual judgments on a 9-point scale are aggregated into a single group comparison matrix, from which the final criterion weights are derived.
Protocol for Aggregation of Individual Priorities (AIP)
The AIP method, also known as the "weighted arithmetic mean method," aggregates the final priority vectors obtained from each decision-maker's complete AHP model.
Experimental Protocol:
- Run Individual AHP Models: Each decision-maker (
DM1,DM2, ...,DMk) performs the complete AHP process independently. This involves making all pairwise comparisons and calculating their own local and global priority vectors for all criteria and alternatives. - Aggregate Final Scores: For each alternative, compute the weighted arithmetic mean of its global priority from all decision-makers. The formula for the group priority of alternative
Xis: ( GroupPriorityX = \sum{m=1}^{k} (GlobalPriority{m,X} \cdot wm) ) where ( w_m ) is the weight of them-thdecision-maker [36].
Application Example in ES Assessment: Multiple stakeholders first complete their own AHP models to rank different land-use scenarios. The AIP method is then used to combine their final ranking scores into a single group ranking, which can reveal the consensus preference, for instance, between reforestation, agricultural development, or urban expansion.
Structured Comparison of Aggregation Methods
The table below summarizes the key characteristics of the two primary aggregation methods for easy comparison.
Table 1: Comparison of Aggregation of Individual Judgments (AIJ) and Aggregation of Individual Priorities (AIP)
| Feature | Aggregation of Individual Judgments (AIJ) | Aggregation of Individual Priorities (AIP) |
|---|---|---|
| Level of Aggregation | Pairwise comparison matrices (individual judgments) | Final priority vectors (individual results) |
| Mathematical Operation | Weighted Geometric Mean | Weighted Arithmetic Mean |
| Interpretation | The group is treated as a new, synthetic individual. | The group result is a composite of individual outcomes. |
| Primary Use Case | Aiming for group consensus on the judgments themselves. | Combining individual preferences or evaluations directly. |
| Software Implementation | Requires calculation of a new matrix before deriving priorities. | Simpler; often the default in AHP software [36]. |
Protocol for Assigning Decision-Maker Weights
In many group decision-making contexts, not all experts have equal expertise or stake. Assigning weights to decision-makers allows the model to reflect their differing levels of importance or knowledge [38].
Experimental Protocol:
- Define a Weighting Criterion: Establish the basis for weighting. Common criteria in ES assessment include:
- Expertise: Level of knowledge in a specific ES domain (e.g., hydrology, soil science, socio-economics).
- Consistency: The logical reliability of a DM's judgments, typically measured by the Consistency Ratio (CR) from their pairwise comparisons. A lower CR often warrants a higher weight.
- Stake: The degree to which the decision outcome affects the DM or the constituency they represent.
- Determine the Weights: Use a structured method to assign weights. This can be done externally (e.g., by a project lead) or via a pairwise comparison matrix where DMs are compared against each other with respect to the chosen weighting criterion.
- Apply the Weights: Use the derived weights (( w_m )) in the formulas for either AIJ or AIP, as detailed in the previous protocols.
Advanced and Alternative Aggregation Protocols
Recent research has proposed advanced aggregation methods that can outperform conventional techniques, especially in large-scale groups or high-dimensional problems.
Protocol for Distance-Based Aggregation
This method aims to find a group priority vector that minimizes the overall "distance" to all individual priority vectors.
Experimental Protocol:
- Collect Individual Priorities: Obtain the final priority vectors from all
kdecision-makers. - Define a Distance Metric: Select a distance function. Studies have evaluated:
- Euclidean Distance-Based Aggregation (EDBAM): Minimizes the sum of squared Euclidean distances between the group vector and each individual vector.
- Aitchison Distance-Based Aggregation (ADBAM): Uses a distance metric designed for compositional data (like priority vectors that sum to 1) [37].
- Optimization: Solve the optimization problem to find the group vector that minimizes the total distance to all individual vectors. Specialized software or algorithms are typically required for this step.
Application Note: Simulation-based research has shown that EDBAM, in particular, maintains high efficiency and outperforms conventional methods in large-scale group AHP settings, especially when the number of criteria is high (7 to 9) [37].
Workflow Visualization for Group AHP
The following diagram illustrates the logical workflow and decision points for aggregating individual judgments in a group AHP process, as applied to ecosystem services assessment.
The Scientist's Toolkit: Research Reagent Solutions
The following table details key methodological components and their functions in conducting a group AHP study for ecosystem services assessment.
Table 2: Essential Methodological Components for Group AHP in ES Assessment
| Component | Function & Description | Example in ES Context |
|---|---|---|
| Pairwise Comparison Survey | The primary instrument for data collection from decision-makers. Presents criteria and alternatives in a pairwise fashion for rating on the AHP scale (1-9). | Used to elicit stakeholder preferences on the relative importance of "Carbon Sequestration" vs. "Flood Mitigation" [5]. |
| Consistency Ratio (CR) | A diagnostic metric to check the logical coherence of a decision-maker's judgments. A CR ≤ 0.10 is generally acceptable. | Identifies and allows for the correction of inconsistent stakeholder evaluations, ensuring more reliable inputs. |
| Weighted Geometric Mean | The core mathematical operation for the Aggregation of Individual Judgments (AIJ) method. | Synthesizes multiple stakeholders' comparison matrices for "habitat quality" into a single, representative group matrix. |
| Weighted Arithmetic Mean | The core mathematical operation for the Aggregation of Individual Priorities (AIP) method. | Combines the final ranked scores for different conservation plans from a group of ecologists and economists. |
| Expertise/Stake Matrix | A framework for defining and assigning weights to decision-makers based on their knowledge level or interest in the outcome. | Gives higher weight to hydrologists when assessing water-related ES and to local communities when assessing cultural ES [38]. |
| Distance-Based Aggregation Algorithm | An advanced computational procedure (e.g., EDBAM) to find a consensus priority vector that minimizes distance to all individual vectors. | Provides a robust consensus for large, diverse stakeholder groups ranking multiple land-use policy alternatives [37]. |
The AHP-DPSR (Analytical Hierarchy Process integrated with Driver-Pressure-State-Response) framework represents a sophisticated methodological advancement in ecosystem services (ES) assessment, specifically designed to address complex environmental management challenges. This integrated approach combines the structural causality analysis of the DPSIR (Driver-Pressure-State-Impact-Response) model with the multi-criteria decision-making capabilities of AHP, creating a powerful tool for quantifying trade-offs and guiding sustainable resource management decisions. The fundamental strength of this hybrid framework lies in its ability to transform complex ecological relationships into a structured decision-making process that can incorporate both quantitative data and stakeholder values, making it particularly valuable for river basin management where multiple, often competing, ecosystem services must be balanced.
Within the context of ecosystem services research, the AHP-DPSR framework addresses critical methodological gaps by providing a systematic approach for prioritizing management interventions based on their potential effects across the full spectrum of ecological, social, and economic dimensions. The DPSIR component establishes causal pathways from human activities (Drivers) through environmental Pressures, changes in ecosystem State, resulting Impacts on human well-being, and societal Responses [39]. Meanwhile, the AHP component enables the quantification of stakeholder preferences and the calculation of relative importance weights for different evaluation criteria, thus supporting transparent and logically consistent decision-making [13]. This integration is particularly valuable for assessing ES trade-offs in river basins, where management decisions often involve difficult choices between provisioning services (e.g., water supply), regulating services (e.g., flood control, water purification), cultural services (e.g., recreation), and supporting services (e.g., habitat provision) [40] [41].
Theoretical Foundation and Conceptual Framework
The DPSIR Model in Environmental Assessment
The DPSIR framework provides a comprehensive conceptual model for analyzing environmental problems by establishing cause-effect relationships between human activities and their environmental consequences. In the context of river basin management, the model's components can be specifically defined as follows:
- Drivers (D): Fundamental social, demographic, and economic developments that create pressures on the environment. In river basins, these typically include agricultural expansion, urbanization, population growth, and economic development that increase demands for water resources and land use changes [39] [42].
- Pressures (P): Direct stresses imposed on the environment by drivers, such as water extraction, pollutant discharges, land use changes, and climate change effects including altered precipitation patterns and temperature regimes [39] [43].
- State (S): The resulting physical, chemical, and biological conditions of the river basin ecosystem, including water quality parameters, ecological health indicators, habitat quality, and biodiversity metrics [43] [42].
- Impact (I): The consequences of changes in ecosystem state on human well-being, typically expressed through changes in the delivery of ecosystem services such as water provisioning, flood regulation, cultural values, and supporting services [39] [40].
- Response (R): Societal actions taken to address environmental issues, including policies, management strategies, technological solutions, and behavioral changes designed to mitigate negative impacts or enhance positive outcomes [39] [44].
Recent applications have demonstrated the value of explicitly integrating influence pathways through the "Impacts" component to capture long-term systemic effects of upstream changes on sustainability outcomes [39]. This enhanced causality makes the framework particularly suitable for analyzing ES trade-offs, where changes in one service often trigger cascading effects throughout the socio-ecological system.
Analytical Hierarchy Process in Environmental Decision-Making
The Analytical Hierarchy Process provides a structured technique for organizing and analyzing complex decisions by breaking down a problem into a hierarchical structure and using pairwise comparisons to establish priority weights for different elements. When applied to ecosystem services assessment, AHP enables researchers and decision-makers to:
- Deconstruct complex problems into manageable components organized in a hierarchical structure from overall goal to criteria, sub-criteria, and alternatives
- Incorporate diverse stakeholder perspectives through systematic pairwise comparison of elements at each level of the hierarchy
- Combine quantitative and qualitative factors using a consistent mathematical framework for priority derivation
- Evaluate consistency in judgment through calculation of a consistency ratio, ensuring logical coherence in stakeholder preferences [13]
The combination of AHP with DPSIR creates a robust framework that not only identifies causal relationships but also quantifies their relative importance, making it particularly valuable for addressing the multi-dimensional nature of ecosystem service trade-offs in river basins.
Integrated AHP-DPSR Framework for ES Trade-off Analysis
The conceptual integration of AHP and DPSR creates a comprehensive framework for ES trade-off analysis that connects causal pathways with value-based prioritization. The logical flow of this integrated framework can be visualized as follows:
Figure 1: AHP-DPSR Integration Logic
This integrated framework enables the transformation of the qualitative DPSIR causal chains into a quantitative decision-making model through the systematic weighting of each component based on stakeholder preferences and scientific data.
Application Notes: Implementing AHP-DPSR in River Basin Management
Case Study Context: Zarrinehrud River Basin
The application of the AHP-DPSR framework is illustrated through a case study of the Zarrinehrud Basin in Iran, located within the Lake Urmia basin, which represents one of the world's largest saltwater lakes facing significant environmental challenges [39]. The basin has experienced severe environmental degradation, primarily driven by agricultural expansion and climate pressures, resulting in the baseline WRECC (Water Resources and Environmental Carrying Capacity) assessment classifying the system as "severely overloaded" [39]. This case provides a compelling example of how the AHP-DPSR framework can be applied to diagnose complex ES trade-offs and evaluate potential intervention strategies.
The research conducted in the Zarrinehrud Basin employed a modified DPSIR approach that explicitly integrated influence pathways into WRECC estimation through the "Impacts" component, capturing long-term systemic effects of upstream changes on sustainability outcomes [39]. The study evaluated 40 different management strategies under multiple climate change scenarios (RCP 4.5, 6.0, and 8.5) covering the periods 2000–2023 and 2024–2039, with impacts assessed across environmental, socio-economic, and cultural dimensions [39]. The selection of the optimal strategy employed the fallback bargaining method incorporating stakeholder utilities to ensure feasibility and acceptance, demonstrating a real-world application of multi-criteria decision analysis principles aligned with the AHP methodology.
Data Requirements and Indicator Selection
Successful implementation of the AHP-DPSR framework requires systematic data collection and indicator development across all DPSIR components. Based on case study applications, the following indicator framework has proven effective for river basin ES assessment:
Table 1: Core Indicators for AHP-DPSR Implementation in River Basins
| DPSIR Component | Indicator Category | Specific Metrics | Data Sources |
|---|---|---|---|
| Drivers (D) | Socio-economic | Population growth rate, GDP growth, agricultural employment, industrial development | Statistical yearbooks, census data [39] [42] |
| Climate | Temperature trends, precipitation patterns, extreme weather frequency | Meteorological stations, climate models [39] | |
| Pressures (P) | Water Quantity | Water extraction rates, irrigation demands, surface/groundwater usage | Water authorities, hydrological monitoring [39] [42] |
| Water Quality | Nutrient loading, pollutant discharges, sedimentation rates | Environmental monitoring networks [43] [42] | |
| Land Use | Agricultural expansion, urbanization, deforestation | Remote sensing, land cover maps [40] | |
| State (S) | Ecological | Habitat quality, biodiversity indices, fish community structure | Ecological surveys, satellite data [40] [43] |
| Hydrological | Water availability, flow regimes, groundwater levels | Hydrological monitoring networks [42] | |
| Water Quality | Nutrient concentrations, pollutant levels, turbidity | Water quality monitoring [43] [42] | |
| Impact (I) | Ecosystem Services | Water yield, carbon sequestration, erosion control, recreation | Modeling (InVEST, SWAT), surveys [40] [41] |
| Socio-economic | Agricultural productivity, human health, tourism revenue | Economic statistics, health records [39] | |
| Response (R) | Management | Irrigation efficiency improvements, land use regulations, water pricing | Policy documents, management plans [39] [44] |
The selection of appropriate indicators should be context-specific and consider data availability, relevance to decision-making, and sensitivity to management interventions. In the Zarrinehrud Basin case, researchers selected indicators that captured the key trade-offs between agricultural production, water resource availability, and ecological health [39].
Structured Protocol for AHP-DPSR Implementation
Phase 1: Problem Scoping and Stakeholder Engagement
- Step 1.1: Define the geographical boundaries of the river basin assessment and temporal scope of analysis
- Step 1.2: Identify key stakeholder groups (government agencies, water users, communities, NGOs) and establish participation mechanisms
- Step 1.3: Conduct preliminary scoping of key ecosystem services and management challenges through literature review and expert consultation
- Step 1.4: Formulate clear decision objectives and criteria for success
Phase 2: DPSIR System Characterization
- Step 2.1: Develop causal chains linking drivers to ultimate impacts on ecosystem services using expert workshops and systems thinking approaches
- Step 2.2: Select appropriate indicators for each DPSIR component based on data availability and relevance to decision context
- Step 2.3: Collect and process data for selected indicators, addressing gaps through modeling or proxy indicators where necessary
- Step 2.4: Validate the DPSIR conceptual model with stakeholders to ensure comprehensive representation of the system
Phase 3: AHP Hierarchy Construction and Weighting
- Step 3.1: Structure the AHP hierarchy with the overall goal at the top, DPSIR components as primary criteria, and specific indicators as sub-criteria
- Step 3.2: Develop pairwise comparison surveys for stakeholders to evaluate the relative importance of DPSIR components and indicators
- Step 3.3: Conduct consistency checks on stakeholder responses using Consistency Ratio (CR) calculation
- Step 3.4: Aggregate stakeholder preferences using appropriate methods (geometric mean, weighted average) to derive final weights
Phase 4: Trade-off Analysis and Scenario Evaluation
- Step 4.1: Develop alternative management scenarios based on different response strategies
- Step 4.2: Quantify the effects of each scenario on DPSIR indicators using biophysical modeling, expert judgment, or extrapolation from case studies
- Step 4.3: Calculate composite scores for each scenario by combining indicator performance with AHP-derived weights
- Step 4.4: Identify and visualize key trade-offs between ecosystem services and stakeholder groups
Phase 5: Strategy Selection and Implementation Planning
- Step 5.1: Compare scenario performance across multiple criteria (effectiveness, efficiency, equity, acceptability)
- Step 5.2: Conduct sensitivity analysis to test robustness of results to changes in weighting factors
- Step 5.3: Develop implementation roadmap for preferred strategies, including monitoring and adaptive management plan
The complete methodological workflow for implementing the AHP-DPSR framework is visualized below:
Figure 2: AHP-DPSR Implementation Workflow
Experimental Protocols and Methodological Guidelines
Protocol for DPSIR System Characterization
The foundation of a robust AHP-DPSR analysis lies in the systematic characterization of the causal relationships within the river basin system. The following protocol provides detailed methodological guidance:
Materials and Equipment:
- Geographic Information System (GIS) software with spatial analysis capabilities
- Statistical analysis software (R, SPSS, or equivalent)
- Stakeholder engagement facilities (meeting rooms, online collaboration tools)
- Data collection templates and database management system
Procedure:
Driver Identification: Conduct systematic literature review and expert consultation to identify primary socio-economic and environmental drivers affecting the river basin. Categorize drivers as direct (e.g., water extraction, land use change) or indirect (e.g., population growth, economic policies) [39] [42].
Pressure Analysis: Map the pathways through which drivers create pressures on the river basin ecosystem. Quantify pressure indicators using monitoring data, modeling outputs, or remote sensing products. For example, agricultural water demand can be quantified using crop water requirement models combined with land use data [39].
State Assessment: Evaluate the current condition of the river basin ecosystem using a combination of ecological, hydrological, and water quality indicators. Utilize standardized assessment methods where available, such as the Habitat Quality module in the InVEST model for ecological assessment or water quality indices for chemical status [40] [43].
Impact Quantification: Measure the effects of state changes on ecosystem services delivery. Employ ES modeling tools (e.g., InVEST, ARIES) or develop empirical relationships between state indicators and ES provision. For cultural services, implement social valuation methods such as surveys, participatory mapping, or value transfer [40] [41].
Response Inventory: Catalog existing and potential management responses, classifying them by type (regulatory, economic, technological, behavioral) and scale (local, regional, national). Document evidence of effectiveness from literature or case studies [39] [44].
Causal Network Development: Create a conceptual model linking drivers, pressures, state changes, impacts, and responses using systems thinking approaches. Validate the conceptual model through stakeholder workshops and expert review.
Quality Control Measures:
- Establish data quality standards for each indicator, including precision, accuracy, and completeness requirements
- Implement peer review process for causal diagrams and conceptual models
- Conduct sensitivity analysis to identify critical uncertainties in causal relationships
Protocol for AHP Hierarchy Development and Weighting
The AHP component transforms the qualitative DPSIR framework into a quantitative decision-support tool through systematic weighting of criteria and indicators.
Materials and Equipment:
- AHP software or statistical packages with AHP capabilities (Expert Choice, R 'ahp' package, Python 'pyAHP')
- Survey development and administration platform
- Data visualization tools for presenting results to stakeholders
Procedure:
Hierarchy Construction: Develop a multi-level hierarchy with the overall goal at the top level (e.g., "Sustainable River Basin Management"), DPSIR components at the second level, specific indicators at the third level, and management alternatives at the bottom level [13].
Pairwise Comparison Design: Create pairwise comparison matrices for elements at each level of the hierarchy. Use the standard 1-9 scale where 1 indicates equal importance and 9 indicates extreme importance of one element over another.
Stakeholder Recruitment and Survey Administration: Identify key stakeholder groups representing different perspectives (government, water users, environmental organizations, local communities). Implement stratified sampling to ensure balanced representation. Administer pairwise comparison surveys through workshops, interviews, or online platforms.
Consistency Assessment: Calculate consistency ratios (CR) for each respondent's pairwise comparison matrices using the formula:
where CI (Consistency Index) = (λmax - n) / (n - 1) and RI is the Random Index based on matrix size. Accept matrices with CR < 0.10; request revisions for matrices exceeding this threshold [13].
Weight Aggregation: Aggregate individual stakeholder judgments using the geometric mean method to develop group priority weights. Apply stakeholder weighting if different groups are assigned different levels of importance in the decision process.
Global Priority Calculation: Synthesize local priorities to calculate global weights for each indicator and alternative through hierarchical composition.
Quality Control Measures:
- Conduct pre-test of AHP survey with small group to identify and resolve comprehension issues
- Implement consistency checks with automatic flagging of inconsistent responses
- Document all weighting decisions and maintain audit trail for transparency
Protocol for Trade-off Analysis and Scenario Evaluation
The core analytical phase integrates the DPSIR assessment with AHP weighting to evaluate management alternatives and identify trade-offs.
Materials and Equipment:
- Multi-criteria decision analysis software
- Data visualization tools (Tableau, ggplot2, or equivalent)
- Scenario modeling capabilities (e.g., spatial explicit ES models, system dynamics models)
Procedure:
Scenario Development: Create a set of plausible management scenarios based on different response strategies. Scenarios should represent a range of approaches (business-as-usual, technological solutions, policy interventions, behavioral changes) and reflect different priorities among stakeholder groups [39] [40].
Impact Prediction: Estimate the effects of each scenario on DPSIR indicators using appropriate modeling techniques, expert elicitation, or analogies from case studies. For complex systems, employ integrated modeling approaches that capture feedback loops and cross-sectoral interactions.
Normalization: Transform indicator values to a common scale (0-1) to enable comparison across different measurement units. Use appropriate normalization methods (linear scaling, distance to reference, fuzzy membership functions) based on the nature of the indicators and decision context.
Score Calculation: Compute weighted composite scores for each scenario by combining normalized indicator values with AHP-derived weights using the additive aggregation model:
where wi is the weight of indicator i and xi is the normalized value of indicator i for the scenario.
Trade-off Identification: Analyze the distribution of benefits and costs across different ecosystem services and stakeholder groups. Use trade-off visualization techniques such as radar plots, parallel coordinate plots, or ecosystem service bundles mapping [40] [45].
Sensitivity Analysis: Test the robustness of scenario rankings to changes in weighting factors, normalization methods, and impact estimates. Use Monte Carlo simulation or one-at-a-time sensitivity analysis to identify critical assumptions.
Quality Control Measures:
- Document all assumptions used in scenario development and impact prediction
- Validate models against historical data where possible
- Engage stakeholders in interpreting trade-off analysis results
Successful application of the AHP-DPSR framework requires a combination of data sources, analytical tools, and methodological resources. The following table summarizes key resources for implementing the approach:
Table 2: Research Reagent Solutions for AHP-DPSR Implementation
| Tool Category | Specific Tool/Resource | Function/Purpose | Application Context |
|---|---|---|---|
| Ecosystem Service Modeling | InVEST (Integrated Valuation of Ecosystem Services and Tradeoffs) | Spatial modeling of multiple ecosystem services, habitat quality, carbon storage | Quantifying impacts of land use change on ES delivery [40] [41] |
| SolVES (Social Values for Ecosystem Services) | Mapping cultural ecosystem services based on social preferences | Assessing aesthetic, recreational, and cultural values [41] | |
| SWAT (Soil and Water Assessment Tool) | Hydrological modeling with water quality components | Assessing water yield, nutrient loading, sediment transport [42] | |
| Multi-criteria Analysis | Expert Choice, pyAHP, R 'ahp' package | Implementing Analytical Hierarchy Process | Calculating criterion weights, scenario ranking [13] |
| Ordered Weighted Averaging (OWA) | Multi-criteria decision making with different risk preferences | Exploring decision outcomes under varying optimism/pessimism [41] | |
| Data Collection & Processing | GIS Software (ArcGIS, QGIS) | Spatial data management, analysis, and visualization | Mapping ES hotspots, land use change, spatial trade-offs [40] [41] |
| Remote Sensing Data (Landsat, Sentinel) | Land cover classification, vegetation monitoring, change detection | Quantifying pressures and state changes over time [40] | |
| Stakeholder Engagement | Pairwise Comparison Surveys | Eliciting relative importance of criteria | AHP weighting based on stakeholder preferences [13] |
| Participatory Mapping | Identifying valued landscapes and ES hotspots | Incorporating local knowledge in assessment [46] | |
| Statistical Analysis | Self-Organizing Maps (SOM) | Pattern recognition in multivariate data | Identifying relationships between HIPPO factors and ecological indicators [43] |
| Correlation and Cluster Analysis | Identifying trade-offs and synergies among ES | Analyzing ES bundles and relationships [45] |
Key Findings and Implementation Insights from Case Applications
Efficacy of Different Intervention Types
Applications of the AHP-DPSR framework in river basins have yielded important insights regarding the relative effectiveness of different types of management interventions. In the Zarrinehrud Basin case study, systematic evaluation of 40 strategies revealed that interventions targeting "drivers" (e.g., shifting agricultural employment to other sectors) consistently outperformed those focused solely on "pressures" or "state" components [39]. Specifically, Strategy S39, which combined a 30% reduction in agricultural employment with promotion of industrial and tourism sectors, improved Water Resources and Environmental Carrying Capacity by 53% and achieved a balanced state by 2039 [39]. In contrast, conventional measures focusing solely on irrigation efficiency improvements failed to restore system balance, highlighting the importance of addressing fundamental drivers rather than symptoms.
These findings underscore the value of the AHP-DPSR framework in identifying systemic interventions that reorient socio-economic drivers rather than merely mitigating their pressures. The framework's structured approach enables decision-makers to move beyond technical fixes to address the root causes of ecosystem service degradation.
Managing ES Trade-offs through Spatial Planning
Spatial analysis integrated with the AHP-DPSR framework has proven particularly valuable for identifying and managing ES trade-offs across river basins. Research in regulated river areas has demonstrated that ES trade-offs vary significantly across spatial scales and landscape contexts, necessitating tailored management approaches rather than one-size-fits-all solutions [40]. The identification of ES "hotspots" (areas with high ES values) and "coldspots" (areas with low ES values) enables targeted interventions that maximize conservation effectiveness while minimizing costs [41].
In the Han River Basin case study, researchers developed and evaluated three management scenarios focusing on mixed forest planting and integration of ecological tourism and recreational facilities [40]. The optimal proportions of these interventions varied by trade-off type and land cover characteristics, as determined by ES evaluation scores, highlighting the importance of context-specific solutions [40]. The study further demonstrated that combining traditional conservation value assessment with detailed trade-off analysis enhanced the precision of ecosystem service assessment and management planning.
Addressing Implementation Challenges
Practical application of the AHP-DPSR framework has identified several implementation challenges that require methodological attention:
Stakeholder Representation: Ensuring balanced representation of all relevant stakeholder groups in the AHP weighting process remains challenging, particularly for marginalized communities with limited capacity for participation [46] [13]. Structured stakeholder analysis and proactive engagement strategies are essential for legitimate outcomes.
Data Integration: Combining biophysical monitoring data with socio-economic indicators and stakeholder preferences requires careful attention to scale mismatches, uncertainty propagation, and methodological consistency [45]. Developing standardized protocols for data collection and processing can enhance comparability across case studies.
Dynamic Interactions: Capturing feedback loops and time-lagged responses in the DPSIR framework presents conceptual and methodological challenges [39]. Incorporating dynamic modeling techniques, such as system dynamics or agent-based modeling, can enhance the framework's ability to represent complex system behavior.
Despite these challenges, the AHP-DPSR framework provides a robust foundation for structured decision-making in complex river basin management contexts, particularly when implemented as part of an adaptive management cycle with continuous monitoring and periodic reassessment.
The AHP-DPSR framework represents a significant methodological advancement in ecosystem services assessment, providing a structured approach for analyzing complex trade-offs and prioritizing management interventions in river basins. By integrating the causal pathways of the DPSIR model with the multi-criteria decision-making capabilities of AHP, the framework supports transparent, participatory, and evidence-based decision-making that can accommodate diverse stakeholder perspectives and value systems.
Case study applications have demonstrated the framework's practical utility for identifying intervention points that address root causes rather than symptoms, spatial targeting of management actions, and evaluating trade-offs across environmental, social, and economic dimensions. The framework's adaptability to different geographical contexts and decision scales offers promising potential for transferability to other complex environmental management challenges.
Future research should focus on enhancing the dynamic capabilities of the framework, improving methods for representing uncertainty, developing more sophisticated approaches for aggregating diverse stakeholder values, and strengthening the links between ES assessment and human well-being outcomes. As pressure on freshwater resources intensifies due to climate change and increasing human demands, structured decision-support approaches like AHP-DPSR will become increasingly essential for navigating difficult trade-offs and guiding river basins toward sustainable trajectories.
Application Notes
The development of a composite Ecosystem Services (ES) index using stakeholder-defined Analytical Hierarchy Process (AHP) weights represents a sophisticated methodological approach for integrating diverse ecological, economic, and social dimensions into a unified sustainability assessment framework. This approach is particularly valuable for translating complex, multi-dimensional ecosystem data into actionable information for policymakers, land-use planners, and conservation managers. The core strength of this methodology lies in its ability to systematically combine scientific biophysical data with subjective stakeholder preferences, creating a more holistic and socially relevant assessment tool that balances technical accuracy with practical applicability [47] [48].
The conceptual foundation for this approach typically follows the Driving force-Pressure-State-Response (DPSR) framework or similar structured models that organize indicators into logical categories representing causes, effects, and management interventions. Within this framework, the AHP method introduces a rigorous, mathematically-grounded procedure for weighting different indicators according to their perceived importance by relevant stakeholders, which may include academic experts, government authorities, community representatives, and industry professionals [49] [50]. This participatory weighting process helps ensure that the resulting composite index reflects the values and priorities of those who affect or are affected by ecosystem management decisions, thereby enhancing the legitimacy and practical implementation of assessment outcomes.
Key Applications in Ecosystem Services Research
The integrated AHP-ES methodology has been successfully applied across diverse ecological and institutional contexts. In the Liaohe River Basin in China, researchers employed an AHP-DPSR model to assess ecosystem health trends from 2005 to 2020, incorporating 29 indicators across driving, pressure, state, and response categories. Their analysis revealed an overall improvement in ecosystem health levels during the study period and identified specific regions (Gongzhuling City, Dongliao County, Xi'an District, and Longshan District) as priority areas for ecological management based on spatial autocorrelation analysis [49]. This application demonstrated how the methodology can support targeted conservation interventions by identifying spatial patterns and temporal trends in ecosystem condition.
In Portugal, the approach was used to develop the novel ASEBIO index (Assessment of Ecosystem Services and Biodiversity), which integrated eight multi-temporal ES indicators based on CORINE Land Cover data with stakeholder preferences defined through AHP. This research revealed a significant finding: stakeholders consistently overestimated ES potential by approximately 32.8% compared to model-based assessments, with the largest disparities occurring for drought regulation and erosion prevention services [47]. This discrepancy highlights the critical importance of bridging perceptual gaps between scientific models and human judgment in environmental management.
For traditional agricultural systems, such as China's Mulberry-Dyke and Fish-Pond System, the integration of AHP-weighted ES indices with land-use scenario analysis has helped balance competing objectives of ecological conservation, agricultural productivity, and cultural preservation. Researchers quantified six major ecosystem services, finding that water purification provided the highest average value while mulberry supply yielded the lowest [48]. By incorporating perspectives from different stakeholder groups, the study developed spatially-optimized scenarios that either sustainably intensified production, increased landscape multifunctionality, or restored ecological integrity in different portions of the study area.
Table 1: Representative Applications of Composite ES Indices with AHP Weighting
| Location/System | Index Name | Key Indicators | Stakeholder Groups | Primary Findings |
|---|---|---|---|---|
| Liaohe River Basin, China | Ecosystem Health Index (AHP-DPSR) | 29 indicators across driving, pressure, state, response categories | Not specified | Ecosystem health improved from 2005-2020; spatial autocorrelation identified priority regions for management [49] |
| Portugal | ASEBIO Index | 8 ES indicators including drought regulation, erosion prevention, water purification, recreation | Academic researchers, government officials, sectoral representatives | Stakeholders overestimated ES potential by 32.8% compared to models; largest gaps in drought regulation and erosion prevention [47] |
| Mulberry-Dyke and Fish-Pond System, China | Landscape Multifunctionality Index | 6 ES including water purification, mulberry supply, habitat quality, carbon storage | Farmers, resource managers, conservationists, policymakers | Water purification highest value; mulberry supply lowest; spatial optimization revealed different zones for different management objectives [48] |
| Aburrá Valley, Colombia | Sustainable Development Index | 28 indicators across social, economic, environmental, institutional dimensions | Expert-defined indicators | Health, employment, and education indicators received highest weights; environmental indicators received lowest weights [51] |
| United Kingdom | Water-Energy-Food Resilience Index | Availability and accessibility indicators for WEF resources | Sectoral experts | Combined availability indicators with household accessibility indicators to measure resilience in industrialized nations [52] |
Experimental Protocols
Indicator Selection and Framework Development
The initial phase involves establishing a comprehensive conceptual framework and selecting appropriate indicators that collectively represent the multifaceted nature of ecosystem services. Researchers should:
Define Assessment Boundaries: Clearly delineate spatial boundaries (e.g., watershed, administrative region, landscape unit) and temporal scope for the assessment [49] [53].
Establish Conceptual Framework: Adopt or adapt an existing conceptual framework such as DPSR (Driving force-Pressure-State-Response) that organizes indicators into logical categories representing causes, effects, and management responses [49].
Select Indicator Portfolio: Identify a balanced set of indicators that cover provisioning, regulating, cultural, and supporting ecosystem services. The number of indicators should be comprehensive yet manageable, typically between 8-30 indicators. Selection criteria should include scientific relevance, measurability, sensitivity to change, and stakeholder relevance [49] [51] [53].
Normalize Indicator Data: Transform all indicators to a common scale (typically 0-1) to enable aggregation. Common approaches include min-max normalization, z-scores, or distance to reference values [51].
Table 2: Exemplar Ecosystem Service Indicators for Composite Index Development
| ES Category | Specific Indicators | Measurement Approaches | Data Sources |
|---|---|---|---|
| Provisioning Services | Food production | Yield statistics, market values | Agricultural census, remote sensing |
| Water supply | Water yield models | InVEST model, hydrological data [53] | |
| Regulating Services | Carbon storage | Carbon sequestration models | InVEST model, soil surveys [53] |
| Erosion prevention | Sediment retention models | InVEST, RUSLE [53] | |
| Climate regulation | Temperature modulation, carbon storage | Climate models, land cover data | |
| Drought regulation | Water retention capacity | Soil surveys, land cover analysis | |
| Water purification | Nutrient retention models | InVEST model, water quality data [48] | |
| Habitat Services | Habitat quality | Species diversity, habitat connectivity | InVEST model, field surveys [53] |
| Pollination | Pollinator abundance, habitat suitability | Land cover analysis, species distribution models | |
| Cultural Services | Recreation | Accessibility to natural areas, tourism statistics | Surveys, visitor counts, social media data |
Stakeholder Identification and AHP Survey Design
The stakeholder weighting process requires careful design and execution:
Stakeholder Identification and Classification: Identify relevant stakeholder groups that represent diverse perspectives on ecosystem management. Common categories include:
Sample Size Determination: Aim for a balanced representation across stakeholder groups. Literature suggests approximately 15-20 participants per group provides stable results, with total sample sizes often ranging from 30-60 participants [50].
Hierarchy Structure Development: Organize indicators into a hierarchical structure with the overall goal (composite ES index) at the top, followed by dimensions or criteria categories, and the specific indicators at the lowest level [50].
Pairwise Comparison Design: Develop a survey instrument that presents stakeholders with pairwise comparisons of all indicators within the same hierarchical level. The comparison should use the standard AHP scale ranging from 1 (equal importance) to 9 (extreme importance of one element over another) [50].
Survey Implementation: Conduct surveys through structured interviews, workshops, or online platforms. Provide clear instructions and explanations of each indicator to ensure consistent understanding across participants [50].
AHP Weight Calculation and Consistency Validation
The computational phase involves processing the stakeholder inputs to derive weights:
Pairwise Comparison Matrix Construction: For each stakeholder, construct a reciprocal pairwise comparison matrix A = [aij] where aij represents the relative importance of indicator i compared to indicator j [50].
Eigenvector Calculation: Compute the principal eigenvector of each pairwise comparison matrix to obtain the relative weights of indicators. This is typically done by solving the equation: (A - λmaxI)w = 0, where λmax is the largest eigenvalue and w is the corresponding eigenvector [50].
Consistency Assessment: Calculate the Consistency Ratio (CR) to identify contradictory judgements using the formula: CR = CI/RI, where CI = (λmax - n)/(n - 1) and RI is the random index. A CR value ≤ 0.10 is generally acceptable; higher values require revision of pairwise comparisons [50].
Aggregation of Individual Judgements: Combine individual stakeholder weights using either the aggregation of individual judgements (AIJ) or aggregation of individual priorities (AIP) approaches. The geometric mean method is commonly recommended for this purpose [50].
Sensitivity Analysis: Test the robustness of the weighting results by examining how changes in weights affect the final composite index rankings or scores [51].
Composite Index Construction and Validation
The final phase integrates the weighted indicators into a comprehensive index:
Weighted Linear Aggregation: Combine the normalized indicator values using the AHP-derived weights to calculate the composite index score for each spatial unit or time period using the formula: [ IESI = \sum{i=1}^{n} wi \times x_i ] where wi is the weight of indicator i and xi is the normalized value of indicator i [51].
Spatial Explicit Mapping: Use Geographic Information Systems (GIS) to visualize the spatial distribution of the composite index across the study area, identifying hotspots and coldspots of ecosystem service provision [49] [53].
Temporal Trend Analysis: Calculate the index for multiple time periods to assess trajectories of change and identify emerging patterns or transitions [49] [53].
Validation and Uncertainty Analysis: Compare index results with independent measures of ecosystem condition or expert evaluations. Conduct uncertainty analysis to understand how measurement errors and weighting decisions affect index outcomes [47].
Policy Scenario Testing: Use the composite index to evaluate alternative management scenarios or policy options, assessing their potential impacts on overall ecosystem service provision [54] [48].
Visualization
Workflow Diagram
Workflow for Composite ES Index Development with AHP Weighting
The Scientist's Toolkit
Research Reagent Solutions
Table 3: Essential Tools and Methods for Composite ES Index Development
| Tool/Method | Category | Primary Function | Application Context |
|---|---|---|---|
| InVEST Model Suite | Biophysical Modeling | Spatially explicit quantification of multiple ecosystem services | Calculating water yield, carbon storage, habitat quality, sediment retention [47] [53] |
| CORINE Land Cover | Spatial Data | Standardized land use/land cover classification | Primary input for modeling ES provision based on land cover [47] |
| AHP Software | Decision Support | Facilitates pairwise comparisons and weight calculation | Expert Choice, SuperDecisions, or custom R/Python implementations [50] |
| RUSLE Model | Biophysical Modeling | Estimates soil loss and conservation potential | Calculating soil conservation service indicator [53] |
| GIS Platform | Spatial Analysis | Spatial data management, analysis, and visualization | ArcGIS, QGIS for mapping ES and composite indices [49] |
| Principal Component Analysis | Statistical Analysis | Alternative objective weighting method for comparison | Validating AHP weights or constructing integrated indices [53] |
| Delphi Technique | Stakeholder Engagement | Structured communication process for expert consensus | Preliminary indicator selection or validation of results [55] |
| S-LCA Framework | Assessment Framework | Social Life Cycle Assessment guidelines | Identifying stakeholder groups and social impact categories [50] |
Navigating Challenges and Enhancing AHP Model Reliability
Managing and Interpreting the Consistency Ratio (CR) for Valid Results
The Analytical Hierarchy Process (AHP) serves as a powerful multi-criteria decision analysis (MCDA) tool, particularly valuable within the complex domain of ecosystem services assessment. This methodology enables researchers to systematically evaluate trade-offs among diverse ecosystem services by decomposing complex decisions into hierarchical structures and comparing elements in a pairwise fashion. The core strength of AHP lies in its capacity to translate both quantitative and qualitative judgments into a coherent analytical framework, making it exceptionally suitable for environmental management problems where ecological production functions intersect with social benefit valuation [56]. Within this structured decision-making context, the Consistency Ratio (CR) emerges as a critical diagnostic tool, ensuring that the subjective judgments provided by experts and stakeholders maintain logical coherence throughout the evaluation process. The CR fundamentally measures the degree of consistency inherent in the pairwise comparison matrices, serving as an indicator of judgment reliability and thus validating the entire decision-making framework for ecological restoration planning and ecosystem service prioritization.
The theoretical underpinning of the consistency ratio derives from matrix algebra and eigenvector theory. When decision-makers provide perfectly consistent judgments in pairwise comparison matrices, the principal eigenvalue (λmax) equals the matrix size (n). As inconsistencies naturally emerge in human judgment, λmax exceeds n, with the magnitude of this deviation forming the basis for consistency measurement. The Consistency Index (CI) quantifies this deviation through the formula CI = (λmax - n)/(n - 1), representing the degree of departure from perfect consistency. The CR then normalizes this value against the Random Index (RI), which represents the average consistency of randomly generated reciprocal matrices of the same size, yielding the final formula CR = CI/RI. This normalization process enables cross-study comparisons and establishes universal thresholds for acceptable consistency, creating a standardized metric for evaluating judgment quality across diverse ecosystem service assessment contexts, from wetland restoration prioritization to watershed management decisions [56].
Experimental Protocols and Calculation Methodologies
Establishing the Pairwise Comparison Matrix
The initial protocol requires constructing a reciprocal pairwise comparison matrix that captures expert judgments regarding the relative importance of ecosystem service criteria. Researchers must first define the decision hierarchy, with overall objectives at the top level, evaluation criteria at intermediate levels, and decision alternatives at the bottom level, following the structured decision making framework exemplified in ecosystem services assessment [56]. For each element at a given hierarchy level, experts provide numerical judgments using the fundamental 1-9 scale, where 1 indicates equal importance between two elements and 9 represents the absolute importance of one element over another. The resulting matrix A = [aij] is positive and reciprocal, meaning aji = 1/aij for all i,j. In practical terms for ecosystem services assessment, this might involve comparing the relative importance of flood water retention against scenic landscapes, or learning opportunities against recreational amenities, with each judgment capturing the perceived relative value of these services in the specific environmental context [56].
The procedural protocol demands meticulous execution: (1) Assemble a multidisciplinary expert panel comprising ecologists, social scientists, and relevant stakeholders; (2) Conduct the pairwise comparison process through structured facilitation to ensure independent judgments; (3) Utilize a standardized data collection instrument, typically a questionnaire format with clear instructions; (4) Verify the completeness of all pairwise comparisons for each level of the hierarchy; (5) Record all judgments in a matrix format for subsequent computational analysis. This methodology proved essential in the Woonasquatucket River watershed case study, where researchers partnered with the local watershed management organization to analyze dozens of candidate wetland restoration sites for their abilities to supply five ecosystem services – flood water retention, scenic landscapes, learning opportunities, recreational opportunities, and birds [56]. The careful execution of this protocol established the foundation for meaningful consistency assessment in their ecosystem services valuation.
Computational Procedure for Consistency Ratio
The calculation of the Consistency Ratio follows a rigorous computational protocol that transforms the subjective pairwise comparison matrix into an objective measure of judgment consistency. The multi-step computational procedure begins with the normalization of the pairwise comparison matrix, where each element is divided by the sum of its column, creating a normalized matrix. The next step involves calculating the priority vector (eigenvector approximation) by averaging across the rows of this normalized matrix, which represents the relative weights of the criteria or alternatives. The computation then proceeds to determine the weighted sum vector by multiplying the original pairwise comparison matrix by the priority vector. The subsequent step involves calculating the principal eigenvalue (λmax) by summing the products of the weighted sum vector and the reciprocal of the priority vector, divided by the number of elements (n).
The protocol continues with the computation of the Consistency Index (CI) using the standard formula CI = (λmax - n)/(n - 1), which quantifies the deviation from perfect consistency. The final computational step involves determining the Consistency Ratio (CR) by dividing the CI by the appropriate Random Index (RI) value corresponding to the matrix size, where RI represents the average consistency of random matrices. The established RI values for different matrix sizes (n) are: n=1: RI=0.00; n=2: RI=0.00; n=3: RI=0.58; n=4: RI=0.90; n=5: RI=1.12; n=6: RI=1.24; n=7: RI=1.32; n=8: RI=1.41; n=9: RI=1.45; n=10: RI=1.49. The interpretation threshold follows the standard convention: CR ≤ 0.10 indicates acceptable consistency, while CR > 0.10 necessitates revision of the pairwise comparisons. This computational protocol must be meticulously followed to ensure the validity of the resulting priority weights in ecosystem service assessments.
Table 1: Random Index Values for Different Matrix Sizes
| Matrix Size (n) | Random Index (RI) |
|---|---|
| 1 | 0.00 |
| 2 | 0.00 |
| 3 | 0.58 |
| 4 | 0.90 |
| 5 | 1.12 |
| 6 | 1.24 |
| 7 | 1.32 |
| 8 | 1.41 |
| 9 | 1.45 |
| 10 | 1.49 |
Visualization of Workflow and Logical Relationships
The AHP consistency assessment methodology can be effectively visualized through a structured workflow that captures the logical relationships between each computational phase. The following diagram illustrates the complete protocol from matrix establishment through consistency interpretation, highlighting critical decision points and feedback loops for judgment refinement.
AHP Consistency Assessment Workflow
The visualization above demonstrates the sequential protocol for consistency ratio calculation, emphasizing the iterative nature of the process when judgments require refinement. This workflow aligns with the structured decision making approach advocated for ecosystem services assessment, where transparency and methodological rigor are paramount for credible results [56]. The color scheme ensures sufficient contrast between foreground elements and their backgrounds in accordance with WCAG 2 AA contrast ratio thresholds, maintaining accessibility standards throughout the visualization [57] [58].
Interpretation Framework and Threshold Management
Consistency Ratio Interpretation Protocol
The interpretation of the Consistency Ratio requires a nuanced approach that balances mathematical precision with practical decision-making contexts. The established protocol mandates that CR values exceeding the 0.10 threshold necessitate revision of the pairwise comparison judgments, as this indicates a potentially problematic level of inconsistency that could compromise the resulting priorities. However, experienced practitioners in ecosystem services assessment recognize that certain conditions may warrant careful deviation from this rigid threshold. The interpretation protocol should include these sequential steps: (1) Calculate the exact CR value using the prescribed computational method; (2) For CR ≤ 0.10, proceed with confidence in the derived priority weights; (3) For 0.10 < CR ≤ 0.20, evaluate the decision context—in some exploratory research phases or highly complex ecosystem service trade-offs, slightly elevated CR might be justifiably accepted with appropriate documentation; (4) For CR > 0.20, mandatory revision is required as the judgments contain substantial inconsistencies; (5) Document all CR values and any decisions regarding threshold application for methodological transparency.
This interpretation framework proved valuable in the Woonasquatucket River watershed case study, where researchers developed 22 benefit indicators related to ecosystem services and needed to aggregate diverse values into a decision support tool [56]. The complexity of comparing disparate benefit indicators—from flood water retention to scenic landscapes and learning opportunities—naturally introduced judgment challenges that required a pragmatic approach to consistency assessment while maintaining scientific rigor. The documentation of consistency ratios across multiple expert panels enabled researchers to identify specific comparison patterns that consistently generated higher inconsistencies, leading to refined data collection instruments and improved facilitator guidance for subsequent assessment rounds.
Strategies for Managing Excessive Consistency Ratios
When CR values exceed acceptable thresholds, researchers must implement systematic protocols to identify and resolve inconsistency sources. The revision protocol follows a structured approach: (1) Identify the most inconsistent judgments by examining the difference between the original pairwise comparison matrix and the consistent matrix derived from the priority vector; (2) Focus revision efforts on matrix elements with the largest consistency deviations; (3) Re-engage with domain experts to review these specific comparisons, providing them with their original responses and the mathematical implications; (4) Guide experts through a reflection process on their judgments without imposing external preferences; (5) Recalculate the CR with revised judgments and iterate until acceptable consistency is achieved. This process respects the foundational AHP principle that while the methodology provides mathematical rigor, the substantive judgments must originate from domain expertise, particularly crucial in complex ecosystem service assessments where ecological production functions intersect with social benefit valuation [56].
Advanced management strategies include implementing a pre-consistency calibration phase during expert panel formation, where participants practice pairwise comparisons with sample elements and receive immediate feedback on their consistency patterns. Additionally, researchers can employ sensitivity analysis to determine how specific judgment revisions impact both consistency and the resulting priority rankings, enabling targeted improvement efforts. In the context of ecosystem services assessment, where criteria may include both biophysical measurements (flood water retention capacity) and social valuations (scenic quality), inconsistency often arises when experts mentally apply different valuation frameworks across criteria categories. Explicitly surfacing these implicit frameworks during the judgment process can substantially improve consistency while maintaining the richness of multidisciplinary perspectives [56].
Table 2: Consistency Ratio Troubleshooting Guide
| CR Range | Interpretation | Recommended Action |
|---|---|---|
| CR ≤ 0.10 | Acceptable consistency | Proceed with analysis; document results |
| 0.10 < CR ≤ 0.15 | Marginal consistency | Review specific inconsistent judgments; revise if time permits |
| 0.15 < CR ≤ 0.20 | Questionable consistency | Identify and revise 3-5 most inconsistent judgments |
| CR > 0.20 | Unacceptable consistency | Systematic revision required; potentially reconvene experts |
The Scientist's Toolkit: Research Reagent Solutions
The effective implementation of AHP with robust consistency assessment requires both computational tools and methodological frameworks. The following research reagents represent essential components for rigorous ecosystem services assessment using AHP methodology.
Table 3: Essential Research Reagents for AHP Consistency Management
| Research Reagent | Function | Application Notes |
|---|---|---|
| Pairwise Comparison Survey Instrument | Captures expert judgments using standardized scale | Should include clear instructions and practice items; digital formats enable real-time consistency feedback |
| Random Index (RI) Reference Table | Provides normalization values for CR calculation | Essential for interpreting CI values; must use values corresponding to matrix size (n) |
| Consistency Threshold Framework | Guides interpretation of CR results | Default threshold of 0.10 with documented exceptions for complex decision contexts |
| Judgment Revision Protocol | Systematic approach for improving inconsistent matrices | Focuses on most problematic comparisons; maintains expert judgment integrity |
| Priority Vector Calculator | Computes relative weights from pairwise comparisons | Multiple computation methods available: eigenvector, geometric mean, or approximation algorithms |
| Sensitivity Analysis Module | Tests robustness of results to judgment variations | Identifies critically influential comparisons; supports result validation |
| Expert Panel Composition Framework | Guidelines for multidisciplinary participant selection | Ensures comprehensive perspective representation in ecosystem service assessments |
| AHP Software Environment | Computational implementation of AHP algorithms | Ranges from specialized AHP software to custom implementations in R, Python, or MATLAB |
Application in Ecosystem Services Assessment
The integration of rigorous consistency management within AHP proves particularly valuable in ecosystem services assessment, where decision complexity naturally challenges judgment consistency. The application protocol requires adapting the general AHP methodology to the specific characteristics of ecosystem service valuation, which often involves integrating biophysical data with socio-economic preferences. Researchers should structure the AHP hierarchy to reflect the ecosystem services cascade framework, connecting ecosystem functions to human wellbeing benefits through a logically coherent hierarchy [56]. In the Woonasquatucket River watershed case study, this approach enabled the comparison of wetland restoration sites across urban and non-urban contexts, revealing that restoration sites in urban areas can provide greater social benefits than sites in less urban areas—a counterintuitive finding that emerged only through careful weighting of diverse evaluation criteria [56].
The protocol further specifies that consistency assessment must occur at multiple hierarchy levels: within criteria affecting specific ecosystem services, across ecosystem service categories, and between ecological and social objectives. This multi-level consistency verification ensures coherent valuation throughout the decision structure. When applying AHP to ecosystem services assessment, researchers should document not only the final consistency ratios but also the patterns of inconsistency observed across expert groups, as these patterns often reveal fundamental tensions in how different disciplines conceptualize and value ecosystem services. This documentation enhances methodological transparency and provides valuable insights for future ecosystem service assessments using structured decision making approaches [56]. The rigorous management of consistency ratios transforms AHP from a simple weighting tool into a robust framework for navigating the complex trade-offs inherent in environmental management, particularly when balancing ecological integrity with social equity objectives in restoration planning.
Best Practices for Selecting and Defining Relevant ES Criteria and Sub-criteria
The foundation of a robust Analytical Hierarchy Process (AHP) application in ecosystem services (ES) assessment lies in the careful selection and definition of criteria and sub-criteria. This structured approach transforms a complex decision problem into a hierarchical framework, enabling the systematic evaluation of trade-offs and synergies between multiple ecosystem services. The AHP, a multi-criteria decision analysis (MCDA) technique developed by Thomas Saaty, is particularly valuable in environmental decision-making contexts where objectives are often conflicting and involve both quantitative and qualitative factors [4] [50]. By breaking down the complex problem of ecosystem service valuation into a hierarchical structure, researchers can establish clear relationships between the overall goal, various criteria representing different ecosystem services, and potential management alternatives [59] [60].
The process of selecting relevant criteria is critical because it directly influences the outcome of the assessment and ensures that the results are aligned with the fundamental goal of sustainable ecosystem management. In the context of ecosystem services, criteria typically represent the different categories of services being assessed—such as provisioning, regulating, cultural, and supporting services—while sub-criteria provide more specific, measurable components within these broader categories. This hierarchical structuring allows decision-makers to comprehensively capture the multi-dimensional nature of ecosystem services and their importance to different stakeholder groups, from local communities to policymakers [16] [50].
Conceptual Framework for Criteria Selection
Foundational Principles for Criteria Development
Establishing a conceptually sound set of criteria requires adherence to several foundational principles that ensure the resulting framework is both scientifically rigorous and practically applicable. The System of Environmental Economic Accounting - Ecosystem Accounting (SEEA EA), developed by the United Nations, provides a comprehensive framework for selecting ecosystem condition indicators based on twelve criteria categorized into conceptual and practical roles [61]. Conceptually, criteria must demonstrate relevance and meaning by accurately representing key ecosystem attributes and their relationship to ecosystem services. Practically, criteria should focus on validity and simplicity, ensuring they can be operationalized with available data and methodologies while remaining understandable to stakeholders.
When defining criteria for AHP applications in ecosystem services assessment, researchers should prioritize comprehensiveness and conciseness—striving to include all ecologically significant aspects while avoiding redundant or overlapping metrics [61]. This balance is essential for creating a manageable hierarchical structure that does not overwhelm decision-makers with excessive pairwise comparisons. Each criterion must be clearly defined with unambiguous boundaries to ensure consistent interpretation throughout the assessment process. Furthermore, criteria should be mutually exclusive at each level of the hierarchy to prevent double-counting of benefits or impacts during the evaluation phase [50].
Integration of Stakeholder Perspectives
The integration of diverse stakeholder perspectives is a critical component of criteria selection in ecosystem services assessment. Different stakeholder groups—including academic researchers, government authorities, industry representatives, and local communities—often prioritize different ecosystem services based on their values, needs, and dependencies [16] [50]. Participatory approaches to criteria selection enhance the legitimacy and practical applicability of the AHP assessment by ensuring that the criteria reflect the full spectrum of societal values associated with ecosystem services.
Research on mobility services using AHP demonstrated that while some indicators showed clear prioritization across different expert groups, others revealed significant differences in perceived importance [50]. For instance, in a study involving 48 experts from academic institutions, city authorities, and mobility service providers, similarities and differences in weighting preferences emerged across stakeholder groups, highlighting the importance of inclusive criteria development processes. This participatory analysis enriches the decision-making framework by incorporating transparent weighting of different social and ecological indicators, making trade-offs between competing objectives explicit and defensible [16].
Methodological Protocol for Criteria Selection
Systematic Criteria Identification Process
The identification of relevant criteria and sub-criteria for ecosystem services assessment should follow a systematic, multi-stage process to ensure comprehensive coverage of all relevant ecosystem services while maintaining practical feasibility. The initial stage involves literature review and document analysis of existing ecosystem service classification systems, such as the Common International Classification of Ecosystem Services (CICES), the Millennium Ecosystem Assessment framework, and relevant national or regional ecosystem accounting frameworks [61]. This review provides a foundation of potentially relevant criteria that have been validated in previous research or policy contexts.
Subsequently, expert consultation through workshops, interviews, or structured surveys helps refine the initial list of criteria based on contextual factors and domain knowledge. For example, in forest landscape management planning, criteria were identified through engagement with forestry experts, ecologists, and local stakeholders to ensure they captured the most relevant ecosystem services for the specific context, including timber production, wildfire resistance, biodiversity conservation, and recreational value [16]. The final stage involves stakeholder validation to confirm that the selected criteria adequately represent the values and priorities of all relevant stakeholder groups, with particular attention to marginalized or vulnerable communities whose perspectives might otherwise be overlooked.
Table 1: Selection Criteria for Ecosystem Condition Indicators Based on SEEA EA Framework
| Criterion Category | Specific Criterion | Description |
|---|---|---|
| Conceptual Criteria | Relevance | Direct relationship to ecosystem characteristics and services |
| Scientific Basis | Grounding in established ecological theory and empirical research | |
| Completeness | Coverage of all relevant aspects of ecosystem condition | |
| Specificity | Clear definition with unambiguous interpretation | |
| Practical Criteria | Measurability | Feasibility of quantification with available methods |
| Cost-effectiveness | Reasonable resource requirements for data collection | |
| Sensitivity | Responsiveness to changes in ecosystem condition | |
| Timeliness | Availability of data within relevant timeframes | |
| Cross-cutting Criteria | Compatibility | Alignment with existing monitoring frameworks |
| Scalability | Applicability across different spatial and temporal scales | |
| Interpretability | Understandability to diverse stakeholder audiences | |
| Utility | Value for decision-making processes |
Hierarchical Structuring of Criteria and Sub-criteria
Once a comprehensive list of potential criteria has been identified, the next step involves organizing them into a logical hierarchical structure that facilitates pairwise comparisons in the AHP methodology. The hierarchy typically begins with the overall goal at the top level (e.g., "Optimal Ecosystem Management Strategy"), followed by primary criteria representing major categories of ecosystem services at the second level, sub-criteria providing more specific components at the third level, and finally the management alternatives at the base level [4] [60].
The development of this hierarchy requires careful consideration of the relationships between criteria to ensure that each level logically decomposes the elements of the level above. For instance, a criterion for "Regulating Services" might be decomposed into sub-criteria for "Carbon Sequestration," "Water Purification," "Erosion Control," and "Pollination," each of which can be measured using specific indicators [16] [61]. This hierarchical structuring serves as the foundation for the pairwise comparison process in AHP, allowing decision-makers to focus on comparing only two elements at a time, which reduces cognitive complexity and improves the consistency of judgments [59] [50].
Experimental Protocols for AHP Implementation
Pairwise Comparison and Weighting Protocol
The core methodological protocol for implementing AHP in ecosystem services assessment involves systematic pairwise comparisons to derive criterion weights. This process requires decision-makers to compare each pair of criteria at the same hierarchical level using a structured scale, typically Saaty's 1-9 scale of relative importance [4] [50]. The protocol begins with the development of a pairwise comparison matrix for each set of criteria or sub-criteria, where each element aij represents the relative importance of criterion i compared to criterion j. Reciprocal values (1/2 to 1/9) are automatically assigned to the opposite comparisons to maintain mathematical consistency.
The experimental sequence proceeds as follows: (1) Matrix Setup - Construct an n×n matrix for n criteria at each level of the hierarchy; (2) Judgment Collection - Elicit comparative judgments from decision-makers or stakeholders for each pair of criteria; (3) Eigenvector Calculation - Compute the principal eigenvector of each comparison matrix to estimate the relative weights of criteria; (4) Consistency Assessment - Calculate the consistency ratio (CR) to evaluate the coherence of judgments, with CR < 0.10 generally considered acceptable; (5) Weight Aggregation - Synthesize weights across all levels of the hierarchy to determine global priorities for each alternative [59] [4] [50]. For group decision-making, individual judgments can be aggregated using the geometric mean method to preserve the reciprocal property of pairwise comparison matrices.
Table 2: Saaty's Fundamental Scale for Pairwise Comparisons
| Intensity of Importance | Definition | Explanation |
|---|---|---|
| 1 | Equal importance | Two criteria contribute equally to the objective |
| 3 | Moderate importance | Experience and judgment slightly favor one criterion |
| 5 | Strong importance | Experience and judgment strongly favor one criterion |
| 7 | Very strong importance | One criterion is favored very strongly over another |
| 9 | Extreme importance | The evidence favoring one criterion is of the highest possible order |
| 2, 4, 6, 8 | Intermediate values | Used when compromise is needed between judgments |
| Reciprocals | Reciprocals for inverse comparisons | If criterion i has intensity x compared to j, then j has intensity 1/x compared to i |
Consistency Verification Protocol
Maintaining logical consistency in pairwise comparisons is essential for generating reliable weights in AHP applications. The consistency verification protocol involves calculating a consistency ratio (CR) that measures the degree of consistency in the pairwise comparison matrix relative to a random matrix [4]. The experimental steps for consistency verification are: (1) Compute the principal eigenvalue (λmax) of the pairwise comparison matrix; (2) Calculate the consistency index (CI) using the formula CI = (λmax - n)/(n - 1), where n is the number of criteria being compared; (3) Determine the random index (RI) value from standard tables based on matrix size; (4) Compute the consistency ratio as CR = CI/RI.
When the calculated CR exceeds the threshold of 0.10, the protocol requires a judgment revision process where decision-makers review and adjust their most inconsistent comparisons. This iterative refinement continues until an acceptable consistency ratio is achieved, ensuring that the derived weights reflect coherent value judgments rather than random or contradictory preferences [4] [60]. Documentation of both initial and revised comparisons provides transparency about the decision-making process and enhances the credibility of the final results.
The Scientist's Toolkit: Research Reagent Solutions
Table 3: Essential Tools and Methods for AHP in Ecosystem Services Research
| Tool Category | Specific Tool/Software | Function in AHP Implementation |
|---|---|---|
| AHP Software Solutions | Expert Choice | Commercial software with user-friendly interface for building decision hierarchies, conducting pairwise comparisons, and analyzing results [4] |
| SpiceLogic AHP Software | Wizard-based software for modeling AHP step by step, with features for consistency checking and sensitivity analysis [60] | |
| Prioritization Helper | Cloud-based AHP application integrated with Salesforce platform for collaborative decision-making [4] | |
| Statistical Packages | R (decisionSupport, ahp) | Open-source statistical programming environment with specialized packages for AHP implementation and visualization |
| Python (pyDecision, AHP) | Programming language with libraries for AHP calculations and integration with other data analysis workflows | |
| Stakeholder Engagement Tools | Online Survey Platforms (LimeSurvey, Qualtrics) | Digital tools for distributing pairwise comparison questionnaires to expert stakeholders [50] |
| Workshop Facilitation Kits | Structured protocols for conducting group pairwise comparison sessions in participatory settings | |
| Ecosystem Service Assessment Frameworks | SEEA Ecosystem Accounting | UN framework providing standardized ecosystem condition indicators and accounting principles [61] |
| InVEST (Integrated Valuation) | Suite of models for mapping and valuing ecosystem services, providing data inputs for AHP criteria | |
| ARIES (Artificial Intelligence for Ecosystem Services) | Rapid ecosystem service assessment and valuation tool for integrating diverse data sources |
Application in Ecosystem Services Research: Case Examples
Forest Landscape Management Scenario
A recent study published in Frontiers in Forests and Global Change demonstrated the application of AHP for ranking landscape-level management planning scenarios based on stakeholders' interests and ecosystem services performance [16]. Researchers developed five management scenarios for the Vale do Sousa region in Portugal using linear programming, with each scenario maximizing or minimizing a single ecosystem service. Stakeholder preferences were elicited through an AHP survey involving 25 participants who weighted stand-level forest management models and associated ecosystem services. The results revealed that stakeholders' preferences significantly influenced scenario rankings, with the timber production scenario ranking highest under stakeholder-weight evaluations, while the wildfire resistance scenario emerged as top-ranked under equal weighting conditions [16].
This case study illustrates the critical importance of criteria selection and weighting in determining optimal management strategies. The researchers employed a hybrid decision-support framework combining optimization and participatory approaches, where AHP served as the methodological bridge between technical scenario development and stakeholder value incorporation. The study highlights how different weighting approaches—whether based on stakeholder preferences or equal weighting—can lead to substantially different conclusions about the preferred management alternative, underscoring the need for transparent and deliberate criteria selection processes in ecosystem services assessment [16].
Social Life Cycle Assessment of Mobility Services
Research published in Sustainability journal applied AHP to introduce weights to social life cycle assessment (S-LCA) of mobility services, providing another relevant case example of criteria selection and weighting protocols [50]. The study involved 48 experts from academic institutions, city authorities, and mobility service providers who completed pairwise comparisons of social indicators across five stakeholder groups: Local Community, User, Worker, Value Chain Actors, and Society. The researchers organized the problem into a hierarchical structure with the overall goal at the top level and various social criteria arranged in subsequent levels, following standard AHP methodology [50].
The findings demonstrated that while some indicators showed clear prioritization across different expert groups, others revealed significant differences in perceived importance between academic, government, and industry stakeholders. This participatory weighting approach allowed researchers to identify both consensus priorities and contested values, providing valuable insights for decision-makers navigating trade-offs between different social aspects of mobility services [50]. The study exemplifies how AHP can support multi-stakeholder decision-making in sustainability assessments by making value judgments explicit, transparent, and open to scrutiny through a structured weighting process.
Strategies for Effective Stakeholder Engagement and Eliciting Expert Judgment
Application Note: Foundational Principles and Strategic Framework
Engaging stakeholders and eliciting expert judgment are critical components in ecosystem services assessment research, particularly when employing the Analytical Hierarchy Process (AHP). These processes ensure that management strategies are scientifically sound, socially relevant, and sustainable. This framework is designed for researchers, scientists, and drug development professionals applying AHP within environmental and ecosystem services contexts. The integration of stakeholder values and expert quantitative judgments transforms complex, multi-faceted ecological data into structured, prioritized decision-making criteria.
The core challenge in ecosystem services assessment involves balancing diverse, often competing objectives such as ecological conservation, economic viability, and societal needs. A priori allocation of ecosystem services to forest stands or other management units requires a systematic approach to incorporate both scientific data and human values [17]. Effective strategies must therefore combine participatory engagement with rigorous methodological protocols for eliciting and quantifying expert judgment, creating a transparent and replicable information infrastructure for environmental management decisions [17] [62].
Application Note: Stakeholder Identification and Analysis Protocols
Stakeholder Identification Methodology
The initial phase involves systematically identifying all relevant parties affected by or capable of influencing the ecosystem assessment outcomes. The recommended protocol employs a multi-tiered approach:
- Stakeholder Snowball Sampling: Begin with known key informants (e.g., local forest managers, senior scientists) and ask them to identify other relevant stakeholders. Continue iteratively until no new major stakeholders are identified [17].
- Stakeholder Categorization: Classify identified stakeholders into primary groups for targeted engagement. In an ecosystem services context, this typically includes:
- Scientific Experts: Researchers and scientists providing technical data on ecosystem functions.
- Resource Managers: Forest planners, conservation officers, and land-use managers.
- Policy Makers and Regulators: Government officials responsible for environmental policy and sustainability goals.
- User Groups: Local communities, industry representatives (e.g., pharmaceutical development relying on natural compounds), and recreational users.
- Advocacy Groups: Environmental NGOs and indigenous community representatives [17] [48].
Stakeholder Analysis and Prioritization
Following identification, stakeholders are analyzed and prioritized to focus engagement efforts effectively. The following matrix is used to categorize stakeholders based on their influence and interest, guiding the appropriate engagement strategy.
Table 1: Stakeholder Power-Interest Grid and Engagement Strategy
| Quadrant | Stakeholder Attributes | Recommended Engagement Strategy |
|---|---|---|
| High Power, High Interest | Decision-makers, funders, senior regulators | Manage Closely: Engage deeply via frequent consultations, working groups, and collaborative decision-making [63] [64]. |
| High Power, Low Interest | Senior officials not directly involved | Keep Satisfied: Conduct high-level briefings and secure endorsement to ensure continued support [63]. |
| Low Power, High Interest | Local communities, field researchers | Keep Informed: Maintain regular communication via newsletters, community meetings, and workshops to build trust and gather input [63]. |
| Low Power, Low Interest | General public, peripheral academic groups | Monitor: Provide general updates with minimal resource expenditure [63]. |
For a more nuanced analysis, the Salience Model can be applied, classifying stakeholders based on their combined power, legitimacy, and urgency. "Definitive stakeholders" (high on all three attributes) become the absolute priority for engagement [63].
Protocol: Stakeholder Engagement Process for AHP Goal Structuring
Objective
To collaboratively define the hierarchy of goals, criteria (ecosystem services), and management alternatives for the AHP model through structured stakeholder workshops.
Materials and Reagents
Table 2: Research Reagent Solutions for Stakeholder Engagement
| Item | Function/Description |
|---|---|
| Structured Interview Protocol | A semi-structured questionnaire to elicit initial perspectives on ecosystem service values and trade-offs [17]. |
| Delphi Method Facilitation Kit | Materials for anonymous, iterative polling to converge group judgment on complex issues [17]. |
| AHP Hierarchy Template | A pre-defined but flexible visual template (e.g., flip charts, digital whiteboard) to build the decision hierarchy. |
| Pairwise Comparison Survey Forms | Digital or paper forms for stakeholders to conduct pairwise comparisons of criteria and alternatives. |
Step-by-Step Experimental Procedure
Pre-Workshop Individual Interviews (1-2 hours per stakeholder):
- Conduct one-on-one interviews using the structured protocol.
- Goal: Understand individual stakeholder perspectives, values, and initial criteria for assessing ecosystem services.
- Record and transcribe responses for thematic analysis.
Stakeholder Workshop I - Problem Structuring (Facilitated, 4 hours):
- Present the synthesized findings from the individual interviews.
- Facilitate a group discussion to define the overall goal of the AHP (e.g., "Sustainable Management of Forest X for Ecosystem Services").
- Brainstorm and agree upon a comprehensive list of ecosystem services (criteria) and potential management alternatives. Use techniques like nominal group technique to ensure all voices are heard.
AHP Hierarchy Development (Post-Workshop):
- The research team formalizes the AHP hierarchy based on workshop outputs.
- The hierarchy is shared with stakeholders for review and validation before proceeding.
Stakeholder Workshop II - Pairwise Comparison (Facilitated, 3 hours):
- Train stakeholders on the principles and process of AHP pairwise comparisons.
- Guide stakeholders through completing the pairwise comparison forms for criteria relative to the overall goal.
- Collect all forms for data analysis.
Data Analysis and Synthesis
- Input all pairwise comparison data into an AHP software tool (e.g., Expert Choice, R
ahppackage). - Calculate the priority weights for each ecosystem service and the consistency ratio for each stakeholder's judgments.
- Aggregate individual judgments using the geometric mean method to derive a group priority vector for the ecosystem services [17].
The following workflow diagram illustrates the logical sequence of the stakeholder engagement process for structuring an AHP model.
Application Note: Eliciting Expert Judgment for Quantifying Ecosystem Services
The Role of Expert Judgment
In ecosystem services assessments, expert judgment is indispensable for quantifying services that are difficult or expensive to measure directly (e.g., climate regulation, habitat quality, cultural values) and for forecasting under different management scenarios [62]. The goal is to derive calibrated, quantitative estimates that can be integrated into the AHP model or used to validate biophysical models.
Objective
To obtain unbiased, quantitative estimates of ecosystem service provision levels and their variability from subject matter experts.
Materials and Reagents
Table 3: Research Reagent Solutions for Expert Elicitation
| Item | Function/Description |
|---|---|
| Expert Identification Criteria | A predefined set of qualifications (e.g., publications, years of experience, peer recognition) for selecting experts. |
| Elicitation Protocol Script | A standardized script to ensure consistency in how questions are posed to all experts, minimizing framing bias. |
| Calibration Training Module | Materials and exercises to train experts in expressing uncertainty, improving the probabilistic quality of their judgments. |
| Response Form (Digital) | A form designed to capture quantitative estimates (e.g., 5th, 50th, 95th percentiles) for each ecosystem service under defined scenarios. |
Step-by-Step Experimental Procedure
Expert Selection and Recruitment:
- Identify experts using the pre-defined criteria. Aim for a diverse group of 5-15 experts to balance breadth of knowledge and facilitation logistics.
- Clearly communicate the goal, time commitment, and how their input will be used.
Expert Training and Calibration (1-2 hours):
- Conduct a training session covering the elicitation process and the importance of quantifying uncertainty.
- Use calibration exercises (e.g., estimating known quantities) to help experts calibrate their probability assessments.
Structured Elicitation Session (2-3 hours per expert or group):
- Present experts with clearly defined scenarios (e.g., "under current management," "with 20% increased harvesting," "under high climate change scenario").
- Using the protocol script, guide experts through the process of estimating the level of specific ecosystem services (e.g., nitrogen assimilation, soil erosion control, species density) for each scenario.
- Elicit estimates as probability distributions (5th, 50th, and 95th percentiles) to capture uncertainty [62].
Post-Elicitation Feedback and Aggregation:
- Provide experts with a summary of the initial aggregated results (anonymized).
- Conduct a follow-up discussion (a modified Delphi approach) allowing experts to revise their estimates in light of group responses, which helps converge toward a consensus and reduces overconfidence.
Data Analysis and Synthesis
- Fit probability distributions (e.g., Pert, Log-Normal) to the percentiles provided by each expert.
- Aggregate distributions across experts using a mathematical pool (e.g., linear pool) or behavioral aggregation (e.g., discuss until consensus). The choice depends on the level of disagreement and the project's goals.
- The aggregated estimates can then be used as direct inputs for the AHP model (e.g., as performance scores for alternatives) or to parameterize ecosystem service models like InVEST [48].
The logical flow for the expert judgment elicitation protocol, highlighting its iterative nature, is shown below.
Protocol: Integrating Stakeholder and Expert Data into AHP for Ecosystem Services Assessment
Objective
To synthesize the prioritized ecosystem service weights from stakeholder engagement with the quantified ecosystem service performance data from expert judgment to evaluate and rank management alternatives.
Data Integration and Final Assessment
The final stage involves integrating all collected data into a comprehensive AHP model. The table below provides a simplified, illustrative example of the synthesized data, showing how stakeholder-derived weights and expert-derived performance scores combine to evaluate management alternatives.
Table 4: Synthesis of AHP Priorities and Expert Performance for Alternative Evaluation
| Ecosystem Service (Criterion) | AHP Priority Weight (from Stakeholders) | Alternative A: Conservation | Alternative B: Sustainable Harvest | Alternative C: Business-as-Usual |
|---|---|---|---|---|
| Biodiversity Conservation | 0.201 | Performance: 9/10 | Performance: 7/10 | Performance: 4/10 |
| Wood Production | 0.254 | Performance: 2/10 | Performance: 8/10 | Performance: 6/10 |
| Soil Protection | 0.134 | Performance: 9/10 | Performance: 8/10 | Performance: 5/10 |
| Water Quality | 0.125 | Performance: 8/10 | Performance: 7/10 | Performance: 5/10 |
| Carbon Sequestration | 0.127 | Performance: 9/10 | Performance: 6/10 | Performance: 4/10 |
| Recreation | 0.102 | Performance: 8/10 | Performance: 6/10 | Performance: 5/10 |
| National Defense | 0.057 | Performance: 1/10 | Performance: 3/10 | Performance: 2/10 |
| Overall Score | ∑(Weight × Score) | ∑(Weight × Score) | ∑(Weight × Score) | |
| = 7.45 | = 6.92 | = 4.78 |
Note: Performance scores (1-10) are illustrative and would be derived from the quantified expert judgment elicitation or biophysical modeling informed by expert data [17] [62]. The overall score is the sum of the product of each criterion's AHP weight and its performance score under a given alternative. The alternative with the highest overall score (Alternative A: Conservation in this example) is identified as the preferred option.
Addressing Cognitive Overload in Pairwise Comparisons for Large Hierarchies
Ecosystem services assessment often involves evaluating complex decisions with multiple interacting criteria and alternatives. The Analytic Hierarchy Process (AHP) provides a structured framework for such multi-criteria decision analysis by breaking down complex problems into hierarchical structures and using pairwise comparisons to derive priorities [4] [29]. However, when applied to large hierarchies common in environmental management—such as evaluating watershed protection strategies or biodiversity conservation plans—the number of required pairwise comparisons grows exponentially, creating significant cognitive load for researchers and decision-makers [65]. This cognitive overload can manifest as mental fatigue, judgment inconsistencies, and reduced decision quality, ultimately compromising the reliability of ecosystem service valuations.
Cognitive load refers to the total mental effort being used in working memory, and in AHP applications, users must juggle multiple data points, criteria relationships, and comparison judgments simultaneously [66]. The fundamental challenge emerges from the mathematical reality that the number of pairwise comparisons required for a complete hierarchy grows quadratically. For a hierarchy with n elements at any level, the number of pairwise comparisons required is n(n-1)/2. In practical ecosystem services assessment, where criteria sets may include 10-15 elements and multiple alternative management scenarios, this can easily require hundreds of careful judgments, pushing the limits of human cognitive capacity and potentially leading to inconsistent results that undermine the scientific credibility of the assessment [65] [67].
Cognitive Challenges in Large-Scale AHP
Quantifying the Comparison Burden
The cognitive demands of large-scale AHP applications in ecosystem services assessment become apparent when examining the relationship between hierarchy complexity and required judgments. The table below illustrates how the number of pairwise comparisons escalates with increasing hierarchical complexity.
Table 1: Comparison Requirements for Different Hierarchy Sizes
| Number of Criteria | Number of Alternatives | Pairwise Comparisons at Criteria Level | Pairwise Comparisons at Alternative Level | Total Pairwise Comparisons |
|---|---|---|---|---|
| 5 | 3 | 10 | 15 (5×3) | 25 |
| 8 | 4 | 28 | 48 (8×6) | 76 |
| 12 | 5 | 66 | 150 (12×10) | 216 |
| 15 | 6 | 105 | 270 (15×15) | 375 |
Consistency Challenges
Beyond the sheer volume of comparisons, maintaining logical consistency across judgments presents additional cognitive challenges. The AHP methodology incorporates a Consistency Ratio (CR) to measure the coherence of pairwise comparison matrices, with a CR threshold of 0.10 indicating acceptable consistency [4] [67]. Achieving this threshold becomes progressively difficult as hierarchy size increases due to human cognitive limitations in maintaining transitive relationships across numerous judgments (if A > B and B > C, then A > C) [65]. Research indicates that decision-makers struggle to produce rigorously consistent comparisons when dealing with multiple criteria and alternatives, particularly in complex environmental assessments where criteria may have subtle interrelationships [67].
Protocols for Managing Cognitive Load
Hierarchical Decomposition Protocol
Objective: To reduce cognitive load by strategically decomposing complex ecosystem services assessment problems into manageable sub-hierarchies.
Procedure:
- Identify Core Decision Elements: Clearly define the overall goal of the ecosystem services assessment (e.g., "Prioritize wetland conservation areas").
- Group Related Criteria: Cluster related criteria into thematic categories (e.g., group all water-related services under "Hydrological Services").
- Create Multi-Level Hierarchy: Develop a 3-4 level hierarchy with the goal at level 1, criterion categories at level 2, specific criteria at level 3, and alternatives at level 4.
- Implement Sequential Evaluation: Conduct pairwise comparisons separately at each hierarchical level, beginning with criterion categories before addressing individual criteria.
- Document Rationale: Maintain a decision log recording the justification for each major grouping decision.
Workflow Visualization:
Adaptive Consistency Improvement Protocol
Objective: To systematically identify and rectify inconsistencies in pairwise comparison matrices while preserving the decision-maker's original judgment intent.
Procedure:
- Initial Consistency Calculation: After completing pairwise comparisons for a matrix, compute the Consistency Ratio (CR) using the formula:
- Identify Inconsistent Judgments: Use specialized algorithms to pinpoint the specific pairwise comparisons that contribute most significantly to matrix inconsistency.
- Implement Judgment Refinement: Employ interactive software tools that suggest minimal adjustments to problematic comparisons to improve CR while maintaining the original judgment spirit [65].
- Iterative Review Process: Present adjusted comparisons to domain experts for verification, ensuring ecological relevance is preserved.
- Document Adjustment Rationale: Record all modifications and expert feedback for methodological transparency.
Table 2: Consistency Thresholds and Improvement Strategies
| Consistency Ratio (CR) Range | Interpretation | Recommended Action | Tool Support |
|---|---|---|---|
| CR ≤ 0.10 | Acceptable consistency | No action needed | Validation documentation |
| 0.10 < CR ≤ 0.20 | Moderate inconsistency | Selective revision of most inconsistent judgments | Basic consistency adjustment algorithms |
| CR > 0.20 | Serious inconsistency | Comprehensive review and potential matrix reconstruction | Advanced algorithms (GWO, Cosine Distance) [67] |
Software Tools and Computational Support
Research Reagent Solutions
Table 3: Computational Tools for Cognitive Load Reduction in AHP
| Tool Name | Primary Function | Application in Ecosystem Services Assessment | Implementation Considerations |
|---|---|---|---|
| Expert Choice | Commercial AHP software with visualization | Structured decision-making for habitat suitability models | User-friendly interface but requires licensing |
| Prioritization Helper | Salesforce-integrated AHP solution | Stakeholder preference aggregation in participatory assessments | Cloud-based collaboration features |
| GWO-AHP Framework | Cosine distance-based inconsistency repair [67] | Handling complex criteria sets in landscape planning | Requires programming expertise for implementation |
| Interactive Consistency Tools | Real-time CR improvement with expert input [65] | Iterative refinement of biodiversity valuation judgments | Preserves ecological expert knowledge during adjustments |
Algorithmic Support for Large Hierarchies
For exceptionally large hierarchies in regional ecosystem assessments, advanced computational methods can significantly reduce cognitive demands. The Grey Wolf Optimizer (GWO) algorithm represents a promising approach for repairing inconsistent pairwise comparison matrices while minimizing deviation from the decision-maker's original judgments [67]. This swarm intelligence-based algorithm operates by:
The GWO algorithm models the social hierarchy and hunting behavior of grey wolves, with solutions represented as wolves searching for prey (the optimal consistent matrix) in a multidimensional space [67]. The cosine distance metric helps preserve the original judgment pattern while improving consistency, making it particularly valuable for ecological assessments where maintaining the expert's original intent is crucial.
Application in Ecosystem Services Assessment
Case Implementation: Watershed Management Prioritization
Background: A research team is evaluating five watershed management scenarios based on twelve ecosystem service criteria across four categories: provisioning services, regulating services, cultural services, and habitat services.
Implementation Workflow:
Cognitive Load Management Strategy:
- First Phase: Conduct only 6 pairwise comparisons between the four criteria categories rather than immediately addressing all 12 specific criteria.
- Second Phase: Evaluate criteria within each category separately (e.g., 3 provisioning service criteria require only 3 comparisons).
- Third Phase: Apply the adaptive consistency protocol after each comparison set, addressing inconsistencies immediately while the context remains fresh.
- Final Phase: Evaluate alternatives against each criterion using the consistent weights established in previous phases.
This structured approach reduces the cognitive burden from what would be 186 pairwise comparisons in a flat structure to manageable chunks of 6, 15, and 150 comparisons conducted in focused sessions, significantly enhancing judgment quality and methodological robustness.
Addressing cognitive overload in pairwise comparisons for large hierarchies is not merely a technical concern but a fundamental requirement for producing valid and reliable ecosystem services assessments. By implementing the hierarchical decomposition protocols, consistency improvement methods, and computational tools outlined in this application note, researchers can maintain the analytical rigor of AHP while overcoming the cognitive barriers associated with complex environmental decision-making. The integration of structured protocols with emerging algorithmic support creates a robust framework for applying AHP to the intricate challenges of ecosystem services assessment, where multiple competing criteria and stakeholder perspectives must be balanced to inform sustainable environmental management decisions.
The assessment of ecosystem services (ES) is crucial for understanding the life-support goods and services obtained from ecosystem structures and functions, and for addressing the increasing pressures of human exploitation on ecological self-regulatory capacity [53]. Within this research domain, the Analytical Hierarchy Process (AHP) has emerged as a robust multi-criteria decision-making (MCDM) method for structuring complex environmental problems. Its integration with structured frameworks like the Driving Forces, Pressure, State, Impact, and Response (DPSIR) model and powerful Geographic Information Systems (GIS) significantly enhances the capacity to conduct comprehensive, spatially-explicit ecosystem service assessments. This integration provides a standardized yet flexible approach for evaluating ecological quality, identifying driving factors, and supporting sustainable land use and conservation policy development [68]. These application notes detail the protocols for such integrations, providing researchers with methodologies to quantitatively evaluate and map ecosystem services.
Protocol: Implementing the AHP-DPSIR Integrated Framework
The DPSIR framework offers a causal structure for organizing information about environmental issues, while AHP provides a systematic method for deriving the weight of each indicator based on expert judgment. Their integration allows for the creation of a standardized, quantifiable evaluation system.
Stage 1: Indicator System Construction within the DPSIR Framework
- Step 1: Define the Assessment Goal. Clearly articulate the specific ecosystem service or composite ecological quality index to be evaluated. For instance, "Assess the composite eco-environmental quality at the county scale" [68].
- Step 2: DPSIR Categorization. Develop a hierarchy of indicators classified into the five DPSIR components:
- Driving Forces (D): Underlying human activities or natural processes causing environmental change (e.g., population growth, economic development).
- Pressure (P): Direct stresses from driving forces on the environment (e.g., pollution emissions, land use change).
- State (S): Measurable condition of the environment (e.g., vegetation coverage, habitat quality, water yield) [53] [68].
- Impact (I): Effects of the changed state on ecosystem functions and human well-being (e.g., loss of biodiversity, reduced carbon storage).
- Response (R): Societal or managerial actions taken to address the impacts (e.g., conservation policies, investment in treatment facilities).
- Step 3: Indicator Selection. Choose measurable proxies for each category. Prefer indicators that can be derived from remote sensing, statistical yearbooks, or existing models (e.g., InVEST, RUSLE) to ensure reproducibility [53] [69].
Stage 2: AHP for Weight Determination
- Step 1: Construct the Pairwise Comparison Matrix. Experts compare each indicator against every other indicator within the same hierarchical level using a fundamental 1-9 scale of relative importance.
- Step 2: Calculate Indicator Weights. Compute the principal eigenvector of the comparison matrix to derive the local weights for each indicator.
- Step 3: Consistency Check. Calculate the Consistency Ratio (CR). A CR value of less than 0.10 is considered acceptable, ensuring that expert judgments are logically consistent. If the CR is exceeded, the pairwise comparisons must be reviewed and revised.
Stage 3: Composite Index Calculation
- Step 1: Data Normalization. Normalize all indicator data to a common, dimensionless scale (e.g., 0-1) to eliminate the influence of different units.
- Step 2: Apply AHP Weights. Multiply the normalized value of each indicator by its global weight (derived from AHP).
- Step 3: Aggregate Scores. Sum the weighted values to calculate a final composite score for the ecosystem service or ecological quality for each spatial unit (e.g., county, grid cell) [68].
Table 1: Example DPSIR Indicator System with AHP Weights for Eco-Environmental Quality Assessment
| DPSIR Component | Indicator Example | Data Source | AHP Weight |
|---|---|---|---|
| Driving Forces (D) | Population Density (persons/km²) | Statistical Yearbook | 0.10 |
| GDP Growth Rate (%) | Statistical Yearbook | 0.08 | |
| Pressure (P) | Land Use Change Intensity Index | Landsat TM/OLI Imagery [69] | 0.12 |
| Pollution Emission Index | Environmental Statistics | 0.09 | |
| State (S) | Vegetation Coverage (NDVI) | MODIS/Landsat Imagery | 0.20 |
| Habitat Quality Index | InVEST Model [53] | 0.18 | |
| Water Yield (mm) | InVEST Model [53] | 0.09 | |
| Impact (I) | Carbon Storage (tons/ha) | InVEST Model [53] | 0.07 |
| Soil Conservation (tons/ha) | RUSLE Model [53] | 0.04 | |
| Response (R) | Protected Area Ratio (%) | Administrative GIS Data | 0.03 |
Note: Weights are illustrative and must be derived for a specific case study.
AHP-DPSIR Hierarchical Structure
Protocol: Spatial Analysis with GIS for Ecosystem Services
GIS transforms the composite scores from the AHP-DPSIR model into actionable spatial information, enabling the visualization of patterns and analysis of driving mechanisms.
Stage 1: Data Gridding and Preprocessing
- Step 1: Define Spatial Unit and Scale. Determine the optimal spatial scale for analysis (e.g., grid size, administrative boundaries). Research indicates that a 4500 m × 4500 m grid may be optimal for detecting spatial divergence of comprehensive ecosystem services in some regions, but this should be determined empirically for each study area [53].
- Step 2: Data Rasterization. Convert all vector-based data (e.g., administrative boundaries, land use polygons) and model outputs (e.g., water yield, carbon storage from InVEST) into a consistent raster format with a unified coordinate system and cell size.
Stage 2: Spatial Calculation and Mapping
- Step 1: Map Algebra for Composite Scores. Use GIS raster calculator tools to execute the weighted overlay. The formula is:
Composite_Score = (Weight_D * Normalized_D) + (Weight_P * Normalized_P) + (Weight_S * Normalized_S) + (Weight_I * Normalized_I) + (Weight_R * Normalized_R). - Step 2: Spatial Classification. Classify the resulting composite score raster into meaningful categories (e.g., Low, Medium, High quality) using natural breaks (Jenks) or quantile methods.
- Step 3: Trend Analysis. Perform this analysis for multiple time points (e.g., 2000, 2005, 2010...) to create a time series of maps, allowing visualization of spatiotemporal evolution [53] [69].
Stage 3: Spatial Statistics and Driver Analysis
- Step 1: Spatial Autocorrelation Analysis. Calculate Global Moran's I to determine if the ecosystem service values are clustered, dispersed, or random. A significant positive Moran's I (e.g., >0) indicates spatial clustering [68].
- Step 2: Driver Analysis with Geographical Detector Model. Use the Optimal Parameter-based Geographical Detector (OPGD) model to quantify the influence of potential driving factors (e.g., Relief Degree of Land Surface - RDLS, Slope, NDVI). The q-statistic value from the Geodetector output indicates the explanatory power of each factor, with higher q-values denoting stronger drivers [53].
Table 2: Quantitative Data from a Case Study in Central Yunnan Province (CYP) [53]
| Year | Water Yield (WY) | Carbon Storage (CS) | Habitat Quality (HQ) | Soil Conservation (SC) | Integrated Ecosystem Service Index (IESI) |
|---|---|---|---|---|---|
| 2000 | Increasing Trend | Decreasing Trend | Increasing Trend | Increasing Trend | 0.7338 |
| 2005 | ... | ... | ... | ... | 0.6981 |
| 2010 | ... | ... | ... | ... | 0.6947 |
| 2015 | ... | ... | ... | ... | 0.6650 |
| 2020 | ... | ... | ... | ... | 0.6992 |
Note: IESI constructed via Principal Component Analysis (PCA), showing initial decline and subsequent recovery of ecosystem services.
GIS Spatial Analysis Workflow
The Scientist's Toolkit: Essential Research Reagents and Materials
Table 3: Key Research Reagent Solutions for AHP-DPSIR and GIS Integration
| Category | Item/Software | Function/Benefit |
|---|---|---|
| Data Acquisition | Landsat TM/OLI Imagery | Provides multi-spectral, multi-temporal land use/cover data at 30m resolution for change detection [69]. |
| Statistical Yearbooks | Source for socio-economic driving force data (population, GDP) and other statistical indicators [69]. | |
| Ecosystem Service Modeling | InVEST Model Suite | Open-source suite of models for spatially mapping multiple ES (water yield, carbon, habitat) [53]. |
| RUSLE Model | Empirical model integrated with GIS for estimating annual soil loss due to water erosion [53]. | |
| GIS & Spatial Analysis | ArcGIS (10.8+) / QGIS | Proprietary and open-source GIS platforms for data management, spatial analysis, and map creation [69]. |
| Geographical Detector | Statistical method for assessing spatial stratified heterogeneity and identifying driving factors [53]. | |
| Multi-Criteria Decision Analysis | AHP Software (e.g., Expert Choice) or R/Python scripts | Facilitates the pairwise comparison process and calculates weights and consistency ratios. |
Validating AHP Outcomes and Comparing Model vs. Perceptual Data
The Importance of Sensitivity Analysis in AHP-based ES Assessments
Sensitivity analysis serves as a critical component in ecosystem services (ES) assessments that employ the Analytical Hierarchy Process (AHP). It systematically evaluates how variations in input parameters—specifically the weights assigned to different criteria—affect the final outcomes and conclusions of the assessment [70]. In the context of AHP, which relies on expert-derived pairwise comparisons to determine criteria weights, sensitivity analysis provides a measure of robustness and confidence in the model's outputs [70]. This process is particularly valuable for identifying which criteria exert the most significant influence on final ES assessment results, thereby guiding resource allocation toward the most critical data collection and management efforts.
The integration of sensitivity analysis within AHP-level ES assessments is essential for several reasons. First, it addresses the inherent subjectivity in assigning weight values through pairwise comparisons, offering a transparent method to quantify and communicate the uncertainty associated with assessment results [70]. Second, it enhances the credibility of the assessment findings by demonstrating how stable those findings are against potential variations in expert judgment. Finally, from a practical management perspective, understanding the sensitivity of model outputs helps prioritize interventions and safeguards against decisions based on overly fragile results [71].
Key Applications and Methodological Protocols
Experimental Protocols for Conducting Sensitivity Analysis
Protocol 1: Single Parameter Sensitivity Analysis This method involves systematically varying one criterion weight at a time while adjusting the remaining weights proportionally to maintain a sum of 1. The following steps outline the procedure:
- Establish Baseline Weights: Obtain the original set of normalized weights (W₁, W₂, ..., Wₙ) for all 'n' criteria from the completed AHP.
- Select Target Criterion: Choose a single criterion (Cᵢ) whose weight will be varied.
- Define Variation Range: Create a series of new weights for Cᵢ, typically ranging from 0 to 1 (e.g., 0, 0.1, 0.2, ..., 1.0).
- Adjust Other Weights: For each new weight assigned to Cᵢ (Wᵢₙₑᵥ), recalculate the weights of the remaining criteria (Wⱼₙₑᵥ) using the formula: Wⱼₙₑᵥ = Wⱼₒᵣᵢ * (1 - Wᵢₙₑᵥ) / (1 - Wᵢₒᵣᵢ) This adjustment ensures the sum of all weights remains equal to 1.
- Recalculate and Analyze: For each new set of weights, recalculate the final AHP scores for all assessment units (e.g., grid cells, regions). Track how the rankings or classifications of these units change in response to the weight variations [70].
Protocol 2: Spatial Autocorrelation Analysis of Sensitivity This protocol helps identify spatial patterns in the stability of assessment results, highlighting regions where outcomes are particularly sensitive or robust.
- Generate Sensitivity Map: Based on the single parameter analysis, create a raster map where the value for each pixel represents the number of times its classification (e.g., vulnerability level) changed across all sensitivity scenarios.
- Calculate Spatial Autocorrelation: Apply global spatial autocorrelation statistics (e.g., Global Moran's I) to the sensitivity map to determine if sensitive areas are clustered, dispersed, or randomly distributed.
- Identify Local Clusters: Use local indicators of spatial association (LISA), such as Local Moran's I, to pinpoint specific geographical clusters of high sensitivity (hot spots) and low sensitivity (cold spots) [70].
- Cross-reference with Land Use: Overlay the identified sensitivity clusters with land-use and land-cover maps to interpret the drivers behind the observed spatial patterns [70].
Application Contexts in Ecosystem Research
Sensitivity analysis within AHP frameworks provides critical insights across various ecological assessment contexts, as demonstrated in Table 1.
Table 1: Applications of Sensitivity Analysis in AHP-based Ecosystem Assessments
| Application Context | Assessment Focus | Role of Sensitivity Analysis | Key Findings from Case Studies |
|---|---|---|---|
| Ecological Vulnerability Assessment [70] | Water conservation, soil conservation, ecological sensitivity | To validate the stability of vulnerability classifications and identify drivers of change. | Revealed that human activities could improve highly vulnerable environments through positive interventions, altering inherent natural vulnerability patterns [70]. |
| Mine-Agriculture-Urban Compound Area Management [71] | Ecosystem service trade-offs in complex landscapes | To understand responses of soil/water conservation services to different land-use patterns. | Showed that water and soil conservation functions were significantly affected by land use, supplied mostly by natural habitats, followed by open-pit coal mining areas [71]. |
| River Basin Ecological Sensitivity [72] | Watershed-scale vulnerability to environmental stressors | To complement spatial sensitivity mapping and identify priority areas for conservation. | Used the Optimal Parameter Geographic Detector (OPGD) model to identify dominant drivers (e.g., heat, temperature) and their synergistic interactions (q=0.82) [72]. |
Research Reagent Solutions
The effective implementation of AHP and sensitivity analysis in ecosystem services assessment requires a suite of methodological and computational tools. These "research reagents" form the essential toolkit for researchers in this field.
Table 2: Essential Research Reagent Solutions for AHP-based ES Assessments
| Reagent Category | Specific Tool/Software | Primary Function in AHP-SA Workflow |
|---|---|---|
| GIS & Spatial Analysis | ArcGIS, QGIS, ENVI [70] [71] | Used for spatial data processing, map algebra, and visualizing the results of the AHP assessment and sensitivity analysis. |
| Statistical Computing | R (with 'ggplot2' package) [73] | Provides a grammar of graphics for creating complex, publication-quality visualizations of sensitivity analysis results. |
| AHP-Specific Tools | Expert Choice, R 'ahp' package | Facilitates the AHP process itself, including structuring hierarchies, collecting expert judgments, calculating weights, and consistency checks. |
| Sensitivity Analysis Algorithms | Custom scripts (e.g., Python, R) [70] | Automates the process of varying weights and recalculating outcomes as per the defined sensitivity protocols. |
| Spatial Autocorrelation Analysis | GeoDa, ArcGIS Spatial Statistics Tools [70] | Performs global and local spatial autocorrelation analysis (e.g., Moran's I) to detect clusters of sensitive areas. |
| Color Contrast & Accessibility Tools | WebAIM Contrast Checker, Deque axe DevTools [58] [74] | Ensures that all data visualizations, including diagrams and maps, meet WCAG AA contrast standards (≥ 4.5:1) for accessibility [75] [76]. |
Workflow Visualization and Signaling Pathways
The following diagram illustrates the integrated workflow for incorporating sensitivity analysis into an AHP-based ecosystem services assessment.
Figure 1: AHP-SA Workflow for ES Assessment
The signaling pathway between different land-use patterns and final ecological sensitivity, moderated by the AHP weights, can be conceptualized as follows. This diagram highlights the points where sensitivity analysis is most crucial.
Figure 2: Signaling Pathway for Land Use Impact
The outcomes of sensitivity analysis are typically summarized using metrics that quantify the stability of the model. The following table presents common metrics and their interpretations.
Table 3: Quantitative Metrics for Interpreting Sensitivity Analysis Results
| Metric | Description | Calculation / Expression | Interpretation Guideline |
|---|---|---|---|
| Weight Change Threshold | The minimum change in a criterion's weight required to alter the top-ranking alternative or overall conclusion. | Determined iteratively during single-parameter analysis. | A low threshold indicates high sensitivity to that criterion's weight, signaling a less robust result. |
| Classification Stability Index (CSI) | The proportion of assessment units (e.g., pixels, polygons) that maintain their classification across all sensitivity scenarios. | CSI = (Number of Stable Units) / (Total Number of Units) | A higher CSI (e.g., >0.8) indicates a more robust model. A lower CSI suggests conclusions are highly weight-dependent. |
| Spatial Autocorrelation (Moran's I) | Measures the degree of spatial clustering in the sensitivity results. | Calculated using spatial statistics software (e.g., GeoDa, ArcGIS). | A significant positive I indicates that sensitive areas are clustered, allowing for targeted management of these zones [70]. |
| Q-Value from OPGD | The explanatory power of a driving factor in the Optimal Parameter Geographic Detector model. | Ranges from 0 to 1. | A higher q-value (e.g., >0.5) indicates that the factor is a strong driver of the observed spatial pattern of ecological sensitivity [72]. |
Application Notes
Ecosystem services (ES) assessments are critical for sustainable environmental management, yet a significant disconnect often exists between quantitative model outputs and qualitative stakeholder perceptions. Effectively bridging this gap is essential for developing land-use policies and conservation strategies that are both scientifically sound and socially acceptable. The Analytical Hierarchy Process (AHP), a multi-criteria decision-making method, serves as a powerful tool to structurally combine empirical data with human values, thereby integrating these two knowledge systems [77] [5]. This protocol provides a detailed framework for conducting such integrative assessments, enabling researchers to quantify disparities, understand their drivers, and create more holistic environmental evaluations.
Key Quantitative Findings from Comparative Studies
Recent empirical studies consistently reveal a substantial divergence between model-based ES valuations and stakeholder perceptions. The table below summarizes key quantitative findings from national and regional-scale assessments.
Table 1: Documented Gaps Between Modeled and Perceived Ecosystem Services
| Study Context | Documented Gap | Key Diverging ES Categories | Most Aligned ES Categories |
|---|---|---|---|
| Mainland Portugal [5] | Stakeholder estimates were 32.8% higher on average than model outputs. | Drought regulation, Erosion prevention | Water purification, Food production, Recreation |
| Rural Laos [78] | Systematic priority divergence: Communities prioritized provisioning services (e.g., food, raw materials), while experts emphasized regulating services (e.g., carbon sequestration). | Provisioning Services, Cultural Services | (Not specifically reported) |
| Northwest Saxony, Germany [77] | Opportunity maps identified the highest potential for improvement in "provision of clean water" and "habitat provision," which may not align with local farmer priorities. | (Implied from methodology) | (Implied from methodology) |
These disparities are rooted in differing knowledge systems. Model-based assessments rely on biophysical data and spatial analytics, whereas stakeholder perceptions are shaped by Traditional Ecological Knowledge (TEK), direct livelihood dependencies, and cultural values [78]. Recognizing this distinction is the first step in designing reconciliation methodologies.
Experimental Protocols
This section provides a detailed, step-by-step protocol for conducting a comparative analysis of model outputs and stakeholder perceptions.
Protocol for Spatial ES Modeling and ASEBIO Index Calculation
Objective: To generate a spatially explicit, quantitative assessment of multiple ecosystem services and synthesize them into a composite index.
Table 2: Research Reagent Solutions for ES Modeling
| Item/Tool Name | Function/Application | Specific Example/Note |
|---|---|---|
| InVEST Suite (Integrated Valuation of Ecosystem Services and Tradeoffs) | Spatially explicit modeling of multiple ES (e.g., water yield, habitat quality, carbon sequestration). | Version 3.15.1 or newer is recommended [26]. |
| Landsat 8 OLI Imagery | Land use/land cover (LULC) classification and change detection. | Freely available via USGS Earth Explorer [26]. |
| Random Forest Algorithm | Performing land-use classification from satellite imagery. | Implementable in R with the RandomForest package [26]. |
| Carnegie-Ames-Stanford Approach (CASA) Model | Estimating Net Primary Productivity (NPP). | A light use efficiency model [26]. |
| Revised Universal Soil Loss Equation (RUSLE) | Estimating soil erosion and soil conservation service. | An empirical model [26]. |
| CORINE Land Cover | Base data for assigning ES potential to land cover classes. | European program; use equivalent local LULC data if outside EU [5]. |
Procedure:
- Data Collection and Preprocessing:
- Acquire LULC data (e.g., Landsat imagery) for your study area for the target years.
- Preprocess images using software like ENVI for radiometric calibration and atmospheric correction [26].
- Collect supporting biophysical data (e.g., soil type, precipitation, digital elevation models).
- Land Use/Land Cover (LULC) Classification:
- Use the Random Forest algorithm in R to classify preprocessed imagery into distinct LULC classes (e.g., cropland, forest, urban) [26].
- Validate the classification accuracy with field observations or high-resolution imagery.
- Ecosystem Service Indicator Calculation:
- Water Yield: Model using the InVEST Annual Water Yield model.
- Soil Conservation: Calculate using the RUSLE model.
- Carbon Sequestration: Estimate using the InVEST Carbon model.
- Habitat Quality: Assess using the InVEST Habitat Quality model.
- Construct the ASEBIO Index (or equivalent composite index):
- Normalization: Normalize all calculated ES indicators to a common scale (e.g., 0-1).
- Weighting: Assign weights to each ES indicator based on stakeholder-derived priorities using the AHP (see Protocol 2.2). This integrates human value into the model [5].
- Aggregation: Compute the composite index using a weighted linear combination:
ASEBIO_Score = (w1 * ES1) + (w2 * ES2) + ... + (wn * ESn)wherewis the AHP-derived weight for each ecosystem service.
Protocol for Eliciting and Analyzing Stakeholder Perceptions
Objective: To systematically capture, filter, and quantify stakeholder perceptions and priorities regarding ecosystem services.
Procedure:
- Stakeholder Identification and Sampling:
- Survey Design and Administration - Two-Step Method:
- Step 1: Perception Assessment: Present stakeholders with a pre-defined list of ES and ask them to rate their perceived level of use or importance of each service on a 4-point scale (1 = no use; 4 = high use) for specific land-use types [78].
- Filtering: Apply a ≥50% recognition threshold (i.e., ratings of 3 or 4) to identify the most locally relevant ES for further analysis [78].
- Step 2: Priority Evaluation: For the filtered ES list, ask stakeholders to allocate a total of 100 points across the services to reflect their relative importance. Use face-to-face, interviewer-assisted surveys with verbal reviews to ensure comprehension, especially in low-literacy contexts [78].
- Analytical Hierarchy Process (AHP) with Stakeholders:
- Structured Elicitation: Guide stakeholders through pairwise comparisons of ES criteria using Saaty's 9-point scale (e.g., "Is 'Water Purification' more important than 'Carbon Sequestration'? If so, by how much?") [77] [79].
- Weight Calculation: Compute the normalized weights for each ES criterion from the pairwise comparison matrices using the geometric mean method (LLSM) [79].
- Consistency Check: Calculate the Consistency Ratio (CR) for each respondent's matrix. A CR value of ≤ 0.1 is considered acceptable; matrices exceeding this threshold should be revisited with the stakeholder [79].
Protocol for Comparative Analysis and Gap Reconciliation
Objective: To quantitatively compare the results from Protocols 2.1 and 2.2, analyze the drivers of divergence, and synthesize findings.
Procedure:
- Spatial and Statistical Comparison:
- Identify and Interpret Divergence:
- Statistically analyze disparities to determine if gaps are significant and consistent across stakeholder groups and regions.
- Interpret the drivers of divergence through follow-up qualitative engagement (e.g., focus groups), distinguishing whether gaps arise from knowledge systems (TEK vs. scientific models), livelihood dependencies, or data limitations in the models [80] [78].
- Integrative Decision-Making:
- Use the AHP-derived stakeholder weights to inform the weighting of criteria in spatial opportunity maps or land-use scenario planning [77].
- Present both modeled and perceived values to decision-makers to highlight areas of consensus and conflict, enabling more transparent and inclusive policy formulation.
Workflow and Signaling Pathway Visualization
The following diagram illustrates the integrated workflow for conducting the comparative analysis, combining the spatial modeling and stakeholder perception pathways.
Figure 1. Integrated workflow for comparing model outputs and stakeholder perceptions.
The following diagram details the core AHP procedure used for structuring stakeholder-derived weights.
Figure 2. AHP workflow for deriving stakeholder-based criteria weights.
Within ecosystem services (ES) research, the Analytical Hierarchy Process (AHP) is a widely adopted multi-criteria decision-making method that helps structure complex problems and integrate diverse stakeholder perspectives into a common evaluation framework [81]. This method allows for the transformation of multifaceted qualitative judgments into quantitative priorities, facilitating more objective decision-making in environmental management. However, as ecosystem service assessments increasingly inform critical policy decisions, a pressing question emerges: How closely do the data-driven models based on AHP align with the perceived potential of ecosystem services as valued by human experts?
This application note addresses this question through a detailed examination of a recent comparative study, presenting its quantitative findings, methodological protocols, and essential research tools. The research by Fernandes et al. (2024) provides a groundbreaking national-scale comparison in Portugal, revealing that stakeholders consistently overestimated ES potential compared to spatial models, with an average overestimation of 32.8% [47]. This significant disparity underscores the critical need for methodologies that can effectively bridge the gap between quantitative models and qualitative expert judgment in ES assessment.
Quantitative Disparities: Models versus Expert Perception
The core of the case study lies in quantifying the differences between model-based evaluations and stakeholder perceptions of ecosystem service potential. The Portuguese research calculated eight key ES indicators using a spatial modelling approach and compared them against the potential perceived by stakeholders, whose valuations were integrated using an AHP-weighted index termed ASEBIO [47].
Table 1: Measured Disparities Between Modeled and Perceived Ecosystem Service Potential
| Ecosystem Service | Disparity (Stakeholder Overestimation) | Alignment Note |
|---|---|---|
| Drought Regulation | Highest Contrast | Largest overestimation by stakeholders [47]. |
| Erosion Prevention | Highest Contrast | Among the most overestimated services [47]. |
| Water Purification | Closely Aligned | Most closely aligned with model outputs [47]. |
| Food Production | Closely Aligned | Perception closely matched modeled data [47]. |
| Recreation | Closely Aligned | One of the most accurately perceived services [47]. |
| All Selected ES | Average: 32.8% | Consistent overestimation trend across the board [47]. |
The findings indicate that while certain services like water purification and food production were accurately perceived, experts showed significant overestimation for regulating services such as drought regulation and erosion prevention [47]. This systematic bias highlights the potential risks of relying exclusively on either expert judgment or purely model-based assessments in isolation.
Experimental Protocol for Comparative AHP-ES Assessment
To ensure reproducibility and rigorous application, the following protocol outlines the key methodological steps for conducting a similar comparative study.
Phase 1: Hierarchical Structure Formulation
- Objective Definition: Clearly state the goal of the ES assessment (e.g., "To determine the relative importance of ecosystem services for regional planning") [31].
- Criteria Identification: Through a comprehensive literature review, identify the relevant ecosystem services (criteria) and group them if necessary. The Portuguese study, for instance, integrated eight ES indicators into its framework [47].
- Hierarchy Construction: Build a decision hierarchy with the overall goal at the top, the main criteria (ES) in the middle, and the specific alternatives or assessment scenarios at the base [1].
Phase 2: Expert Selection and Data Collection
- Expert Recruitment: Identify and select a diverse panel of experts with backgrounds in both technical (e.g., spatial modeling, ecology) and clinical (e.g., field application, policy) domains. Social networks and professional platforms have proven effective for this purpose [31].
- Pairwise Comparison Survey Design: Develop a questionnaire where experts compare all pairs of ecosystem service criteria. The standard AHP scale (1-9) is used, where 1 indicates equal importance and 9 indicates extreme importance of one criterion over another [81] [1].
- Spatial Model Data Collection: In parallel, collect the necessary biophysical data (e.g., land cover, climate, soil data) to calculate the selected ES indicators using established spatial models like InVEST or similar approaches [47] [53].
Phase 3: Data Processing and Analysis
- AHP Weight Calculation: Synthesize the expert judgments from the pairwise comparisons. Calculate the relative priority weights for each ES using the principal eigenvector of the comparison matrix [81] [1].
- Consistency Validation: Check the logical consistency of each expert's judgments using the Consistency Ratio (CR). A CR of less than 0.10 is generally acceptable; surveys exceeding this threshold may need revision [31].
- Integrated Index Calculation: Construct the ASEBIO or a similar composite index by combining the normalized, model-derived ES values using the AHP-derived weights as multipliers [47].
- Disparity Quantification: Compare the composite index scores against the stakeholders' direct perceptions of ES potential (also gathered via survey) to calculate the percentage disparity.
Diagram 1: Workflow for a comparative study quantifying disparities between AHP models and expert valuation of ecosystem service potential.
The Scientist's Toolkit: Key Research Reagents and Solutions
This section details the essential "research reagents"—the primary datasets, models, and analytical tools required to execute the experimental protocol.
Table 2: Essential Research Reagents for AHP-based ES Assessment
| Tool / Solution | Type | Primary Function | Application Note |
|---|---|---|---|
| AHP Questionnaire | Methodological Tool | Elicits expert judgments via pairwise comparisons of ES criteria. | Uses a standard 1-9 scale. Digital surveys (e.g., Google Forms) optimize data collection [31]. |
| CORINE Land Cover | Spatial Dataset | Provides standardized land use/cover maps as primary input for ES models. | Crucial for calculating indicators like habitat quality and carbon storage [47]. |
| InVEST Model Suite | Software Model | Maps and values multiple ES (e.g., water yield, carbon storage, habitat quality). | A core biophysical modeling tool; requires GIS data inputs [47] [53]. |
| Google Earth Engine | Computing Platform | Enables large-scale spatial analysis and long-term ES trend assessment. | Provides access to satellite imagery and powerful processing capabilities [82]. |
| Consistency Ratio (CR) | Analytical Metric | Validates the logical coherence of an expert's AHP judgments. | A CR < 0.10 is acceptable; higher values indicate inconsistent judgments [31]. |
| Principal Component Analysis (PCA) | Statistical Method | Constructs an objective Integrated Ecosystem Service Index (IESI). | An alternative to AHP for integrating multiple ES assessments objectively [53]. |
Concluding Recommendations
This case study demonstrates a tangible and significant disparity between model-driven AHP assessments and expert valuation of ecosystem service potential. The systematic overestimation by stakeholders reveals a critical communication and perception gap. To enhance the reliability and applicability of ES assessments for decision-making, the following integrative strategies are recommended:
- Adopt Hybrid Methodologies: Combine AHP's ability to structure complex stakeholder values with the objective, data-driven weighting of methods like the Entropy Weight Method (EWM) to balance subjective and objective inputs [22].
- Implement Iterative Feedback: Present preliminary model results to stakeholders in an accessible format, allowing them to refine their judgments based on empirical data, thereby narrowing the perception gap.
- Select Context-Appropriate Methods: Carefully consider the purpose of the assessment, the availability of time-series data, and the characteristics of the ES being studied when choosing between space-for-time, temporal trend, or landscape background-adjusted approaches [82].
The findings affirm that neither purely model-based approaches nor exclusive expert elicitation are sufficient alone. The most robust framework for ecosystem service assessment is one that transparently integrates both scientific data and stakeholder knowledge, acknowledging and quantifying their differences to support more balanced and inclusive environmental decision-making [47].
Interpreting Threshold Effects and Non-Linear Relationships in ES Valuation
Ecosystem Services (ES) valuation increasingly reveals that relationships between drivers and service values are rarely linear. Threshold effects, defined as critical points where small changes in a driving factor produce large, often discontinuous, changes in ecosystem service value, represent a fundamental aspect of accurate ES assessment. Understanding these non-linear relationships is crucial for developing robust environmental management strategies and policy interventions that can anticipate and mitigate abrupt ecological changes. The identification of these thresholds enables resource managers to establish safe operating boundaries for human activities within ecological systems, thereby maintaining the functional integrity and continuous provision of valuable ecosystem services.
The complex, multidimensional nature of ecosystem services necessitates sophisticated analytical approaches that can handle both quantitative and qualitative factors. The Analytical Hierarchy Process serves as a powerful methodological framework for structuring these complex decision problems, allowing researchers to break down intricate ecological relationships into manageable hierarchical components. When integrated with spatial analysis and statistical modeling, AHP provides a mechanism for systematic prioritization of factors influencing ecosystem service thresholds, enabling more accurate valuation and more effective conservation planning within the broader context of ecosystem services assessment research.
Theoretical Foundations and Key Concepts
Conceptualizing Non-Linear Dynamics in ES
Non-linear relationships in ecosystem services manifest when the rate of change in service provision accelerates or decelerates disproportionately to changes in driving variables. These dynamics often create tipping points where ecosystems undergo rapid regime shifts, fundamentally altering their capacity to provide services. The theoretical underpinnings of these relationships stem from ecological principles of resilience and stability, where systems can absorb disturbances up to a critical threshold before reorganizing around a different set of structures and processes. This reorganization frequently results in irreversible losses of specific ecosystem services, particularly those dependent on specialized ecological interactions or complex habitat structures.
The manifestation of threshold effects varies significantly across different ecosystem service categories. Provisioning services often exhibit more predictable, gradually changing relationships with drivers like agricultural intensity or harvest rates, while regulating services such as water purification or climate regulation frequently demonstrate more abrupt transitions. Cultural services present particular challenges for threshold detection due to their subjective valuation components, though methods like AHP can effectively capture these socio-ecological dimensions through structured expert judgment and stakeholder engagement.
Typology of Threshold Effects in ES Valuation
- Saturation Thresholds: Occur when increasing a driver yields diminishing returns in ES value, eventually plateauing despite continued driver increases. Commonly observed in nutrient retention services where filtration capacity becomes exhausted.
- Collapse Thresholds: Represent critical points where ES provision declines precipitously, often associated with biodiversity loss, habitat fragmentation, or pollution accumulation beyond assimilative capacity.
- Transition Thresholds: Mark shifts between different ecosystem states, such as forest-to-savanna transitions, with fundamentally altered ES bundles and values.
- Spatial Thresholds: Emerge from landscape configuration patterns where connectivity loss beyond specific limits disrupts essential ecological flows and processes.
Methodological Framework for Threshold Detection
Integrated AHP-Based Assessment Protocol
The integration of AHP within ecosystem services assessment provides a structured approach for identifying and prioritizing threshold effects across multiple dimensions. The methodology proceeds through three systematic phases that combine qualitative judgment with quantitative analysis:
Phase 1: Hierarchical Structure Development
- Conduct comprehensive literature review of relevant ES assessment frameworks and threshold studies
- Identify criteria and sub-criteria through expert consultation and stakeholder engagement
- Construct hierarchical model with overall objective (ES valuation), criteria (driving factors), sub-criteria (specific indicators), and alternatives (management scenarios)
- Define pairwise comparison matrices for all hierarchical elements to establish relative importance
Phase 2: Expert Selection and Survey Implementation
- Identify domain experts through academic networks, professional associations, and research publications
- Develop structured questionnaire for pairwise comparisons using standard Saaty scale (1-9)
- Implement survey through appropriate channels (online platforms, direct engagement)
- Ensure representative expertise coverage across relevant disciplines (ecology, economics, sociology)
Phase 3: Data Analysis and Threshold Identification
- Calculate priority weights through eigenvector method or geometric mean approach
- Verify consistency ratio (CR < 0.10 acceptable) to ensure logical judgment transitivity
- Integrate AHP weights with spatial data using Geographic Information Systems
- Apply statistical methods (piecewise regression, machine learning) to detect inflection points
- Validate thresholds through sensitivity analysis and cross-validation with empirical data
Advanced Analytical Techniques for Threshold Detection
Contemporary threshold detection employs diverse methodological approaches that complement the AHP framework:
Table 1: Analytical Methods for Threshold Detection in ES Valuation
| Method Category | Specific Techniques | Threshold Identification Approach | Data Requirements |
|---|---|---|---|
| Regression-based | Piecewise linear regression, Restricted cubic splines | Identifies breakpoints in relationship curves | Time-series or cross-sectional ES and driver data |
| Machine Learning | Random Forest, Conditional inference trees | Detects complex nonlinear patterns and interactions | Multi-dimensional spatial and temporal data |
| Spatial Econometrics | Bivariate Moran's I, GeoDetector | Reveals spatially explicit threshold effects | Georeferenced ES and driver indicators |
| Time-series Analysis | Convergent cross mapping, State-space models | Identifies temporal regime shifts | Long-term monitoring data |
The selection of appropriate techniques depends on data availability, spatial and temporal scales, and the specific ES under investigation. Increasingly, hybrid approaches that combine multiple methods provide the most robust threshold identification, with AHP serving to weight the importance of different detected thresholds within decision-making contexts.
Experimental Protocols and Application Notes
Protocol 1: AHP-Driven Threshold Assessment for Urban ES
Objective: To identify critical thresholds of Human Activity Intensity (HAI) impacts on different ecosystem service values in urban contexts using integrated AHP and statistical modeling.
Materials and Reagents:
- Land Use/Land Cover (LULC) data for study area (30m resolution minimum)
- Socioeconomic datasets (population density, GDP, infrastructure indices)
- Regional ES value coefficient tables
- GIS software (ArcGIS, QGIS)
- AHP analysis software (Expert Choice, SuperDecisions, or R packages)
- Statistical analysis environment (R, Python with sci-kit learn)
Methodology:
- ESV Calculation: Apply equivalent factor-based ESV assessment model using LULC data and regional valuation coefficients [83].
- HAI Measurement: Compute Human Activity Intensity index integrating population density, land use intensity, and economic activity metrics [83].
- AHP Hierarchy Construction: Develop hierarchical model with ESV maintenance as goal, HAI components as criteria, and specific indicators as sub-criteria.
- Expert Elicitation: Conduct pairwise comparisons with minimum of 10-15 domain experts to establish weightings for HAI components.
- GeoDetector Analysis: Apply geographical detector model to identify determinant power of HAI factors and their interactive effects on ESV [83].
- Threshold Testing: Implement piecewise regression or machine learning models to identify critical HAI transition points for different ES categories.
- Validation: Cross-validate identified thresholds using temporal hold-out data or independent spatial validation.
Application Notes:
- This protocol successfully identified HAI thresholds between 0.176 and 0.262 for supporting and provisioning services in Hefei, China, revealing transition from positive to negative effects [83]
- Key output includes ESV flow matrices that quantify losses and gains from land transitions
- Protocol requires careful calibration of ESV coefficients to regional context
- Minimum 20-year time series recommended for robust threshold detection
Protocol 2: Non-Linear ES-SDG Relationship Analysis
Objective: To unravel nonlinear relationships between ecosystem services and Sustainable Development Goals using explainable machine learning within an AHP-weighted framework.
Materials and Reagents:
- InVEST model suite for ES quantification (water yield, carbon storage, habitat quality)
- SDG indicator datasets at appropriate spatial resolution
- Spatial panel data for relevant region
- Machine learning environment (Python, R)
- AHP pairwise comparison survey instrument
Methodology:
- ES Quantification: Implement InVEST models (water yield, sediment retention, carbon storage, habitat quality) for study region [84].
- SDG Assessment: Calculate comprehensive SDG indices using standardized methodology for regional context.
- Spatial Correlation: Apply spatial econometric models to examine direct and indirect effects of ES on SDGs.
- AHP Weighting: Develop hierarchical structure linking ES categories to SDG targets, with expert-derived weights for importance.
- Machine Learning Modeling: Implement Random Forest or XGBoost algorithms to identify non-linear patterns using AHP weights as feature importance priors.
- Interpretation: Apply SHAP (Shapley Additive Explanations) analysis to reveal direction and magnitude of ES-SDG relationships across value ranges [84].
- Threshold Extraction: Identify critical transition points where relationship directions or magnitudes change significantly.
Application Notes:
- Protocol revealed turning point year (2010) for SDG-ES relationships in Guangxi, China, connected to policy interventions [84]
- Effectively captures spatial spillover effects often missed in traditional analyses
- SHAP analysis provides both global and local interpretability for black-box models
- Important to validate machine learning findings with theoretical ecological knowledge
Research Reagent Solutions and Essential Materials
Table 2: Essential Research Tools for ES Threshold and AHP Studies
| Tool Category | Specific Solutions | Primary Function | Application Context |
|---|---|---|---|
| ES Modeling | InVEST model suite | Quantifies multiple ecosystem services | Spatial ES assessment across landscapes |
| Multi-criteria Analysis | Expert Choice, SuperDecisions, AHP Excel templates | Facilitates pairwise comparisons and weight calculation | AHP implementation for expert judgment aggregation |
| Geospatial Analysis | ArcGIS, QGIS with GRASS, SAGA modules | Spatial data processing and analysis | Mapping ES bundles and identifying spatial thresholds |
| Statistical Analysis | R with segmented, party, mgcv packages | Statistical threshold detection and modeling | Piecewise regression, conditional inference trees |
| Machine Learning | Python scikit-learn, XGBoost, SHAP library | Nonlinear pattern detection and interpretation | Complex ES-driver relationship modeling |
Visualization of Methodological Frameworks
AHP-Threshold Integration Workflow
Complex Threshold Relationships in ES Valuation
Data Synthesis and Threshold Values
Table 3: Documented Threshold Values in Ecosystem Service Studies
| Ecosystem Service | Driver Variable | Threshold Value | Location | Methodology | Implications |
|---|---|---|---|---|---|
| Supporting & Provisioning Services | Human Activity Intensity (HAI) | 0.176-0.262 | Hefei, China | Piecewise regression | Transition from positive to negative effects [83] |
| Carbon Storage | Land Urbanization (%) | 1.063% | Mega-urban agglomerations | Threshold regression | Inverted U-shaped relationship [83] |
| Carbon Storage | Population Density (people/km²) | 272 | Mega-urban agglomerations | Threshold regression | Inverted U-shaped relationship [83] |
| Food Production | Land Urbanization (%) | 0.704% | Mega-urban agglomerations | Threshold regression | U-shaped relationship [83] |
| Multiple ES | Population Density (people/km²) | 229 | Beijing, China | Piecewise linear regression | Rapid ESV decline beyond threshold [83] |
| Multiple ES | Population Density (people/km²) | 669 | Guangdong-Hong Kong-Macao Greater Bay Area | Machine learning | Co-development potential below threshold [83] |
The integration of threshold analysis with AHP methodologies provides a powerful framework for advancing ecosystem services valuation beyond simplistic linear assumptions. The protocols and applications presented demonstrate how non-linear dynamics can be systematically incorporated into ES assessment, enabling more accurate prediction of ecological responses to anthropogenic pressures. The identified thresholds offer concrete management leverage points where interventions can yield disproportionate benefits for ecosystem service maintenance and enhancement.
Future research should prioritize several key directions: (1) developing standardized protocols for threshold detection across diverse ecosystem types, (2) enhancing the temporal resolution of threshold studies to capture climate-induced shifts, (3) integrating social-ecological feedback loops into threshold models, and (4) improving the communication of threshold concepts to policy audiences. As the field progresses, the combination of AHP with emerging machine learning approaches holds particular promise for unraveling the complex, non-linear relationships that characterize social-ecological systems, ultimately supporting more effective and anticipatory environmental governance.
Advantages and Limitations of AHP Compared to Other MCDA Methods in ES
Multi-Criteria Decision Analysis (MCDA) comprises a suite of analytical techniques designed to support decision-making processes when confronting multiple, often conflicting, criteria [85]. In the context of ecosystem services (ES) assessment, MCDA provides a structured framework for evaluating complex trade-offs between environmental, social, and economic objectives [26] [86]. The application of MCDA has become increasingly vital for informing policy and management decisions that balance agricultural production, conservation priorities, and human well-being [87] [26].
The Analytic Hierarchy Process (AHP), developed by Thomas Saaty in the 1970s, represents one of the most widely employed MCDA methods in ecosystem services research [4] [29]. Its structured approach to decomposing complex decisions into hierarchical components has made it particularly valuable for addressing the multi-dimensional nature of ecosystem service assessments, where both quantitative metrics and qualitative judgments must be integrated [4] [26]. This application note examines the comparative advantages and limitations of AHP relative to other prominent MCDA methods within the specific context of ecosystem services assessment.
Key MCDA Methods and Their Characteristics
Various MCDA methods have been developed, each with distinct theoretical foundations and operational procedures. Table 1 summarizes the primary MCDA methods relevant to ecosystem services assessment.
Table 1: Overview of Prominent MCDA Methods in Ecosystem Services Research
| Method | Classification | Key Characteristics | Typical ES Applications |
|---|---|---|---|
| AHP | Value/Utility-based | Hierarchical structure; pairwise comparisons; consistency ratio [4] [29] | Land management scenarios [26]; urban ecosystem service assessment [87] |
| ANP | Value/Utility-based | Network structure with dependencies; extension of AHP [88] | Complex systems with feedback loops |
| TOPSIS | Value/Utility-based | Reference point approach; proximity to ideal solution [88] [85] | Environmental impact assessment |
| VIKOR | Value/Utility-based | Compromise ranking; maximum group utility [88] [85] | Environmental planning with conflicting criteria |
| ELECTRE | Outranking | Pairwise outranking; concordance/discordance indices [89] [85] | Sustainability assessment |
| PROMETHEE | Outranking | Outranking flows; preference functions [85] | Natural resource management |
| MAUT/MAVT | Value/Utility-based | Utility functions; expected utility theory [89] | Risk-based decision analysis |
These methods can be broadly categorized into value/utility-based approaches (e.g., AHP, TOPSIS, VIKOR) which aggregate performance scores into an overall value, and outranking methods (e.g., ELECTRE, PROMETHEE) that establish preference relations through pairwise comparisons [85]. The choice among these methods depends on problem characteristics, data requirements, and the decision context [88] [86].
Advantages of AHP in Ecosystem Services Assessment
Structured Framework for Complex Decisions
AHP employs a hierarchical decomposition that effectively breaks down complex ecosystem service problems into manageable components [4]. This structured approach begins with defining an overarching goal (e.g., "optimize ecosystem service provision"), which is then decomposed into criteria (e.g., regulating services, provisioning services), sub-criteria, and finally alternatives or scenarios for evaluation [29] [26]. This hierarchical structuring forces explicit consideration of all relevant components and their relationships, providing comprehensive problem representation particularly valuable for complex ES assessments involving multiple interacting components [4] [26].
Effective Integration of Quantitative and Qualitative Factors
AHP efficiently handles mixed data types through its pairwise comparison methodology, using Saaty's 1-9 ratio scale to translate qualitative expert judgments into quantitative values [4] [90] [29]. This capability is particularly important in ES assessment where some criteria (e.g., biodiversity significance, cultural value) may resist straightforward quantitative measurement but represent critical considerations [87]. The method's ability to incorporate both objective measurements and subjective judgments makes it well-suited for the transdisciplinary nature of ecosystem services research [87].
Transparency and Consistency Checks
The AHP methodology incorporates a consistency ratio (CR) that quantifies the logical coherence of pairwise comparison judgments [4] [90]. This built-in validation mechanism alerts decision-makers when their judgments exhibit significant inconsistencies (typically CR > 0.1), prompting re-evaluation and enhancing result reliability [4] [29]. Furthermore, the explicit documentation of criteria weights and comparison matrices provides full procedural transparency, which is crucial for stakeholder acceptance and policy justification in environmental decision contexts [90] [86].
Facilitates Stakeholder Participation
AHP supports group decision-making through mathematical aggregation of multiple stakeholder judgments, effectively integrating diverse perspectives [4] [85]. The pairwise comparison process itself serves as a facilitated discussion framework, helping stakeholders articulate and reconcile differing priorities [86]. This participatory strength was demonstrated in urban ES assessments where AHP successfully integrated inputs from city administrations, researchers, and community representatives [87].
Limitations of AHP in Ecosystem Services Assessment
Structural Rigidity and Independence Assumptions
The strictly hierarchical structure of AHP assumes unidirectional relationships and independence between decision elements, which may oversimplify complex ecological systems characterized by feedback loops and interdependencies [88]. This limitation becomes particularly problematic when modeling ecosystem services where criteria often exhibit significant interactions (e.g., trade-offs between provisioning and regulating services) [26]. The Analytic Network Process (ANP) was developed specifically to address this limitation by accommodating network relationships, though at the cost of increased complexity [88].
Cognitive Challenges in Extensive Pairwise Comparisons
The pairwise comparison requirement becomes computationally burdensome as the number of elements increases, with the number of comparisons growing exponentially [29]. This can lead to judgmental fatigue and reduced reliability when stakeholders face lengthy comparison sessions, particularly in complex ES assessments with numerous criteria and alternatives [88]. While software tools mitigate computational burdens, the cognitive demands on decision-makers remain a significant practical constraint [4] [29].
Theoretical Concerns Regarding Ratio Scale Foundations
The AHP method employs a fixed 1-9 ratio scale for all comparisons, which assumes consistent ratio interpretation across different types of criteria and decision-makers [29]. Some researchers have questioned the theoretical basis for this approach, particularly regarding the phenomenon of rank reversal where the introduction of new alternatives can potentially alter the relative ranking of existing options [88]. These theoretical concerns warrant consideration in ES applications where decision legitimacy is crucial for policy implementation.
Limited Explicit Handling of Uncertainty
Traditional AHP does not explicitly incorporate probability distributions or confidence intervals for its input judgments, providing limited direct characterization of uncertainty [85]. This represents a significant limitation in ES assessment where data quality varies and predictions involve substantial uncertainty [26]. Fuzzy AHP extensions have been developed to address this limitation by incorporating fuzzy set theory to handle imprecise judgments, though with increased methodological complexity [88] [85].
Comparative Analysis: AHP Versus Other MCDA Methods
Table 2: Comparative Analysis of AHP Against Other MCDA Methods in ES Context
| Comparative Aspect | AHP | TOPSIS/VIKOR | ELECTRE/PROMETHEE | MAUT |
|---|---|---|---|---|
| Problem Structure | Hierarchical | Flat decision matrix | Flat decision matrix | Value tree |
| Handling of Criteria Dependencies | Limited (requires ANP extension) | Limited | Moderate | Limited |
| Uncertainty Handling | Limited (requires fuzzy extension) | Moderate | Moderate | Explicit through utilities |
| Computational Burden | High with many elements | Moderate | High | Moderate |
| Transparency/Explainability | High | Moderate | Complex | High |
| Compensatory Behavior | Full compensation | Full compensation | Limited compensation | Full compensation |
| Stakeholder Engagement | Excellent | Good | Moderate | Good |
The selection of an appropriate MCDA method depends on specific ES assessment requirements. AHP demonstrates particular strengths when structured problem decomposition, stakeholder engagement, and procedural transparency represent primary concerns [4] [90]. Alternatively, methods such as TOPSIS or VIKOR may prove more suitable when working with well-defined performance data and limited stakeholder involvement, while outranking methods like ELECTRE may better accommodate situations where limited compensation between criteria reflects decision-maker preferences [85].
Methodological Protocols for AHP Application in Ecosystem Services Research
Phase 1: Problem Structuring and Hierarchy Development
Step 1: Define Decision Objective Clearly articulate the primary ES decision objective (e.g., "Prioritize wetland restoration sites to maximize ecosystem service provision") through stakeholder consultation [86]. Document scope constraints and decision context.
Step 2: Identify Evaluation Criteria Through literature review, expert consultation, and stakeholder workshops, identify comprehensive evaluation criteria representing key ES dimensions [87] [26]. Classify criteria within the MA framework categories (provisioning, regulating, cultural, supporting services) or other relevant frameworks.
Step 3: Construct Decision Hierarchy Develop a hierarchical model with the decision objective at the top level, criteria and sub-criteria at intermediate levels, and decision alternatives at the bottom level [4] [29]. Validate hierarchy completeness and logical structure with domain experts.
AHP Hierarchical Structure for ES Assessment
Step 4: Conduct Pairwise Comparisons For each hierarchy level, systematically compare all element pairs relative to their parent element using Saaty's 1-9 scale [4] [29]. Deploy specialized software or structured worksheets to facilitate this process. For group decisions, employ facilitated workshops to elicit individual or collective judgments [86].
Step 5: Calculate Priority Weights Transform pairwise comparison matrices into normalized priority vectors using eigenvector method or approximation techniques [4] [29]. Compute consistency ratios to validate judgment reliability, with CR < 0.10 indicating acceptable consistency [4].
Step 6: Synthesize Hierarchical Priorities Aggregate local priorities across hierarchy levels through weighted summation to generate global priorities for alternatives [29]. Document complete calculation sequence for transparency and verification.
Phase 3: Validation and Sensitivity Analysis
Step 7: Conduct Sensitivity Analysis Systematically vary criterion weights to assess ranking stability and identify critical criteria that significantly influence results [86] [85]. Present findings through sensitivity graphs or scenario analyses.
Step 8: Validate and Refine Results Compare AHP-derived rankings with empirical data or expert validation exercises where feasible [87]. Refine models based on stakeholder feedback and secondary analysis.
Essential Research Toolkit for AHP Applications in ES
Table 3: Research Reagent Solutions for AHP Implementation in ES Studies
| Tool/Resource | Primary Function | Application Context | Representative Examples |
|---|---|---|---|
| Expert Choice | AHP software implementation | Comprehensive AHP analysis with sensitivity capabilities | Project portfolio selection [4] |
| Prioritization Helper | Cloud-based AHP tool | Salesforce-integrated decision support | Organizational decision support [4] |
| 1000minds | Online decision support | PAPRIKA method implementation | Alternative to AHP [29] |
| InVEST Model Suite | Ecosystem service quantification | Biophysical modeling for criterion scoring | ES indicator calculation [26] |
| Saaty's 1-9 Scale | Judgment quantification | Standardized preference elicitation | All AHP applications [4] [29] |
| Consistency Ratio | Judgment validation | Quality control for pairwise comparisons | All rigorous AHP applications [4] [90] |
| Random Forest Algorithm | Land use classification | Criterion data generation via remote sensing | Land use scenario development [26] |
The Analytic Hierarchy Process offers a robust, transparent, and participatory framework for ecosystem services assessment, with particular strengths in structuring complex decisions, integrating diverse knowledge types, and facilitating stakeholder engagement [4] [87] [90]. However, researchers must remain cognizant of its limitations regarding structural rigidity, cognitive demands, and uncertainty handling [88] [85]. The selection of AHP versus alternative MCDA methods should be guided by specific decision context characteristics, including problem complexity, data availability, stakeholder participation requirements, and the need for compensatory decision logic. When appropriately applied with attention to its methodological assumptions and constraints, AHP represents a powerful analytical tool for advancing ecosystem services research and supporting environmental decision-making processes.
Conclusion
The Analytic Hierarchy Process provides a structured, transparent, and mathematically robust framework for tackling the inherent complexities of ecosystem services assessment. By breaking down complex decisions into manageable hierarchies and systematically incorporating stakeholder values, AHP moves beyond purely biophysical or economic valuations. The method's strength is further amplified when its model-based outcomes are validated against, or integrated with, human perceptual data, as this highlights potential biases and strengthens the legitimacy of the results for decision-making. For biomedical and clinical research, these integrated AHP frameworks offer a powerful approach for evaluating the environmental dimensions of health, prioritizing drug development pathways based on environmental sustainability, and understanding the ecosystem services that underpin human wellbeing. Future research should focus on standardizing AHP applications in healthcare contexts, dynamically linking ES valuations to public health outcomes, and developing adaptive management strategies that reflect the threshold effects identified through these sophisticated analyses.
References
- 1. Analytic hierarchy process [https://en.wikipedia.org/wiki/Analytic_hierarchy_process]
- 2. Analytic Hierarchy Process - an overview [https://www.sciencedirect.com/topics/computer-science/analytic-hierarchy-process]
- 3. Analytic Hierarchy Process (AHP): A Complete Guide [https://www.transparentchoice.com/analytic-hierarchy-process]
- 4. Comprehensive Guide to Analytic Hierarchy Process (AHP) ... [https://www.6sigma.us/six-sigma-in-focus/analytic-hierarchy-process-ahp/]
- 5. Humans versus models: a comparative assessment of ... [https://www.nature.com/articles/s41598-024-76600-w]
- 6. How to Prioritize the Attributes of Water Ecosystem Service ... [https://www.mdpi.com/2071-1050/14/23/15767]
- 7. Ecosystem Services [http://www.climatehubs.usda.gov/ecosystem-services]
- 8. Ecosystem Services [https://www.nwf.org/Educational-Resources/Wildlife-Guide/Understanding-Conservation/Ecosystem-Services]
- 9. National Ecosystem Services Classification System Plus [https://www.epa.gov/eco-research/national-ecosystem-services-classification-system-plus-frequently-asked-questions]
- 10. Why Are Ecosystem Services Difficult to Value Economically? [https://pollution.sustainability-directory.com/question/why-are-ecosystem-services-difficult-to-value-economically/]
- 11. Ecosystem Services Accounting and AHP for Prioritizing ... [https://link.springer.com/chapter/10.1007/978-3-031-65332-2_14]
- 12. Method for the quantitative evaluation of ecosystem ... [https://pmc.ncbi.nlm.nih.gov/articles/PMC6336092/]
- 13. Complementary use of the Ecosystem Service Concept and ... [https://pmc.ncbi.nlm.nih.gov/articles/PMC9012706/]
- 14. A multi-criteria analysis of forest restoration strategies to ... [https://annforsci.biomedcentral.com/articles/10.1007/s13595-020-01020-5]
- 15. Comparative analysis between AHP and ANP in prioritization... | CoLab [https://colab.ws/articles/10.1016%2Fj.ecoinf.2022.101739]
- 16. Ranking landscape-level management planning scenarios ... [https://www.frontiersin.org/journals/forests-and-global-change/articles/10.3389/ffgc.2025.1707550/full]
- 17. A priory allocation of ecosystem services to forest stands in ... [https://www.sciencedirect.com/science/article/abs/pii/S0301479724022163]
- 18. The Analytic Hierarchy Process and Participatory ... [https://research.fs.usda.gov/treesearch/251]
- 19. Evaluation of the European experts on the application ... [https://link.springer.com/article/10.1007/s10668-023-03859-w]
- 20. Analytic Hierarchy Process: an introduction with examples ... [https://weadapt.org/knowledge-base/adaptation-decision-making/ahp/]
- 21. A symbiosis theory-based strategic framework for rural ... [https://www.frontiersin.org/journals/environmental-science/articles/10.3389/fenvs.2025.1613364/full]
- 22. Assessment of ecological and landscape services in urban ... [https://www.nature.com/articles/s40494-025-01759-y]
- 23. A novel uncertainty assessment protocol for integrated ... [https://www.sciencedirect.com/science/article/pii/S2352550924001234]
- 24. Rescission of Conservation and Landscape Health Rule [https://www.federalregister.gov/documents/2025/09/11/2025-17537/rescission-of-conservation-and-landscape-health-rule]
- 25. President Advances Landscape Architects' Priorities in ... [https://dirt.asla.org/2024/03/18/president-advances-landscape-architecture-priorities-in-2025-budget-request/]
- 26. Trade-offs between agricultural production and ecosystem ... [https://www.nature.com/articles/s41598-025-06650-1]
- 27. Management of Ecosystem Service Trade-offs: Integrating ... [https://link.springer.com/article/10.1007/s00267-025-02311-1]
- 28. Trade-Offs and Synergies Between Ecosystem Services ... [https://www.mdpi.com/2073-445X/14/3/637]
- 29. What is the Analytic Hierarchy Process (AHP)? [https://www.1000minds.com/decision-making/analytic-hierarchy-process-ahp]
- 30. AHP-Based Analysis of Urban Park Ecosystem Services [https://www.pjoes.com/AHP-Based-Analysis-of-Urban-Park-nEcosystem-Services-Linking-Recreational-nAdaptation,207179,0,2.html]
- 31. Lessons learned from a study based on the AHP method ... [https://pmc.ncbi.nlm.nih.gov/articles/PMC10597795/]
- 32. How Assign Weights by Pairwise Comparison works [https://pro.arcgis.com/en/pro-app/latest/tool-reference/analysis/how-assign-weights-by-pairwise-comparison-works.htm]
- 33. Assessment and multi-scenario prediction of ecosystem ... [https://www.frontiersin.org/journals/ecology-and-evolution/articles/10.3389/fevo.2025.1539547/full]
- 34. Consistency ratio and Transitivity Rule. [https://www.spicelogic.com/docs/ahpsoftware/intro/ahp-consistency-ratio-transitivity-rule-388]
- 35. Calculate the consistency ratio for pairwise comparison [https://pro.arcgis.com/en/pro-app/latest/tool-reference/analysis/calculate-the-consistency-ratio.htm]
- 36. Tutorials - Group Decision Making [https://www.spicelogic.com/docs/ahpsoftware/intro/ahp-group-decision-making-395]
- 37. Comparing aggregation methods in large-scale group AHP [https://www.sciencedirect.com/science/article/pii/S0957417422001531]
- 38. Methods for assigning weights to decision makers in group ... [https://dmame-journal.org/index.php/dmame/article/view/35]
- 39. A novel framework for evaluating water resources and ... [https://www.sciencedirect.com/science/article/pii/S2665972725002314]
- 40. Trade-Off Analysis of Ecosystem Services in Regulated ... [https://www.mdpi.com/2071-1050/17/9/3788]
- 41. Multi-Criteria Decision-Making Scenario Insights into ... [https://www.mdpi.com/2073-445X/13/11/1964]
- 42. Water Environment Assessment of Xin'an River Basin in ... [https://www.mdpi.com/2073-4441/17/6/781]
- 43. Assessment of the ecological sustainability of river basins ... [https://www.frontiersin.org/journals/environmental-science/articles/10.3389/fenvs.2022.952692/full]
- 44. Incorporating Ecosystem Services in the Assessment of Water ... [https://pmc.ncbi.nlm.nih.gov/articles/PMC8172509/]
- 45. Review of Methods to Quantify Trade-offs among ... [https://www.researching.cn/articles/OJb23d1fde2e8ca544]
- 46. What is a river basin? Assessing and understanding the ... [https://www.sciencedirect.com/science/article/pii/S0169204621001559]
- 47. Humans versus models: a comparative assessment of ... [https://pmc.ncbi.nlm.nih.gov/articles/PMC11522275/]
- 48. Integrating ecosystem services, stakeholders' perspective ... [https://link.springer.com/article/10.1007/s10980-024-01886-0]
- 49. Ecosystem health assessment based on AHP-DPSR model ... [https://www.sciencedirect.com/science/article/pii/S1470160X22006434]
- 50. Using Analytical Hierarchy Process (AHP) to Introduce ... [https://www.mdpi.com/2071-1050/13/3/1258]
- 51. Application of AHP for the Weighting of Sustainable ... [https://www.mdpi.com/2227-7099/9/4/169]
- 52. Development of a prototype composite index for resilience ... [https://www.sciencedirect.com/science/article/pii/S2665972721000258]
- 53. Evaluation of Ecosystem Service Capacity Using the ... [https://pmc.ncbi.nlm.nih.gov/articles/PMC11992009/]
- 54. An integrative assessment based on land cover [https://www.sciencedirect.com/science/article/pii/S1470160X21003253]
- 55. Integrating Technical, Socio-Economic, and Sustainability ... [https://pubmed.ncbi.nlm.nih.gov/40659858/]
- 56. Combining ecosystem services assessment with structured ... [https://pmc.ncbi.nlm.nih.gov/articles/PMC9446163/]
- 57. Understanding Success Criterion 1.4.3: Contrast (Minimum) [https://www.w3.org/WAI/WCAG21/Understanding/contrast-minimum.html]
- 58. Elements must meet minimum color contrast ratio thresholds [https://dequeuniversity.com/rules/axe/4.8/color-contrast]
- 59. What to Do? Let's Think It Through! Using the Analytic ... [https://kids.frontiersin.org/articles/10.3389/frym.2020.00078]
- 60. Analytic hierarchy process step by step approach and ... [https://www.spicelogic.com/docs/ahpsoftware]
- 61. Selection criteria for ecosystem condition indicators [https://seea.un.org/content/selection-criteria-ecosystem-condition-indicators]
- 62. Eliciting expert judgment to inform management of diverse ... [https://www.sciencedirect.com/science/article/pii/S0301479720306083]
- 63. 15 Stakeholder To Add To Your... - Simply Diagrams Stakeholders [https://simplystakeholders.com/stakeholder-diagrams/]
- 64. 22 Stakeholder to Identify, Analyze, and Manage... | Creately Diagrams [https://creately.com/guides/stakeholder-diagrams/]
- 65. Enhancing consistency of AHP-based expert judgements [https://www.sciencedirect.com/science/article/pii/S2215016125001876]
- 66. Using Visual Cues to Reduce Cognitive Load in BI Tools [https://medium.com/@marketingtd64/using-visual-cues-to-reduce-cognitive-load-in-bi-tools-9346d9d0aa9b]
- 67. Repairing the inconsistent pairwise comparison matrix ... [https://www.nature.com/articles/s41598-025-22310-w]
- 68. The establishment of an eco-environmental evaluation ... [https://www.sciencedirect.com/science/article/pii/S1470160X22011608]
- 69. Spatiotemporal characteristics and optimization strategies of ... [https://pmc.ncbi.nlm.nih.gov/articles/PMC12370055/]
- 70. Ecological vulnerability assessment based on AHP-PSR ... [https://www.sciencedirect.com/science/article/pii/S1470160X21001291]
- 71. Ecosystem Service Assessment and Sensitivity Analysis of ... [https://www.mdpi.com/2073-445X/11/9/1378]
- 72. Ecological sensitivity assessment and driving force ... [https://www.nature.com/articles/s41598-025-18270-w]
- 73. Principles of Effective Data Visualization - PMC [https://pmc.ncbi.nlm.nih.gov/articles/PMC7733875/]
- 74. Contrast Checker [https://webaim.org/resources/contrastchecker/]
- 75. Text has enhanced contrast | ACT Rule | WAI [https://www.w3.org/WAI/standards-guidelines/act/rules/09o5cg/]
- 76. Using color | U.S. Web Design System (USWDS) [https://designsystem.digital.gov/design-tokens/color/overview/]
- 77. An opportunity map approach for agricultural landscapes [https://www.sciencedirect.com/science/article/pii/S1470160X25001414]
- 78. Stakeholder Perception and Priority Gaps in Ecosystem ... [https://www.mdpi.com/1999-4907/16/10/1581]
- 79. Developing Indicators for the Valuation of River Ecosystem ... [https://www.mdpi.com/2073-445X/14/10/2091]
- 80. Comparing stakeholder perspectives and biodiversity ... [https://www.sciencedirect.com/science/article/pii/S0301479725005171]
- 81. Using the Analytic Hierarchy Process (AHP) to understand the ... [https://pmc.ncbi.nlm.nih.gov/articles/PMC4705498/]
- 82. When to Use What: A Comparison of Three Approaches ... [https://www.mdpi.com/2073-445X/14/3/644]
- 83. Exploring the threshold of human activity impact on urban ... [https://www.nature.com/articles/s41598-025-09877-0]
- 84. Unraveling the nonlinear relationship between ecosystem ... [https://link.springer.com/article/10.1007/s10668-025-07018-1]
- 85. Multi Criteria Decision Analysis (MCDA). All You Need to ... [https://www.6sigma.us/six-sigma-in-focus/multi-criteria-decision-analysis-mcda/]
- 86. An Introductory Guide to Multi-Criteria Decision Analysis ... [https://analysisfunction.civilservice.gov.uk/policy-store/an-introductory-guide-to-mcda/]
- 87. A multi-criteria analytical method to assess ecosystem ... [https://www.sciencedirect.com/science/article/abs/pii/S2212041621000267]
- 88. Overview of Existing Multi-Criteria Decision-Making ... [https://www.mdpi.com/2227-7080/13/10/444]
- 89. MCDA applications in chemical alternatives assessment [https://link.springer.com/article/10.1007/s10669-025-10043-0]
- 90. Advantages of AHP (Analytic Hierarchy Process) Over ... [https://onlineoutput.com/advantages-of-ahp-analytic-hierarchy-process-over-intuitive-judgment-in-complex-decision-making/]