Integrated Biologging Frameworks in Movement Ecology: Bridging Data, Theory, and Conservation
This article synthesizes current advancements and applications of integrated biologging frameworks in movement ecology.
Integrated Biologging Frameworks in Movement Ecology: Bridging Data, Theory, and Conservation
Abstract
This article synthesizes current advancements and applications of integrated biologging frameworks in movement ecology. It explores the foundational principles of multi-sensor biologging and the critical need for structured frameworks to guide study design, linking biological questions to appropriate sensor technology and analytical methods. The content delves into methodological innovations, including the use of hidden Markov models for behavioral state identification and the application of biologging data in conservation science to measure individual fitness and population dynamics. It further addresses key challenges in data management, standardization, and interdisciplinary collaboration, offering solutions for troubleshooting and optimization. Finally, the article provides a comparative analysis of different methodological approaches, validating the power of integrated frameworks to reveal cryptic behaviors and ecological processes, with significant implications for wildlife management and ecological forecasting.
The Foundations of Integrated Biologging: From Single Sensors to a Unified Framework
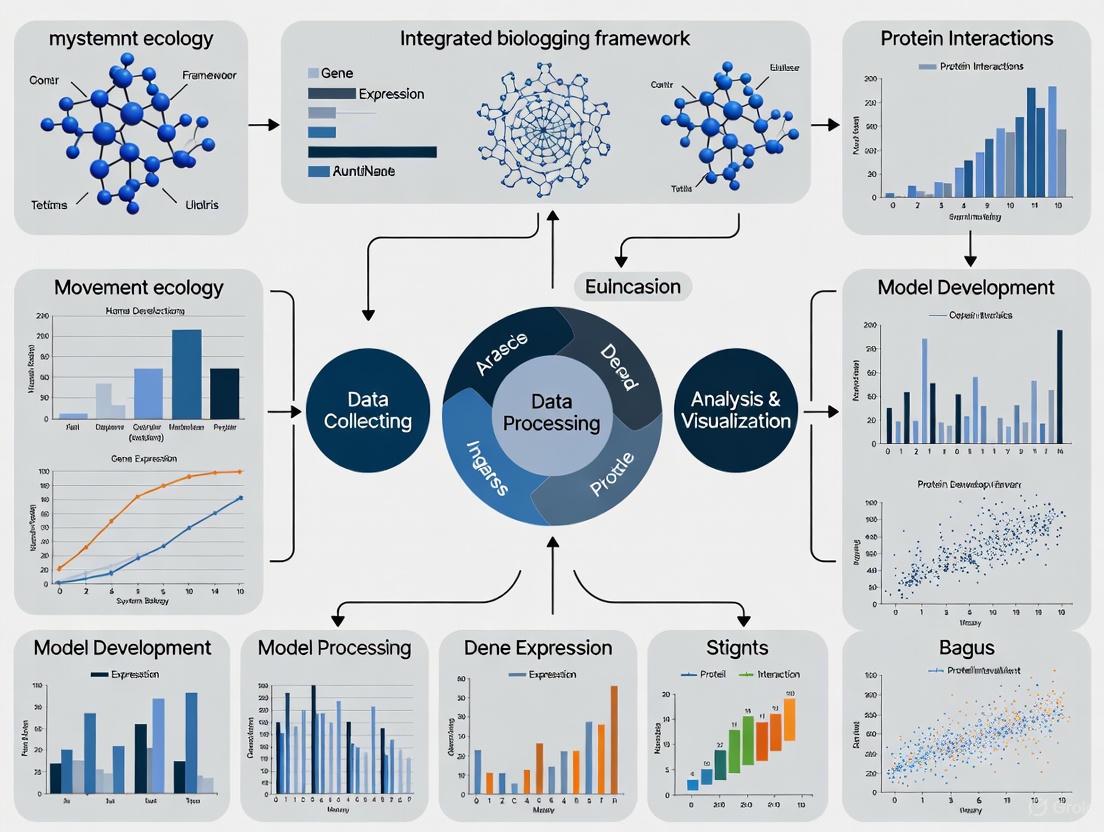
The Integrated Bio-logging Framework (IBF) represents a paradigm-changing approach for movement ecology research, addressing the critical challenge of matching appropriate sensors and analytical techniques to specific biological questions [1]. This framework synthesizes the vast opportunities presented by bio-logging sensors into a structured cycle of questions, sensors, data, and analysis, centrally linked through multi-disciplinary collaboration [1] [2]. By providing a systematic guide for study design and implementation, the IBF enables researchers to transform high-frequency, multivariate data into a mechanistic understanding of animal movement and its role in ecological processes [1]. This technical guide details the core principles, components, and methodologies of the IBF, serving as an essential resource for researchers leveraging animal-attached technology.
Movement constitutes a fundamental aspect of animal life, intrinsically linked to ecological and evolutionary processes from reproduction to species distributions [1]. The revolution in bio-logging sensor technology has enabled researchers to gather behavioural and ecological data that cannot be obtained through direct observation, using devices including accelerometers, magnetometers, gyroscopes, temperature sensors, and cameras [1]. However, with these technological possibilities comes the challenge of selecting appropriate information collection strategies and analytical methods [1].
The Integrated Bio-logging Framework addresses this gap by connecting four critical areas via three nodes in a cycle of feedback loops, linked by multi-disciplinary collaboration [1]. The IBF provides a structured pathway for researchers to navigate study design decisions, whether employing question-driven or data-driven approaches [1]. This framework recognizes that fully leveraging the bio-logging revolution requires not only technological advancement but also significant improvements in the theoretical and mathematical foundations of movement ecology [1].
Core Components of the IBF
The IBF structures the research process into four interconnected components that form a continuous cycle of inquiry and refinement. The diagram below illustrates these relationships and workflows.
Biological Questions
The starting point typically involves formulating precise biological questions, often following the scheme proposed by Nathan et al. (2008) that addresses why animals move, how they move, and what the ecological consequences are [1]. The IBF emphasizes that experimental design must be guided by these questions to ensure appropriate sensor selection and analytical approaches [1]. Research may follow a question-driven approach (hypothesis-testing) or a data-driven approach (pattern-discovery), with the framework providing pathways for both methodologies [1].
Sensor Selection and Optimization
Bio-logging researchers can choose from an ever-increasing array of sensors, making selection critical for addressing specific biological questions [1]. The table below summarizes major sensor types, their applications, and optimization considerations.
Table 1: Bio-logging Sensor Types and Their Applications in Movement Ecology
| Sensor Type | Examples | Primary Applications | Optimization Considerations |
|---|---|---|---|
| Location | Animal-borne radar, pressure sensors, passive acoustic telemetry, proximity sensors | Space use; animal interactions | Use with behavioural sensors; create 3D visualizations for space use interpretation [1] |
| Intrinsic | Accelerometer, magnetometer, gyroscope, heart rate loggers, stomach temperature loggers | Behavioural identification; internal state; 3D movement reconstruction; energy expenditure; feeding activity | Combine with other intrinsic sensors; increase sensitivity for micro-movements; high-resolution environmental data improves accuracy [1] |
| Environmental | Temperature sensors, microphones, proximity sensors, video loggers | Space use; energy expenditure; external factors; interactions | In situ remote sensing; arrays for animal localization; visualizations for contextual understanding [1] |
Multi-sensor approaches represent a new frontier in bio-logging, enabling researchers to observe the unobservable by providing indices of internal state, revealing intraspecific interactions, reconstructing fine-scale movements, and measuring local environmental conditions [1]. For example, combining geolocator and accelerometer tags has revealed flight behaviour of migrating swifts, while micro barometric pressure sensors have uncovered aerial movements of migrating birds [1].
Data Management and Exploration
Bio-logging generates complex, high-volume datasets that present significant challenges in management, exploration, and visualization [1]. The IBF emphasizes:
- Efficient data exploration: Developing methods to navigate complex, multi-dimensional datasets [1]
- Advanced visualization: Implementing multi-dimensional visualization techniques to represent complex relationships [1]
- Appropriate archiving and sharing: Establishing protocols for data preservation and accessibility to maximize research value [1]
The framework highlights that taking advantage of the bio-logging revolution requires handling rich sets of high-frequency multivariate data that expand beyond the fundamentally limited and coarse data collected using location-only technologies like GPS [1].
Analytical Approaches
Matching sensor data to appropriate analytical methods presents significant challenges and opportunities [1]. The IBF addresses:
- Statistical model selection: Choosing models that accommodate the peculiarities of specific sensor data [1]
- Advanced analytical methods: Implementing approaches like machine learning for behaviour identification from tri-axial acceleration data and Hidden Markov Models (HMMs) to infer hidden behavioural states [1]
- Mathematical foundations: Developing new theoretical foundations to properly analyse bio-logging data [1]
The framework advocates for striking a balance between overly simplistic and complex models to deal with the vagaries of specific sensor data, acknowledging limitations such as those present in accelerometer data [1].
Methodological Protocols for IBF Implementation
Multi-Sensor Deployment Protocol
Objective: To simultaneously collect complementary data streams for comprehensive movement analysis.
Materials:
- Primary tracking device (GPS, geolocator, or acoustic transmitter)
- Inertial Measurement Unit (IMU) containing accelerometer, magnetometer, and gyroscope
- Environmental sensors (temperature, pressure, light)
- Appropriate housing and attachment system for target species
- Calibration equipment for pre-deployment sensor validation
Procedure:
- Pre-deployment calibration: Calibrate all sensors in controlled conditions to establish baseline measurements and inter-sensor synchronization [1].
- Sensor programming: Configure sampling rates based on biological question and power constraints, balancing temporal resolution with deployment duration.
- Animal attachment: Deploy tags using species-appropriate methods to minimize behavioural impacts while ensuring sensor orientation consistency.
- Data collection: Record simultaneous data streams throughout deployment period, ensuring proper time-stamping across all sensors.
- Data retrieval and quality assessment: Download data and perform quality checks for sensor malfunctions, data gaps, or synchronization issues.
Data Processing and Integration Workflow
Objective: To transform raw multi-sensor data into integrated, analysis-ready datasets.
Table 2: Research Reagent Solutions: Essential Computational Tools for Bio-logging Data Analysis
| Tool Category | Specific Software/Libraries | Primary Function | Application Examples |
|---|---|---|---|
| Data Processing | R, Python (Pandas, NumPy), MATLAB | Data cleaning, synchronization, and preprocessing | Filtering noisy signals, interpolating missing data, transforming coordinate systems [1] |
| Movement Analysis | adehabitatLT, moveHMM, momentuHMM | Trajectory analysis, behavioural state identification | Path segmentation, residence time analysis, hidden Markov modeling [1] |
| Spatial Analysis | QGIS, ArcGIS, GRASS | Geographic context and environmental correlation | Home range estimation, habitat selection analysis, environmental data extraction [1] |
| Visualization | ggplot2, Matplotlib, Three.js | Multi-dimensional data exploration and representation | 3D path reconstruction, behavioural classification plots, interactive visualizations [1] |
Procedure:
- Data synchronization: Align all sensor data streams using recorded timestamps and correct for any clock drift.
- Sensor fusion: Implement dead-reckoning procedures combining speed (from dynamic body acceleration), animal heading (from magnetometer data), and change in altitude/depth (from pressure data) to reconstruct fine-scale movements [1].
- Behavioural classification: Apply machine learning algorithms or HMMs to identify behavioural states from multi-sensor data, validating with ground-truth observations where possible [1].
- Data reduction: Employ feature extraction and dimensionality reduction techniques to manage data volume while preserving biological signals.
Multi-Disciplinary Collaboration Framework
Objective: To integrate expertise across disciplines for optimal IBF implementation.
Procedure:
- Study inception: Engage physicists and engineers for sensor selection advice and statisticians for study design consultation [1].
- Technology development: Collaborate with engineers and physicists to develop or customize bio-logging tags specific to research needs [1].
- Data analysis: Work with computer scientists, geographers, and statisticians to develop appropriate visualization and analytical methods for complex datasets [1].
- Knowledge transfer: Facilitate bidirectional communication where ecologists identify methodological hurdles and technological limitations needing attention from other disciplines [1].
Advanced Applications and Future Directions
The IBF enables advanced research applications through its structured approach to multi-sensor integration. Dead-reckoning techniques combine inertial measurement units with elevation/depth recording sensors to reconstruct animal movements in 2D and 3D, overcoming limitations of transmission-based tracking when canopy cover impedes GPS fixes or in aquatic environments [1]. This approach uses speed (including speed-dependent dynamic body acceleration for terrestrial animals), animal heading (from magnetometer data), and change in altitude/depth (pressure data) to calculate successive movement vectors [1].
Future developments in bio-logging will require advances in several key areas:
- Sensor technology: Development of smaller, more power-efficient sensors with enhanced sensitivity [1]
- Analytical techniques: Creation of novel statistical approaches capable of handling high-frequency multivariate data [1]
- Visualization methods: Implementation of advanced multi-dimensional visualization for exploring complex datasets [1]
- Theoretical foundations: Improvement of movement ecology theory to incorporate rich bio-logging data [1]
The IBF provides a structured approach for navigating these developments while maintaining focus on biological questions. By emphasizing multi-disciplinary collaboration and continuous refinement through feedback loops, the framework offers a robust methodology for advancing movement ecology research through bio-logging technology [1]. If fully implemented, this approach holds clear potential for developing significantly improved mechanistic understanding of animal movements and their roles in ecological processes, ultimately supporting the creation of more realistic predictive models [1].
The study of movement ecology has been transformed by biologging, the practice of attaching sensor-equipped devices to animals to record data about their physiology, behavior, and environment. Modern biologging relies on a multisensor approach, integrating various sensors to create a comprehensive picture of an animal's movement and state, overcoming the limitations of single-sensor studies [3] [1]. This revolution allows researchers to "observe the unobservable," collecting high-resolution behavioral and ecological data from free-roaming animals in their natural habitats [1]. The paradigm has shifted from simply tracking an animal's location to understanding the underlying drivers of its movement, its energy expenditure, and its interactions with the environment [4].
This shift necessitates an Integrated Bio-logging Framework (IBF), which connects biological questions, sensor selection, data management, and analytical techniques through a cycle of feedback loops, often supported by multi-disciplinary collaborations [1]. Within this framework, the choice of sensors is critically guided by the specific ecological questions being asked [1]. This technical guide provides an overview of the core sensors that form the foundation of this multisensor revolution, detailing their functions, applications, and how they are integrated within a cohesive research strategy for movement ecology.
Core Biologging Sensors and Their Functions
The power of modern biologging stems from the synergistic use of multiple sensors. The table below summarizes the key sensors, their primary functions, and their contributions to movement ecology research.
Table 1: Core Biologging Sensors and Their Ecological Applications
| Sensor Type | Primary Measurements | Key Applications in Movement Ecology | Data Output Examples |
|---|---|---|---|
| GPS | Global position (latitude, longitude), sometimes altitude [3] | Space use, home range analysis, migration routes, habitat selection [1] | Time-stamped positional coordinates |
| Accelerometer | Triaxial dynamic body acceleration and posture [3] | Behavior identification (e.g., running, feeding), energy expenditure (via DBA), biomechanics, dead-reckoning [3] [1] | High-frequency (e.g., 10 Hz) raw acceleration on X, Y, Z axes |
| Magnetometer | Triaxial strength of the Earth's magnetic field [3] | Compass heading (for orientation and dead-reckoning), behavior identification, body orientation [3] | Micro-Tesla measurements on three orthogonal axes |
| Gyroscope | Angular velocity and rate of rotation [1] | 3D movement reconstruction, fine-scale body rotation, maneuverability studies [1] | Degrees per second of rotation |
| Environmental (Temp, Salinity, etc.) | Ambient temperature, salinity, pressure/depth, etc. [5] [1] | Micro-environment recording, oceanography/meteorology, understanding ecological niches [5] | Time-series of environmental parameters |
Sensor Integration and the Dead-Reckoning Technique
A primary example of sensor fusion is dead-reckoning, which allows for the reconstruction of fine-scale, three-dimensional movement paths between intermittent GPS fixes. This technique uses a vector integration process based on data from synchronized sensors [3] [1]. The path is calculated using the animal's speed (which can be derived from accelerometer-based Dynamic Body Acceleration), its heading (from the tilt-compensated magnetometer), and the change in altitude or depth (from a pressure sensor) [1]. This method is particularly valuable in environments where GPS signals are unreliable, such as underwater, in dense canopy cover, or during rapid, maneuvering flight [1].
Diagram: Sensor Integration for Animal Movement Reconstruction
Experimental Protocols and Methodologies
Field Testing of an Integrated Multisensor Collar (IMSC)
A 2024 study developed and field-tested a custom Integrated Multisensor Collar (IMSC) on 71 free-ranging wild boar (Sus scrofa), providing a robust protocol for hardware deployment and data validation [3].
- Collar Design and Sensors: The IMSC included a "Daily Diary" data logger equipped with a triaxial accelerometer and a triaxial magnetometer, recording continuously at 10 Hz. It was integrated with a GPS collar scheduled to record positional fixes at 30-minute intervals. All data were stored on a removable 32 GB MicroSD card [3].
- Deployment and Animal Welfare: Boar were captured using corral traps or dart tranquilization, sedated, and fitted with the collar. Collars were equipped with a drop-off mechanism and a VHF beacon for recovery, ensuring animal welfare and instrument retrieval. The study reported a 94% collar recovery rate [3].
- Ground-Truthing Behavior: To validate the behavioral classification algorithm, a semi-natural enclosure was outfitted with four infrared game cameras. These cameras recorded ground-truth behavioral data from six collared boar, which were later used to train and test the machine learning model [3].
- Performance and Durability: The field test demonstrated exceptional performance, with a 75% cumulative data recording success rate and a maximum continuous logging duration of 421 days, highlighting the potential for long-term studies [3].
Machine Learning for Behavioral Classification
A critical step in analyzing multisensor data is translating raw sensor readings into ecologically meaningful behaviors. The wild boar study developed a machine learning classifier capable of identifying six behaviors from accelerometer data [3].
- Data Preparation: High-frequency (10 Hz) accelerometer data were collected from collared animals. Simultaneous video recordings from the enclosure were used to label the accelerometer data streams with specific behaviors (e.g., foraging, walking, resting).
- Model Training and Validation: The labeled data were used to train a machine learning model (e.g., a random forest or neural network). The model learned the unique "signature" of each behavior based on features derived from the acceleration profiles.
- Accuracy Assessment: The overall accuracy of the classifier was 85% for identifying the six behavioral classes when tested on data from multiple collar designs. The accuracy improved to 90% when tested exclusively on data from the optimized IMSC, demonstrating the importance of standardized equipment [3].
Calibration of Magnetic Heading Data
The use of magnetometers for compass heading requires precise calibration to ensure data quality. The same study provided a detailed characterization of magnetic heading data [3].
- Tilt-Compensation: Raw magnetometer readings are influenced by the sensor's orientation (tilt). To derive a true magnetic heading, the triaxial accelerometer data must be used to calculate the sensor's pitch and roll, allowing for tilt-compensation of the magnetometer vector [3].
- Laboratory and Field Validation: The calibrated magnetic headings were validated in both laboratory and field settings. The results showed a high degree of accuracy, with median magnetic headings deviating from known ground-truth orientations by only 1.7° in the lab and 0° in the field, confirming the reliability of the method for dead-reckoning and orientation studies [3].
The Scientist's Toolkit: Key Research Reagents and Materials
Successful multisensor biologging research relies on a suite of specialized hardware, software, and platforms. The following table details essential "research reagents" for the field.
Table 2: Essential Toolkit for Multisensor Biologging Research
| Tool Category | Specific Example(s) | Function and Purpose |
|---|---|---|
| Integrated Hardware | Integrated Multisensor Collar (IMSC) [3] | All-in-one device containing GPS, accelerometer, and magnetometer for long-term field deployment on terrestrial mammals. |
| Data Loggers | Wildbyte Technologies Daily Diary tag [3] | A core data logger unit that records high-frequency raw data from accelerometer and magnetometer sensors onto local storage. |
| Data Sharing & Standardization Platforms | Movebank [5] | A global database for sharing, managing, and analyzing animal tracking data, hosting billions of data points. |
| Biologging intelligent Platform (BiP) [5] | A platform for standardizing sensor data and metadata according to international conventions, facilitating interdisciplinary reuse. | |
| Analytical & OLAP Tools | Online Analytical Processing (OLAP) in BiP [5] | A tool within BiP that calculates environmental parameters (e.g., surface currents, ocean winds) from animal-collected data. |
| Animal Welfare & Recovery | Drop-off Mechanism & VHF Beacon [3] | Critical components for the safe, non-permanent deployment of collars and for relocating and retrieving the equipment. |
Data Management and Analytical Frameworks
The multisensor revolution generates vast, complex datasets, creating a "big data" challenge that requires sophisticated management and analysis strategies [1].
- The Need for Standardization: A significant hurdle in biologging is the lack of consensus on data formats and analytical approaches, which hinders comparison between studies [3] [5]. Initiatives like the Biologging intelligent Platform (BiP) address this by storing sensor data alongside detailed, standardized metadata (e.g., animal sex, body size, deployment details) in internationally recognized formats [5]. This makes data Findable, Accessible, Interoperable, and Reusable (FAIR).
- Advanced Analytical Techniques: Analyzing multisensor data often moves beyond traditional statistical methods. Researchers now routinely use:
- Multi-Disciplinary Collaboration: The IBF emphasizes that taking full advantage of biologging requires multi-disciplinary collaborations between ecologists, engineers, physicists, computer scientists, and statisticians [1]. Such collaborations are essential for tackling the technological and analytical challenges presented by modern biologging data.
Diagram: The Integrated Bio-logging Framework (IBF)
The integration of GPS, accelerometers, magnetometers, gyroscopes, and environmental sensors has fundamentally changed the scale and scope of movement ecology research. This multisensor approach, operating within a structured Integrated Bio-logging Framework, allows researchers to move from simply tracking animals to understanding the mechanics, drivers, and energetic costs of their behavior [1] [4]. Future directions in the field include refining sensor technology to be smaller, less power-intensive, and capable of measuring new parameters, and developing more sophisticated analytical models to fully leverage the rich, multivariate data streams [1].
Key future applications involve using these tools to understand animal responses to global change. For instance, biologging can help identify nuanced energetic costs and gains in predators, revealing how climate change and land use shifts alter predator-prey dynamics [4]. As the field continues to evolve, the focus will increasingly be on fostering collaboration and standardizing data practices to ensure that the vast potential of the multisensor biologging revolution is fully realized for both theoretical ecology and wildlife conservation.
The paradigm-changing opportunities of bio-logging sensors for ecological research, especially movement ecology, are vast. However, a significant challenge remains: pinpointing the most appropriate sensors and sensor combinations for specific biological questions [1]. The Integrated Bio-logging Framework (IBF) addresses this challenge directly by creating a structured cycle of feedback loops connecting four critical areas: biological questions, sensors, data, and analysis, all linked by multi-disciplinary collaboration [1]. This guide details a question-driven approach within the IBF, helping researchers navigate the crucial first step of matching sensors to their core research objectives, thereby optimizing study design from its inception.
The Question-to-Sensor Nexus
Following the adage that experimental design should be guided by the questions asked, sensor choice is a critical decision that can determine the success of a bio-logging study [1]. The IBF provides a structured pathway for this, starting with a clearly defined biological question.
The diagram below illustrates the primary workflow of this question-driven approach, guiding researchers from a broad question to specific sensor suites and analytical techniques.
A Detailed Guide to Sensor Selection for Core Biological Questions
To effectively implement the framework above, researchers need a detailed reference linking specific research objectives to the most appropriate sensors and data processing techniques. The following table provides a comprehensive breakdown of this question-to-sensor mapping, incorporating key parameters and analytical methodologies.
Table 1: Matching core biological questions to appropriate biologging sensors and analytical methods.
| Core Biological Question | Primary Sensor Suites | Key Measured Parameters | Common Analytical Methods |
|---|---|---|---|
| Where is the animal going? (Movement Paths & Space Use) | GPS, Argos, Geolocators, Pressure Sensor (Altitude/Depth) [1] | Horizontal position (Latitude, Longitude), Altitude, Dive Depth, Time [5] | State-Space Models, Home Range Analysis (e.g., Kernel Density), Habitat Selection Models [1] |
| Why does the animal move? (Internal State & Behavior) | Accelerometer, Magnetometer, Heart Rate Logger, Stomach Temperature Logger, Microphone [1] | Body Posture, Dynamic Movement, Body Rotation/Orientation, Heart Rate, Feeding Events, Vocalizations [1] | Machine Learning (for Behavior Identification), Hidden Markov Models (HMMs), Energetics Models [1] |
| How does the animal move? (Movement Mechanics & Energetics) | Accelerometer, Gyroscope, Speed Paddle, Pitot Tube, Video Logger [1] | Body Acceleration (Dynamic Body Acceleration - DBA), Body Rotation, Speed, Wing/Fluke Beat Frequency [1] | Dead-reckoning for 3D Path Reconstruction, Dynamic Body Acceleration (DBA) analysis, Biomechanical Modeling [1] |
| What is the surrounding environment? (Environmental Context) | Temperature Sensor, Salinity Sensor, Microphone, Proximity Sensor [1] | Ambient Temperature, Salinity, Soundscape, Presence of Conspecifics/Predators/Prey [1] | Spatial Analysis, In-situ Remote Sensing, Environmental Correlation with Animal Behavior [1] |
Advanced Multi-Sensor Approaches and Workflows
For complex research objectives, a single-sensor approach is often insufficient. Multi-sensor approaches represent a new frontier in bio-logging, enabling a more holistic understanding of animal ecology [1]. Combining locational tracking devices with behavioral and environmental sensors is particularly powerful for uncovering hidden aspects of animal lives.
The following diagram outlines a specific integrated workflow for reconstructing fine-scale 3D movements, a common application of multi-sensor data fusion.
The Researcher's Toolkit: Essential Research Reagents and Materials
Executing a successful biologging study requires a suite of specialized hardware, software, and platforms. The following table details the essential "research reagents" and their functions within the modern biologging toolkit.
Table 2: Essential materials and platforms for biologging research, their types, and primary functions.
| Tool Name / Type | Category | Primary Function | Key Feature / Note |
|---|---|---|---|
| Satellite Relay Data Logger (SRDL) | Hardware | Transmits compressed data (dive profiles, depth-temperature) via satellite; enables long-term (1+ year) deployment without recapture [5]. | Critical for observing in inaccessible regions (e.g., Arctic sea ice) via animals like seals [5]. |
| Inertial Measurement Unit (IMU) | Hardware | A sensor suite combining accelerometers, magnetometers, and gyroscopes to measure body posture, movement, and rotation [1]. | Enables dead-reckoning for fine-scale 3D path reconstruction, especially when GPS fails [1]. |
| Movebank | Data Platform | A web-based database for managing, sharing, and analyzing animal tracking data [5]. | One of the largest databases, containing billions of location and sensor data points across numerous taxa [5]. |
| Biologging intelligent Platform (BiP) | Data Platform | An integrated platform for sharing, visualizing, and analyzing standardized biologging data and metadata [5]. | Features Online Analytical Processing (OLAP) tools to calculate environmental parameters from animal data [5]. |
| AniBOS | Network/Initiative | A global observation system that leverages animal-borne sensors to gather physical environmental data [5]. | Aims to complement traditional ocean observation systems like Argo floats, particularly in shallow waters [5]. |
| Hidden Markov Models (HMMs) | Analytical Method | A statistical model used to infer hidden behavioral states from sequential sensor data (e.g., acceleration) [1]. | Powerful for segmenting continuous behavior into discrete states like "foraging," "traveling," or "resting." [1]. |
Experimental Protocols and Data Standards
Protocol for Dead-Reckoning 3D Path Reconstruction
Purpose: To reconstruct the fine-scale, three-dimensional movement path of an animal using data from an IMU and a pressure sensor, which is particularly useful when GPS signals are unavailable (e.g., during diving or under canopy cover) [1].
Methodology:
- Sensor Deployment: Securely attach a tag containing a tri-axial accelerometer, tri-axial magnetometer, and pressure sensor to the study animal.
- Data Collection: Record high-frequency (e.g., 10-25 Hz) data from all sensors. A known start position (e.g., from a GPS fix obtained before a dive) is required [1].
- Data Processing:
- Speed Estimation: Calculate the animal's speed through the medium. For aquatic and terrestrial animals, this can be derived from Dynamic Body Acceleration (DBA) [1].
- Heading Calculation: Use the magnetometer and accelerometer data to compute the animal's heading vector, compensating for the body's orientation [1].
- Depth/Altitude Change: Extract the change in vertical position from the pressure sensor data.
- Path Reconstruction: Using the dead-reckoning procedure, calculate successive movement vectors. Each new position is calculated from the previous position using the formula: New position = Previous position + (Speed × Heading vector) + Change in depth/altitude [1]. This process is repeated iteratively to reconstruct the full 3D path.
Protocol for Behavioral State Identification using Accelerometry
Purpose: To classify animal behavior into discrete states (e.g., foraging, traveling, resting) from tri-axial accelerometer data.
Methodology:
- Data Collection: Deploy accelerometers set to record at a high frequency (e.g., 20 Hz) to capture the detail of body movements.
- Data Preprocessing: Calculate summary statistics (e.g., VeDBA, pitch, roll) over a sliding window (e.g., 3-5 seconds) from the raw acceleration data.
- Model Training: Use a machine-learning classifier (e.g., Random Forest, Support Vector Machine). Input the summary statistics from a labeled training dataset where behaviors are known from direct observation or video validation.
- Behavior Prediction: Apply the trained model to unlabeled accelerometer data to predict behavioral states across the entire dataset [1].
Data and Metadata Standardization
Adhering to international standard formats for metadata is crucial for data sharing, collaboration, and secondary use. Platforms like the Biologging intelligent Platform (BiP) enforce standards that ensure interoperability [5]. Key metadata should include:
- Animal Traits: Species (using Integrated Taxonomic Information System - ITIS), sex, body size, breeding status [5].
- Instrument Details: Device type, manufacturer, sensor specifications, firmware version [5].
- Deployment Information: Who deployed the device, when and where it occurred, and attachment method [5].
- Sensor Data Formatting: Standardize column names, use ISO8601 date-time formats, and consistent file types to facilitate integration and reuse [5].
The Critical Role of Multi-Disciplinary Collaboration in Modern Movement Ecology
The field of movement ecology is undergoing a profound transformation, driven by technological advancements in bio-logging and the increasing complexity of ecological questions. This transformation necessitates a shift from isolated research to integrated, multi-disciplinary collaboration. The development of an Integrated Bio-logging Framework (IBF) provides a structured approach to connect biological questions with appropriate sensors, data management, and analytical techniques through synergistic partnerships among ecologists, engineers, physicists, statisticians, and computer scientists [1]. Such collaborations are critical not only for addressing fundamental questions about animal movement but also for leveraging animal-borne data to contribute to complementary fields such as oceanography, meteorology, and conservation science [5]. This whitepaper outlines the core components, methodologies, and benefits of this collaborative paradigm, providing researchers with a guide for navigating the future of movement ecology.
Movement ecology seeks to understand the causes, mechanisms, patterns, and consequences of animal movement, a fundamental process linking individual behavior to ecosystem dynamics [1]. The advent of bio-logging—using animal-borne sensors to record data—has unlocked the ability to observe the previously unobservable, from the deep-diving behaviors of marine mammals to the transcontinental migrations of birds [5]. However, the paradigm-changing opportunities offered by these technologies bring new challenges. The optimal matching of sensors to biological questions, the management and visualization of large, complex datasets, and the development of novel analytical methods require expertise that no single ecologist can possess [1]. Consequently, establishing multi-disciplinary collaborations has become the cornerstone of modern movement ecology, enabling the field to fully capitalize on technological progress and address pressing ecological issues in an increasingly changing world.
The Integrated Bio-logging Framework (IBF): A Cycle of Collaboration
The Integrated Bio-logging Framework (IBF) offers a conceptual model for designing and executing effective movement ecology studies [1]. It connects four critical areas—biological questions, sensor technology, data exploration, and analysis—within a cycle of feedback loops, linked intrinsically by multi-disciplinary collaboration.
The following diagram illustrates the workflow and collaborative interactions within this framework:
Researchers can navigate the IBF via different pathways. A question-driven approach starts with a specific biological hypothesis, which then informs sensor selection and deployment strategies. Alternatively, a data-driven approach might begin with the capabilities of a new sensor or a newly available large dataset, which then inspires novel ecological questions [1]. In both scenarios, collaboration is the engine that powers the cycle, ensuring that each stage is informed by the best available expertise.
Disciplinary Roles and Contributions
The effectiveness of the IBF hinges on the integration of diverse, specialized knowledge. The table below details the key disciplines involved and their primary contributions to movement ecology research.
Table 1: Key Disciplines in Movement Ecology Collaboration
| Discipline | Core Contribution | Specific Expertise/Output |
|---|---|---|
| Ecology & Biology | Provides the foundational biological questions and context. | Knowledge of species' biology, behavior, and ecology; defines research objectives and interprets results within an ecological framework [1]. |
| Engineering & Physics | Designs, develops, and advises on sensor technology. | Creates miniaturized tags; advises on sensor limitations, power requirements, and data transmission; develops new sensing capabilities [1]. |
| Statistics & Mathematics | Develops analytical models and statistical frameworks. | Creates state-space models, Hidden Markov Models (HMMs), step-selection functions, and point process models; handles complex, autocorrelated data [6] [1]. |
| Computer Science & Geography | Manages, visualizes, and processes complex datasets. | Develops tools for data archiving, sharing, and visualization; creates algorithms for movement path reconstruction (e.g., dead-reckoning) and GIS analysis [1]. |
| Oceanography & Meteorology | Utilizes animal-borne environmental data and provides context. | Uses data from animals to profile ocean temperature/salinity and estimate surface currents/winds; integrates biologging data into physical models [5]. |
Collaborative Methodologies in Data Analysis
A prime example of this collaborative spirit is the development and comparison of advanced statistical methods for analyzing animal tracking data. Movement data are complex, featuring strong spatial and temporal autocorrelations that must be accounted for to produce robust inferences [6]. Different analytical approaches have been developed from different philosophical viewpoints, and their performance varies significantly.
Comparison of Analytical Methods
A simulation-based study compared four frequently used methods for inferring habitat selection and large-scale attraction/avoidance [6]:
- Spatial Logistic Regression Models (SLRMs): Frequently exceeded nominal Type I error rates, making them unreliable for many applications.
- Step Selection Models (SSMs): May slightly exceed Type I error rates.
- Spatio-Temporal Point Process Models (ST-PPMs): Showed nominal Type I error rates in all studied cases and are derived from a population-level viewpoint.
- Integrated Step Selection Models (iSSMs): Showed nominal Type I error rates and had, on average, more robust and higher statistical power than ST-PPMs. iSSMs integrate movement parameters with resource selection, offering a mechanistic, individual-based viewpoint [6].
The study concluded that iSSMs are recommended for inferring habitat selection from tracking data due to their robust error rates, high statistical power, short computation times, and predictive capacity [6]. The development and refinement of such methods are direct outcomes of collaboration between ecologists and statisticians.
From Individual Tracks to Population-Level Movements
Collaboration also enables the scaling of inferences from individuals to populations. While fine-scale tracking data are powerful, they are often limited to a small number of individuals. To understand macro-scale patterns like range shifts and migrations, researchers are increasingly turning to broad-scale occurrence data from sources like [7]:
- Crowdsourced databases (e.g., eBird, iNaturalist)
- Automated sensor networks (e.g., weather radar, camera traps, acoustic monitors)
Analyzing these data to infer spatially continuous population-level movements requires collaborative development of novel statistical models that can account for spatial and temporal sampling bias. This approach provides ecological insights into climate tracking, invasive species spread, and conservation of mobile populations, complementing the insights from focal tracking studies [7]. The analytical workflow for this process is complex and requires input from multiple experts, as shown in the following diagram:
Enabling Collaboration Through Shared Platforms
Standardized data platforms are vital tools for sustaining multi-disciplinary collaboration. They facilitate data sharing, ensure reproducibility, and enable secondary use of biologging data in fields beyond biology.
The Biologging Intelligent Platform (BiP)
The Biologging intelligent Platform (BiP) is an integrated platform for sharing, visualizing, and analyzing biologging data [5]. Its features exemplify how technology can support collaboration:
- Data Standardization: Stores sensor data and metadata in internationally recognized standard formats, addressing the challenge of inconsistent data formats from different sensors and manufacturers [5].
- Online Analytical Processing (OLAP): Integrated tools calculate environmental parameters, such as surface currents and ocean winds, from data collected by animals, directly serving the needs of oceanographers and meteorologists [5].
- Open Data Access: Data can be shared openly under a CC BY 4.0 license, permitting reuse and modification, which accelerates collaborative and interdisciplinary research [5].
Other Key Databases
- Movebank: A global database that houses over 7.5 billion location points and 7.4 billion other sensor records across 1,478 taxa (as of January 2025), serving as a central archive for animal tracking data [5].
- AniBOS (Animal Borne Ocean Sensors): A global project establishing a standardized ocean observation system that leverages animal-borne sensors, integrating biologging directly into global environmental monitoring efforts [5].
Table 2: Essential Research Reagents and Platforms in Movement Ecology
| Category | Item/Platform | Function & Collaborative Role |
|---|---|---|
| Data Platforms | Biologging intelligent Platform (BiP) | Standardized platform for sharing, visualizing, and analyzing sensor data and metadata; enables data reuse across disciplines [5]. |
| Movebank | Large central database for animal tracking data; facilitates meta-analyses and collaborative research by aggregating global datasets [5]. | |
| Sensor Types | Satellite Relay Data Loggers (SRDL) | Transmits compressed data (e.g., dive profiles, temperature) via satellite; key for collecting oceanographic data from marine animals [5]. |
| Inertial Measurement Units (IMUs) | Combines accelerometers, magnetometers, gyroscopes; enables fine-scale movement reconstruction (dead-reckoning) and behavioral classification [1]. | |
| Analytical Tools | Integrated Step Selection Models (iSSMs) | Statistically robust method to infer habitat selection and movement mechanisms; combines movement parameters with environmental covariates [6]. |
| Hidden Markov Models (HMMs) | Infers unobserved behavioral states from movement data; crucial for connecting movement paths to underlying behaviors [1]. |
The future of movement ecology will be shaped by further technological and analytical advancements, nearly all of which will rely on deepened multi-disciplinary collaboration. Key frontiers include:
- Multi-sensor approaches: Fusing data from accelerometers, magnetometers, video, and physiological sensors to create a more holistic view of animal life [1].
- Advanced theory and models: Improving the theoretical foundations of movement ecology to properly leverage high-frequency, multivariate data streams [1].
- Linking individual and population levels: Further developing frameworks to connect fine-scale individual tracking with broad-scale occurrence data for a unified understanding of movement [7].
- Global ecosystem monitoring: Tightly integrating biologging data from platforms like BiP and AniBOS into existing environmental monitoring networks to provide critical data on global change [5].
Movement ecology has evolved from a discipline focused primarily on describing where animals go to one that seeks a mechanistic understanding of how and why they move, and what the consequences are for ecological processes. This evolution has been powered by a multi-disciplinary collaborative approach, formally embodied in the Integrated Bio-logging Framework. The integration of ecology with engineering, statistics, computer science, and the physical sciences is not merely beneficial but essential for tackling the complex challenges of modern movement ecology. By fostering these collaborations and leveraging shared infrastructure like BiP, researchers can continue to advance the field, build realistic predictive models, and generate critical knowledge for the conservation and management of species in a rapidly changing world.
From Data to Discovery: Methodological Innovations and Conservation Applications
Behavioral State Modeling with Hidden Markov Models (HMMs) to Decode Cryptic Behaviors
Hidden Markov Models (HMMs) represent a powerful statistical framework for inferring unobserved behavioral states from sequential observation data. In movement ecology, HMMs have become indispensable tools for identifying cryptic animal behaviors from biologging data, where direct observation is impossible [8] [9]. The core concept involves modeling a system as a Markov process with hidden states that generate observable outputs. These models are particularly valuable for segmenting animal movement tracks into behavioral states such as foraging, traveling, and resting based on patterns in movement metrics [9] [10].
The integration of HMMs within an Integrated Bio-logging Framework (IBF) enables researchers to address fundamental questions about animal movement, behavior, and ecology [1]. This framework connects biological questions with appropriate sensor technologies, analytical methods, and data management strategies through multidisciplinary collaboration. Within this context, HMMs serve as a critical analytical component that transforms raw sensor data into biologically meaningful behavioral classifications, thereby uncovering the hidden drivers of animal movement and space use [11] [1].
Theoretical Foundations of Hidden Markov Models
Core Mathematical Structure
A Hidden Markov Model is formally defined by five key elements [8]:
- State Space (S): A set of N hidden states representing behavioral modes (e.g., resting, foraging, traveling)
- Observation Alphabet (V): Possible observable outputs (e.g., step lengths, turning angles, sensor readings)
- Transition Probability Matrix (A): An N×N matrix where aij represents the probability of transitioning from state i to state j
- Emission Probability Distribution (B): Probability distributions of observations given hidden states, where bi(k) is the probability of observation k in state i
- Initial State Distribution (π): Probabilities of starting in each hidden state
The Markov property dictates that the future state depends only on the current state, not the entire history: P(qt+1 = j | qt = i, qt-1 = k, ...) = P(qt+1 = j | qt = i) [8].
The Three Fundamental Problems
HMMs address three core problems in behavioral inference [8]:
- Evaluation: Computing the probability of an observation sequence given a model, solved by the Forward Algorithm
- Decoding: Determining the most likely sequence of hidden states given observations, solved by the Viterbi Algorithm
- Learning: Estimating model parameters (A, B, π) from observation sequences, typically solved by the Baum-Welch algorithm (a variant of Expectation-Maximization)
Table 1: Key Algorithms for Hidden Markov Model Implementation
| Algorithm | Purpose | Key Mechanism | Application in Movement Ecology |
|---|---|---|---|
| Forward Algorithm | Compute sequence probability | Dynamic programming with forward variables | Model selection and validation |
| Viterbi Algorithm | Find most likely state sequence | Dynamic programming maximizing path probability | Behavioral classification from tracking data |
| Baum-Welch Algorithm | Estimate model parameters | Expectation-Maximization | Unsupervised model training from observation data |
HMMs in Animal Movement Analysis
From Movement Data to Behavioral States
In movement ecology, HMMs typically use step lengths (distance between consecutive locations) and turning angles (direction changes between steps) as observable inputs to infer discrete behavioral states [9] [10]. The model assumes that different behaviors produce distinct movement signatures: directed movement exhibits long step lengths with small turning angles, while foraging behavior shows short step lengths with large turning angles [10].
The first-Difference Correlated Random Walk with Switching (DCRWS) represents a popular HMM framework for animal movement that models the first differences of locations (dt = xt - xt-1) as a correlated random walk whose parameters depend on behavioral state [9]. The process equation is:
dt = γbt-1T(θbt-1)dt-1 + N2(0,Σ)
Where γbt-1 represents state-dependent autocorrelation in speed and direction, T(θbt-1) is a rotational matrix based on the turning angle θbt-1, and N2(0,Σ) is a bivariate Gaussian error term [9].
Practical Implementation Considerations
Implementing HMMs for behavioral classification requires careful consideration of several factors [9] [10]:
- Data Resolution: Appropriate sampling intervals (e.g., 5-15 minutes for GPS fixes) to capture biologically relevant behaviors
- State Definition: Meaningful behavioral states relevant to the species and ecological context
- Model Selection: Determining the appropriate number of states using information criteria (AIC, BIC)
- Validation: Assessing model performance through auxiliary sensors or direct observation
Table 2: Behavioral States Commonly Identified by HMMs in Movement Ecology
| Behavioral State | Movement Characteristics | Biological Interpretation | Typical Sensor Data Features |
|---|---|---|---|
| Directed Travel | Long step lengths, low turning angle persistence | Migration, transiting between areas | Consistent speed and direction |
| Area-Restricted Search | Short step lengths, high turning angle rate | Foraging, searching | Tortuous movement patterns |
| Resting | Minimal displacement, variable turning angles | Sleeping, roosting | Low activity, consistent positioning |
Experimental Protocols and Methodologies
Sensor Deployment and Data Collection
Effective HMM analysis begins with appropriate sensor deployment. The following protocol outlines standard methodology for collecting movement data for behavioral classification [10] [12]:
Animal Capture and Handling: Researchers capture animals using species-appropriate methods (e.g., mist nets for birds, cage traps for mammals) during biologically relevant periods (e.g., breeding season). Handling time should be minimized to reduce stress.
Device Selection and Attachment: Select biologging devices based on research questions, animal size, and environmental conditions. Devices should typically not exceed 3% of body mass for flying birds [12]. Attachment methods include:
- Tesa tape for feathers
- Custom-fitted collars for mammals
- Glue or epoxy for marine animals
Sensor Configuration: Program devices with appropriate sampling regimes:
- GPS: 1-15 minute intervals depending on battery life and research questions
- Accelerometers: 10-25 Hz sampling frequency
- Magnetometers: 10-25 Hz sampling frequency
- Additional sensors: Wet-dry, temperature, pressure sensors as needed
Data Recovery: Devices may be recovered through direct recapture, remote download, or satellite transmission depending on system capabilities.
Data Preprocessing Pipeline
Raw sensor data requires substantial preprocessing before HMM analysis [12]:
Data Calibration: Sensor orientation and calibration using known references (e.g., gravity vector for accelerometers)
Coordinate Transformation: Aligning device frames with animal body axes (surge, sway, heave) using rotation matrices
Movement Metric Calculation:
- Step length: Euclidean distance between consecutive positions
- Turning angle: Angular difference between consecutive movement directions
- Acceleration: Dynamic Body Acceleration (DBA) for energy expenditure estimation
Data Standardization: Normalizing variables to comparable scales for model stability
HMM Fitting and Validation
The modeling protocol typically follows these steps [9] [10]:
Initial Model Specification: Define number of states and initial parameter estimates based on exploratory data analysis
Model Fitting: Implement estimation algorithms (e.g., maximum likelihood via forward algorithm) using specialized software (e.g.,
moveHMM,momentuHMMin R)Model Diagnostics: Assess convergence, parameter identifiability, and goodness-of-fit
Behavioral Classification: Apply the Viterbi algorithm to decode the most likely sequence of behavioral states
Validation: Compare HMM classifications with:
- Direct behavioral observations
- Auxiliary sensor data (accelerometers, wet-dry sensors, TDR)
- Expert interpretation of track patterns
Workflow for Behavioral State Classification with HMMs
The Scientist's Toolkit: Research Reagent Solutions
Table 3: Essential Research Tools for HMM-Based Behavioral Analysis
| Tool Category | Specific Examples | Function in Behavioral Research | Implementation Considerations |
|---|---|---|---|
| Positioning Sensors | GPS loggers, Argos tags, Acoustic telemetry arrays | Provide location data for calculating movement metrics | Accuracy, sampling frequency, deployment duration |
| Inertial Measurement Units (IMUs) | Accelerometers, Magnetometers, Gyroscopes | Capture fine-scale movement and body orientation | Sampling rate, sensor alignment, data volume |
| Environmental Sensors | Temperature loggers, Wet-dry sensors, Time-Depth Recorders (TDR) | Contextualize behavior with environmental conditions | Sensor calibration, synchronization |
| Data Processing Tools | R packages (moveHMM, momentuHMM), MATLAB, Python (hmmlearn) |
Implement HMM algorithms and analyze results | Computational efficiency, model flexibility |
| Validation Instruments | Camera traps, Direct observation, Auxiliary biologgers | Ground-truth HMM classifications | Deployment logistics, data alignment |
Advanced Applications and Integrative Frameworks
Integrated HMM-SSF Approaches
Recent methodological advances have integrated HMMs with Step Selection Functions (SSFs) to jointly estimate behavioral state transitions and habitat selection [11]. The HMM-SSF framework models the probability of a step ending at location yt+1 given it started at yt as:
p(yt+1 | yt) = [w(yt, yt+1) φ(yt+1 | yt)] / [∫z∈Ω w(yt, z) φ(z | yt) dz]
Where w(·) is a habitat selection function, φ(·) is a movement kernel, and Ω is the study area [11]. This integrated approach allows behavior-dependent habitat selection analysis while properly accounting for uncertainty in behavioral classification.
Multi-Sensor Data Fusion
HMMs can effectively integrate multiple data streams to improve behavioral classification accuracy [10] [12]. For example, combining GPS with accelerometer data significantly enhances behavior identification precision, particularly for discriminating between behaviors with similar movement patterns but different body postures or energy expenditure [12]. Magnetometer data further improves classification of low-acceleration behaviors like soaring flight in birds [12].
Multi-Sensor Data Fusion for Enhanced Behavioral Classification
Semi-Supervised Approaches for Challenging Systems
In homogeneous environments where movement patterns between behaviors are less distinct (e.g., tropical oceans), HMM classification accuracy can be improved through semi-supervised learning [10]. This approach uses a small subset of known behaviors from auxiliary sensors to inform the classification of the entire dataset. Research demonstrates that even limited supervision (e.g., 9% of the dataset) can significantly improve overall model accuracy (e.g., from 0.77 to 0.85) [10].
The application of HMMs in movement ecology continues to evolve with technological and methodological advances. Future directions include:
- Individual Heterogeneity: Developing HMMs that account for individual differences in movement strategies and behavioral responses
- Multi-Scale Analysis: Integrating fine-scale behavioral classifications with broad-scale movement patterns and population processes
- State-Dependent Drivers: Modeling how environmental covariates influence both transition probabilities and within-state movement parameters
- Real-Time Applications: Implementing HMMs for near real-time behavioral monitoring and conservation interventions
Within the Integrated Bio-logging Framework, HMMs serve as a critical analytical bridge between raw sensor data and biological interpretation [1]. By transforming complex, high-dimensional sensor data into meaningful behavioral sequences, HMMs enable researchers to address fundamental questions about animal behavior, ecology, and conservation across diverse taxa and ecosystems.
The continued development of HMM methodologies—including integrated HMM-SSF approaches, multi-sensor data fusion, and semi-supervised learning—promises to further enhance our ability to decode cryptic behaviors from animal movement data, ultimately advancing our understanding of how animals interact with their environments and respond to environmental change.
In movement ecology, accurately reconstructing the fine-scale movements of animals is fundamental to understanding their behavior, energy expenditure, and habitat use. Traditional tracking technologies, such as Global Positioning System (GPS), provide intermittent positional fixes but are constrained by a fundamental trade-off between battery life and sampling frequency [13]. This often results in sub-sampled animal paths that miss critical fine-scale behaviors and introduce biases in the interpretation of movement data [13] [1]. Dead-reckoning is a technique that overcomes these limitations by using data from Inertial Measurement Units (IMUs)—typically comprising accelerometers, magnetometers, and gyroscopes—to reconstruct detailed, continuous movement paths between those intermittent GPS fixes [14]. This technical guide details the methodologies for implementing dead-reckoning within an Integrated Bio-logging Framework (IBF), a holistic approach for optimizing the use of bio-loggers to answer key questions in movement ecology [1]. By providing a continuous, high-resolution estimate of an animal's trajectory, dead-reckoning facilitates the identification of subtle behaviors, precise habitat use, and path tortuosity that are otherwise invisible with standard GPS tracking [13] [15].
The Principles of Dead-Reckoning in Movement Ecology
Dead-reckoning is the process of calculating a current position by using a previously determined position and advancing it based on known or estimated speeds over elapsed time and course [16] [14]. In biologging applications, this is achieved through GPS-enhanced dead-reckoning, which combines intermittent, absolute GPS locations with continuous, relative movement data from IMU sensors [13].
The core principle involves the vectorial summation of movement steps. Each new position is calculated from the previous known position using the animal's heading (direction of travel) and the distance traveled over a short time interval [17]. The fundamental dead-reckoning position update in a 2D plane can be expressed as:
[ \begin{aligned} x{k+1} &= xk + SLk \cdot \sin(\thetak) \ y{k+1} &= yk + SLk \cdot \cos(\thetak) \end{aligned} ]
Here, (xk) and (yk) represent the coordinates at step (k), (SLk) is the step length (distance traveled), and (\thetak) is the heading angle at that step [17]. In practice, this calculation runs at a very high frequency (e.g., 25 Hz), producing a seamless, high-resolution path [13].
Table 1: Comparative advantages of GPS and dead-reckoning for movement path reconstruction.
| Metric | GPS-Only Data | GPS-Enhanced Dead-Reckoning |
|---|---|---|
| Temporal Resolution | Low (minutes between fixes) | Very High (sub-second) |
| Path Tortuosity | Underestimated due to sub-sampling | Accurately captured |
| Calculated Distance | Significantly underestimated (e.g., 2.2x less) | Accurate, continuous distance |
| Spatial Range (KDE) | Overestimated (e.g., 0.46 km²) | Refined and accurate (e.g., 0.21 km²) |
| Data Collection in Challenging Environments | Poor under canopy, underground, or in water | Effective, independent of external signals |
Sensor Technologies and Data Requirements
The efficacy of dead-reckoning hinges on the synergistic use of multiple sensors. The following table details the essential components of a biologging device for dead-reckoning and their respective functions.
Table 2: Essential research reagents and sensors for dead-reckoning studies.
| Sensor / Component | Function in Dead-Reckoning | Technical Considerations |
|---|---|---|
| Tri-axial Accelerometer | Measures dynamic body acceleration (DBA) to estimate speed/stride rate; provides static acceleration for estimating body posture/pitch/roll [13] [14]. | High sampling frequency (≥25 Hz) is recommended; data is used to calculate Vectorial Dynamic Body Acceleration (VeDBA) [13]. |
| Tri-axial Magnetometer | Acts as a digital compass, measuring heading (direction) relative to Earth's magnetic field [13] [15]. | Susceptible to magnetic anomalies; requires calibration and fusion with other sensors [17]. |
| Gyroscope | Measures angular velocity, aiding in orientation and heading estimation, particularly when magnetometer data is unreliable [14]. | Helps compensate for sensor tilt and rotation [17]. |
| GPS Logger | Provides absolute, georeferenced position fixes used to correct the cumulative drift inherent in dead-reckoning [13]. | A fix rate of every 5-15 minutes is often sufficient to anchor the dead-reckoned path [13]. |
| Data Logging Unit | Stores high-frequency data from all sensors; requires sufficient memory and battery capacity [1]. | Solid-state storage with time-synchronization across all sensors is critical. |
Figure 1: Sensor data fusion workflow for dead-reckoning. Data from GPS, accelerometer (Accel), magnetometer (Mag), and gyroscope (Gyro) are fused to produce a high-resolution movement path.
Methodological Workflow: From Raw Data to Movement Paths
The transformation of raw sensor data into a reliable movement path involves a multi-stage process. The following diagram and detailed protocol outline the key steps.
Figure 2: The dead-reckoning data processing pipeline, from raw data collection to the final corrected path.
Experimental Protocol for Data Collection and Processing
Step 1: Sensor Deployment and Data Collection
- Logger Deployment: Deploy collars or tags equipped with GPS, tri-axial accelerometer, tri-axial magnetometer, and gyroscope on the study subjects. Loggers should be programmed to record continuously at high frequencies (e.g., accelerometer at 25 Hz, magnetometer at 5-10 Hz) with GPS obtaining fixes at a lower, regular interval (e.g., every 5 minutes) [13].
- Data Screening: Manually inspect accelerometer data to identify periods of active locomotion versus inactivity. The GPS location of the release point (e.g., a burrow or nest) is often used as the initial anchor point for path calculation [13].
Step 2: Data Pre-processing
- Sensor Calibration: Calibrate sensors to eliminate zero offset and scale errors. This can be done by collecting data while the device is stationary or rotated at a constant rate [17].
- Filtering and Interpolation: Apply a low-pass Finite Impulse Response (FIR) filter to raw acceleration and magnetometer data to remove high-frequency noise. Use cubic spline interpolation to handle any data gaps or to align data streams from sensors with different sampling rates [17].
Step 3: Heading Estimation
- Calculate the animal's heading using the arctangent of the magnetometer's horizontal components (X, Y), adjusted for sensor tilt. Tilt (pitch and roll) is determined from the static component of the acceleration data [13] [15].
- A two-phase filter can be applied to the magnetometer data to identify and mitigate the impact of magnetic anomalies, which can distort heading estimates [17].
Step 4: Speed and Distance Estimation
- Derive a proxy for speed from the dynamic body acceleration. The Vectorial Dynamic Body Acceleration (VeDBA) is a commonly used metric, calculated as (VeDBA = \sqrt{(AXd)^2 + (AYd)^2 + (AZd)^2}), where (AXd, AYd, AZd) are the dynamic components of acceleration on each axis [13].
- Establish a calibration curve between VeDBA and observed speed (e.g., from GPS or treadmills) to convert acceleration into actual speed. Distance traveled per time step is then speed multiplied by time [13] [14].
Step 5: Path Integration and GPS Correction
- Integrate the estimated heading and distance over time using the dead-reckoning equations to build a continuous movement path [13].
- Periodically correct the accumulated drift in the dead-reckoned path by aligning it with the available, precise GPS fixes. This can be done using a Kalman filter, which fuses the dead-reckoning estimates with GPS data to produce an optimal, corrected trajectory [17] [14].
Quantitative Insights and Validation
The value of dead-reckoning is clearly demonstrated by quantitative comparisons with GPS-only data. A case study on European badgers (Meles meles) revealed that the nightly distances travelled were 2.2 times greater when calculated using GPS-enhanced dead-reckoned data compared to GPS data alone [13]. This has profound implications for estimating energy budgets and understanding foraging strategies.
Furthermore, the interpretation of space use (home range) is significantly affected by the method used. The same badger study showed that the use of dead-reckoned data reduced Kernel Density Estimates (KDE) of animal ranges to approximately half the size (0.21 km²) estimated using GPS data (0.46 km²) [13]. This refinement allows researchers to identify core activity areas with much higher precision.
Table 3: Impact of dead-reckoning on movement metrics from a badger case study [13].
| Movement Metric | GPS-Only Data | Dead-Reckoned Data | Implication |
|---|---|---|---|
| Nightly Distance Travelled | Baseline (1x) | 2.2x Greater | Gross underestimation of energy expenditure by GPS. |
| Kernel Density Estimate (KDE) | 0.46 km² | 0.21 km² | Overestimation of core range area by GPS. |
| Path Tortuosity | Underestimated due to straight-line interpolation between fixes | Accurately captured, revealing complex search patterns | Fine-scale movement decisions and foraging strategies become visible. |
Dead-reckoning, particularly when implemented within an Integrated Bio-logging Framework, represents a powerful paradigm shift in movement ecology. By fusing data from multiple sensors, it allows researchers to reconstruct the high-resolution, three-dimensional movement paths of animals at a scale that was previously unattainable with GPS alone. This technical guide has outlined the core principles, necessary sensor technologies, and detailed methodological workflow required to successfully apply this technique. As bio-logging technology continues to advance, the integration of dead-reckoning with other data streams, such as animal-borne video or environmental sensors, will further deepen our mechanistic understanding of animal behavior, resource selection, and the ecological processes that shape movement in a changing world.
The accelerating biodiversity crisis, driven by urbanization, habitat fragmentation, and climate change, demands innovative approaches to assess the impact of conservation interventions [18]. Biologging, the use of animal-mounted sensors, has emerged as a paradigm-shifting technology that provides direct, real-time measurements from the source of biodiversity—the animals themselves [18]. This in-depth technical guide explores how biologging serves as a critical tool for conservation by enabling precise measurement of individual fitness, survival, and reproduction in wild populations. Framed within the integrated biologging framework for movement ecology research, we detail how multi-sensor approaches yield mechanistic insights into the environments of selection and provide a reporting, measurement, and verification system for conservation success [18] [1]. By moving beyond historical distribution metrics to capture fine-scale behavioral and physiological data, biologging bridges the critical gap between individual animal decisions and population-level conservation outcomes.
The Integrated Bio-logging Framework (IBF) for Conservation
The Integrated Bio-logging Framework (IBF) provides a structured approach for designing conservation-focused biologging studies, connecting biological questions with appropriate sensor technologies, data management strategies, and analytical techniques through a cycle of feedback loops [1]. This framework is particularly vital for multi-disciplinary collaboration, essential for tackling the complexities of modern conservation biology.
The following diagram illustrates the core decision-making pathway within the IBF for a question-driven conservation study:
- From Questions to Sensors: The framework begins with a precise conservation-driven biological question, which directly informs the selection of appropriate sensors [1]. For instance, investigating mortality causes may require accelerometers and temperature loggers, while studying reproductive success may need GPS and audio recorders [18].
- Multi-Sensor Integration: A key strength of the IBF is its emphasis on multi-sensor approaches to create a comprehensive picture of an animal's interaction with its environment. Combining data from intrinsic sensors (e.g., accelerometers, magnetometers) with environmental sensors (e.g., temperature, salinity) and location data allows for the reconstruction of 3D movements, behavior identification, and context for physiological responses [1].
- Data to Action: The pathway culminates in analysis and interpretation that directly inform conservation actions, such as identifying mortality hotspots or successful breeding habitats. Crucially, the framework includes a feedback loop, where these outputs refine the initial biological questions and sensor strategies, enabling adaptive management [18] [1].
Measuring Key Fitness Parameters with Biologging
Biologging technology provides unparalleled ability to measure the fundamental currencies of conservation—survival, reproduction, and fitness—remotely and at the individual level.
Quantifying Survival and Mortality Causes
Survival is a fundamental parameter in conservation ecology, and biologging offers sophisticated methods for its remote assessment.
- Remote Mortality Detection: Positional tracking (GPS) is routinely used to study survival in birds, mammals, and marine species. Sudden cessation of movement or long-term stationarity often indicates a mortality event [18].
- Identifying Causes of Death: Multi-sensor tags significantly enhance mortality detection. Accelerometers can distinguish between predation events and other causes of death based on characteristic impact signatures and subsequent lack of movement. Temperature loggers can confirm death through a drop in body temperature to ambient levels, while audio recorders can capture auditory evidence of the event [18].
- Conservation Applications: Real-time mortality alerts can expose illegal activities such as hunting, poisoning, or bycatch, enabling rapid intervention by authorities [18]. Mapping mortality events spatially helps identify high-risk areas, informing the placement of protected areas or the implementation of mitigation measures.
Detecting and Monitoring Reproduction
Monitoring reproductive success is critical for evaluating the health of populations and the effectiveness of conservation strategies for endangered species.
- Identifying Breeding Status: Recursive movement patterns obtained from GPS tracking are highly effective for identifying central-place foraging behavior associated with nesting or denning. Individuals making repeated trips to a specific location often indicates attendance at a nest or roost site [18].
- Confirming Reproductive Outcomes: Beyond identifying breeding attempts, biologging can confirm successful outcomes. For example, changes in dive profiles of marine predators or foraging patterns of birds can indicate provisioning for offspring [18]. In some species, temperature loggers can detect the cooling and rewarming of eggs during incubation bouts, providing direct evidence of breeding behavior [18].
- Challenges and Validation: A key challenge is that reproductive behaviors are species-specific. Detecting these events requires suitable natural history knowledge or ground-truthing data (e.g., from direct observations or camera traps) to validate the biologging methods for each species [18].
Linking Behavior to Individual Fitness and Energetics
Biologging enables the connection between fine-scale behavior, energy expenditure, and ultimately, individual fitness—a powerful predictor of population viability.
- Energy Expenditure as a Proxy: Dynamic Body Acceleration (DBA), derived from accelerometers, has been validated as a strong proxy for energy expenditure in a wide range of species [1]. By measuring DBA across different environments and behaviors, researchers can map the energetic costs of an animal's lifestyle and identify habitats that are energetically profitable versus costly.
- Case Study: White Storks: A long-term biologging study of white storks (Ciconia ciconia) exemplifies this approach. Accelerometry data revealed the energetic benefits of foraging in human-modified habitats like landfills. However, this high-energy gain strategy came with associated health risks, creating a trade-off that ultimately influences individual fitness [18].
- From Individuals to Populations: These estimates of individual energy budgets and their links to habitat use can be integrated into population viability models, which are key to understanding population dynamics and predicting trends in response to conservation interventions [18].
Table 1: Biologging Sensors and Their Applications in Measuring Fitness Parameters
| Fitness Parameter | Primary Sensor Types | Measurable Metrics | Conservation Application |
|---|---|---|---|
| Survival & Mortality | GPS, Accelerometer, Temperature Logger, Audio Recorder | Movement cessation, body temperature drop, impact signatures, audio cues | Identify mortality hotspots and causes (e.g., poaching, bycatch); inform anti-poaching patrols and policy. |
| Reproduction | GPS, Accelerometer, Temperature Logger | Central-place foraging patterns, recursive movements, incubation temperature profiles | Locate and monitor nesting/denning sites; measure breeding success; target habitat protection. |
| Energetics & Fitness | Accelerometer, GPS, Heart Rate Logger | Dynamic Body Acceleration (DBA), foraging effort, travel distance, heart rate | Model individual energy budgets; assess habitat quality and connectivity; parameterize population models. |
Experimental Protocols and Data Standards
A Methodological Workflow for Fitness Estimation
The following protocol outlines a generalized workflow for using biologging to estimate fitness components in a wild population, adaptable to specific taxonomic groups.
- Sensor Deployment and Selection: Deploy integrated multi-sensor tags (e.g., GPS, tri-axial accelerometer, temperature sensor) on study animals. The selection should be guided by the IBF, with tag weight typically not exceeding 5% of the animal's body mass to minimize impact [1].
- Data Collection and Transmission: Collect high-frequency data throughout the biological period of interest (e.g., breeding season, annual cycle). Data can be either stored on-board for later retrieval or transmitted remotely via satellite or GSM networks [18] [1].
- Mortality Event Detection: Implement automated algorithms to flag potential mortality events. These algorithms scan GPS data for long-term stationarity and accelerometer data for a permanent lack of variance. flagged events require secondary verification from other sensors, such as a temperature log showing a drop to ambient levels [18].
- Reproduction Event Detection: Apply nest/den site detection algorithms to GPS data to identify clusters of locations indicating central-place foraging. Validate these behaviorally using accelerometer data patterns characteristic of nest building, incubation, or chick provisioning. Where possible, ground-truth a subset of sites [18].
- Energetics Analysis: Calculate Vectorial Dynamic Body Acceleration (VeDBA) or Overall Dynamic Body Acceleration (ODBA) from the raw tri-axial accelerometer data. Calibrate these metrics with species-specific energy expenditure equations (e.g., from respirometry trials) to convert DBA into energy consumption rates [1].
- Spatio-Temporal Integration: Use a GIS platform to map the derived fitness parameters (survival, reproductive sites, energy expenditure) onto environmental layers, such as habitat type, human modification, and climate data. This creates a "fitness landscape" that reveals how the environment shapes selection pressures [18].
Data Standards and Sharing Platforms
The large, complex datasets generated by biologging require standardized formats and dedicated platforms for sharing and analysis to maximize their conservation impact.
- The Need for Standardization: Inconsistent data formats (e.g., column names, date-time formats) have historically hampered collaborative research and the secondary use of biologging data in fields like oceanography and meteorology [5].
- Biologging intelligent Platform (BiP): Platforms like the Biologging intelligent Platform (BiP) have been developed to store standardized sensor data along with rich metadata [5]. BiP adheres to international standards (e.g., ITIS, CF Conventions) for metadata, ensuring interoperability.
- Metadata Requirements: Critical metadata includes information about animal traits (species, sex, body size), instrument details (sensor types, accuracy), and deployment information (who, when, where) [5]. This contextual information transforms raw sensor data into a biologically meaningful resource for cross-disciplinary conservation science.
Table 2: The Scientist's Toolkit: Essential Research Reagents and Materials
| Tool Category | Specific Examples | Technical Function in Biologging Research |
|---|---|---|
| Core Sensor Technologies | GPS Logger, Tri-axial Accelerometer, Magnetometer, Gyroscope, Depth/Pressure Sensor | Records position, movement dynamics, body posture, heading, and altitude/depth for 3D path reconstruction (dead-reckoning) and behavior identification [1]. |
| Environmental Sensors | Temperature Logger, Salinity Sensor, Microphone, Video Camera, Light Sensor | Measures in-situ environmental conditions (e.g., ocean temperature, salinity) and records visual/auditory context of the animal's surroundings [18] [1]. |
| Data Handling & Transmission | Satellite Relay Data Logger (SRDL), GSM Transmitter, UHF Download, On-board Memory | Enables remote data transmission via satellite/cellular networks or local retrieval; SRDLs use compression for efficient long-term data delivery [5]. |
| Data Analysis Tools | Machine Learning Classifiers, Hidden Markov Models (HMMs), Dead-Reckoning Algorithms, Online Analytical Processing (OLAP) | Analyzes complex multivariate data to classify behaviors, identify hidden states, reconstruct fine-scale movements, and estimate environmental parameters [5] [1]. |
| Data Sharing Platforms | Movebank, Biologging intelligent Platform (BiP), AniBOS | Provides cloud-based infrastructure for storing, standardizing, visualizing, and sharing biologging data under open or controlled access protocols [5]. |
The field of biologging is rapidly advancing, with future progress hinging on technological innovation, analytical development, and equitable global access.
- Technological and Analytical Frontiers: Future biologgers will leverage "software-defined tracking," where onboard algorithms can intelligently adapt data collection based on the animal's behavior or environmental context, optimizing power and data storage [18]. Advances in battery technology and energy harvesting will extend study durations. The major challenge remains in the theoretical and mathematical foundations of movement ecology, which must advance to properly analyze the rich, high-frequency multivariate data streams [1].
- Addressing Biases and Equitable Access: Current biologging studies show substantial bias, being over-represented in sparsely populated areas and under-represented in highly urbanized landscapes and key biodiversity areas in the Global South [18]. Leveraging the full potential of biologging for global conservation requires addressing these biases and promoting equitable access to technology, funding, and training [18].
- Conclusion: Biologging has transformed our ability to measure the core processes of survival, reproduction, and fitness in wild populations. When deployed within an Integrated Bio-logging Framework, it provides a powerful, direct feedback mechanism for evaluating conservation actions. By operationalizing the measurement of gene flow and demographic processes, particularly in difficult-to-access areas, biologging is poised to become an indispensable component of a data-driven, adaptive approach to halting biodiversity loss in the Anthropocene [18].
The white stork (Ciconia ciconia) has emerged as a critical model species for movement ecology, particularly for investigating the interplay between energy expenditure, anthropogenic landscape change, and population dynamics. The application of an Integrated Bio-logging Framework (IBF) provides a paradigm-changing approach to unravel these complex relationships [1]. This framework strategically links biological questions with appropriate sensors, data management, and analytical techniques, enabling researchers to move beyond simple tracking to a mechanistic understanding of animal movement [1]. For white storks, this approach has proven invaluable in quantifying how artificial food sources like landfills alter energetic costs, movement patterns, and ultimately survival rates—critical knowledge for conservation in rapidly changing environments. This case study details the methodologies, key findings, and practical research protocols for implementing such an integrated approach.
The Integrated Bio-logging Framework (IBF) in Practice
The IBF creates a structured cycle for biologging studies, connecting biological questions, sensor selection, data management, and analysis through iterative feedback loops [1]. Its implementation requires multi-disciplinary collaboration between ecologists, engineers, and statisticians from the study's inception [1].
The diagram below illustrates the operational workflow of the IBF as applied to white stork research.
Framing Biological Questions within the IBF
Research on white storks exemplifies the question-driven pathway through the IBF [1]. Key questions include:
- Where is the animal going? → Addressed via GPS tracking to quantify migration routes, stopover sites, and habitat use [19].
- What is the animal's energy expenditure? → Addressed via accelerometry calibrated against energy expenditure [20] [21].
- How does behavior influence survival? → Addressed by linking movement and energetic data to mortality causes [22] [23].
Sensor Selection and Multi-sensor Approaches
Matching sensors to biological questions is a core IBF principle [1]. The following table summarizes key sensor types and their applications in white stork research.
Table 1: Bio-logging Sensors for White Stork Research
| Sensor Type | Measured Parameters | Application in White Stork Studies | Key References |
|---|---|---|---|
| GPS/GNSS | Latitude, Longitude, Altitude | Mapping migration routes, habitat use, and connectivity between landfills and wetlands. | [1] [19] |
| Accelerometer | Dynamic Body Acceleration (DBA), posture, behavior | Classifying behaviors (flying, foraging); estimating energy expenditure via DBA. | [1] [20] [21] |
| Magnetometer | Heading, direction | Determining animal orientation for dead-reckoning and 3D path reconstruction. | [1] |
| Heart Rate Logger | Heart rate | High-resolution proxy for metabolic rate and energy expenditure. | [1] |
| Microphone/Camera | Vocalizations, visuals | Documenting foraging context, social interactions, and diet. | [1] |
A multi-sensor approach is a new frontier in biologging, providing a more holistic picture of an animal's life [1]. For example, combining GPS and accelerometer data allows researchers to not only locate a stork at a landfill but also quantify the energetic cost of foraging there and classify specific behaviors [19].
Quantifying Energy Expenditure
Accelerometry and Dynamic Body Acceleration
Dynamic Body Acceleration (DBA) is a well-validated proxy for energy expenditure [20] [21]. The principle is that the dynamic component of acceleration, derived by removing the static gravity vector, is proportional to mechanical work, which in turn correlates with metabolic rate [20]. Validations on multiple bird species, including thick-billed murres and Adélie penguins, have confirmed strong correlations between DBA and energy expenditure measured via doubly labelled water (DLW) [20] [21].
Table 2: Validation of Accelerometry for Estimating Energy Expenditure in Birds
| Species | Locomotory Modes | Validation Method | Correlation (R²) | Key Finding | |
|---|---|---|---|---|---|
| Thick-billed Murre | Flying, Swimming, Land | Doubly Labelled Water | 0.73 | Different calibration coefficients needed for flight vs. other modes. | [20] |
| Adélie Penguin | Diving, Porpoising, Land | Doubly Labelled Water | 0.72 | Different coefficients needed for land-based vs. water-based activities. | [21] |
Experimental Protocol: Calibrating DBA with Doubly Labelled Water
This protocol outlines the key steps for validating accelerometer-derived DBA against the DLW method in free-living birds [20] [21].
- Animal Capture and Instrumentation: Capture birds (e.g., at the nest). Weigh and record morphometric data.
- DLW Administration: Inject a measured dose of DLW (typically containing stable isotopes ^18^O and ²H) intraperitoneally or intramuscularly. Take an initial blood sample after a brief equilibrium period (e.g., 60 minutes) to establish initial isotope levels.
- Accelerometer Deployment: Securely attach a tri-axial accelerometer to the bird's body (e.g., via a leg-loop or harness) to record data at a high frequency (e.g., 16-40 Hz). Ensure the device is programmed to record for the entire DLW measurement period.
- Field Release and Monitoring: Release the bird back into the wild for a precisely known period (typically 24-48 hours).
- Recapture and Final Sampling: Recapture the bird and take a final blood sample. Remove the accelerometer.
- Laboratory Isotope Analysis: Analyze blood samples for ^18^O and ²H enrichment using isotope ratio mass spectrometry. Calculate CO~2~ production and total energy expenditure over the measurement period using established equations [20].
- Accelerometer Data Processing:
- Download accelerometer data and calculate DBA (e.g., Vectoral DBA or Overall DBA).
- Use machine learning or manual scoring to classify behavior into distinct modes (e.g., flight, swimming, resting) based on acceleration signatures.
- Calculate the average DBA for each behavior and for the total deployment.
- Statistical Calibration: Use general linear models and model selection criteria (e.g., Akaike's Information Criterion, AIC) to find the most parsimonious relationship between DLW-derived energy expenditure and DBA, testing whether separate calibration coefficients are needed for different behaviors [20] [21].
The workflow for this integrated methodology is summarized below.
Mortality Tracking and Causes of Death
Understanding mortality is crucial for contextualizing energy expenditure studies. Long-term field studies and ringing recovery data provide robust insights into white stork mortality, particularly for juveniles.
Table 3: Documented Causes of Mortality in Juvenile White Storks (Poland)
| Cause of Death Category | Specific Cause | Frequency in Western Poland (%) | Frequency in Entire Poland (%) |
|---|---|---|---|
| Anthropogenic - Power Infrastructure | Collision with power lines, Electrocution | 60% | 78% |
| Other Anthropogenic Causes | Vehicle collision, poisoning, etc. | 25% | 13% |
| Natural Causes | Predation, disease, starvation | 15% | 9% |
Key Findings:
- Early post-fledging mortality averaged 4.3% of all fledglings per year in a Western Poland study [22].
- A significant proportion of mortality events (73%) occurred very close to the natal nest (<100 m), highlighting the high risk faced by newly fledged birds in the immediate vicinity of their birthplace [22].
- The type of nesting structure (e.g., electrical pylon vs. tree) significantly influences both the probability of nest reoccupation and breeding success, which can have downstream effects on population dynamics [23].
Synthesis: Landfills as a Key Ecological Driver
Bio-logging studies have revealed that landfills are a central node in the spatial and energetic ecology of white storks, with complex consequences.
- Spatial Connectivity: Network analysis of GPS data shows that landfills are the habitat type most connected to others via direct stork flights [19]. They act as significant sources of movements, with wetlands like rice fields and marshes acting as significant sinks, creating a robust ecological network [19].
- Energetic and Behavioral Impacts: Landfills provide a stable, abundant food source, reducing foraging energy costs and time [19]. This reliable subsidy has led to behavioral shifts, including shortened migration distances and increased sedentary populations [23].
- Demographic and Conservation Consequences: Proximity to landfills is becoming an increasingly important factor in nest-site selection in Central-Eastern Europe [23]. While this resource may boost local breeding populations by improving body condition, it also concentrates storks in areas where they face primary mortality threats (power lines) and raises concerns about biovectoring of pollutants, plastics, pathogens, and antibiotic-resistant bacteria from landfills to natural ecosystems [19].
The Scientist's Toolkit: Research Reagent Solutions
Table 4: Essential Materials and Technologies for White Stork Bio-logging Research
| Tool Category | Specific Product/Technique | Function & Application | Key Considerations | |
|---|---|---|---|---|
| Positioning Loggers | GPS/GNSS tags (e.g., Ornitela, Movetech) | Pinpointing animal location, mapping home range, migration routes. | Priority: Fix success rate, battery life, data retrieval method (GSM/UHF/satellite). | [19] |
| Movement/Energy Sensors | Tri-axial accelerometers (e.g., Technosmart, Little Leonardo) | Measuring DBA for energy estimation and fine-scale behavior classification. | Priority: Sampling rate, memory capacity, weight. Requires calibration. | [1] [20] |
| Biochemical Kits | Doubly Labelled Water (^18^O, ²H) | Gold-standard field method for validating energy expenditure over 1-3 days. | Priority: Isotope cost, laboratory access for mass spectrometry. | [20] [21] |
| Data Storage & Sharing | Movebank, Biologging intelligent Platform (BiP) | Storing, standardizing, visualizing, and sharing biologging data and metadata. | Priority: FAIR principles (Findable, Accessible, Interoperable, Reusable). | [5] [19] |
| Analytical Software | R packages (e.g., move, acc, momentuHMM) |
Statistical analysis, movement path reconstruction, behavioral state classification using HMMs. | Priority: Open-source, strong user community, handles big data. | [1] |
This case study demonstrates the power of an Integrated Bio-logging Framework to unravel the complex ecology of white storks. By linking sophisticated sensor data with rigorous physiological validation and mortality tracking, researchers can quantify the nuanced trade-offs storks face in human-altered landscapes. The reliance on landfills, while potentially energetically beneficial, creates a paradox by tethering populations to a resource linked to anthropogenic mortality and ecosystem contamination. Future research, facilitated by platforms like BiP [5] and continued technological advances, must focus on filling data gaps—particularly in the Global South [24]—and integrating real-time data into conservation planning to ensure the long-term viability of white stork populations.
The study of movement ecology has been revolutionized by biologging, which enables researchers to observe the unobservable by recording the fine-scale behaviors, physiology, and environmental contexts of free-ranging animals [1]. This case study on white sharks (Carcharodon carcharias) exemplifies an Integrated Bio-logging Framework (IBF), where biological questions guide sensor selection, and advanced analytical techniques transform complex data streams into ecological insights [1]. For elusive marine predators, understanding both natural behavior and responses to human intervention is paramount for effective conservation and management [25]. This guide details the methodologies and technologies that have provided new insights into white shark post-capture recovery and revealed compelling evidence for cryptic behaviors, including potential sleep.
Experimental Protocols and Methodologies
Study System and Animal Capture
Research was conducted within the context of a non-lethal shark bite mitigation program using Shark-Management-Alert-in-Real-Time (SMART) drumlines in New South Wales, Australia [25] [26]. This system alerts responders via satellite communication when an animal takes the bait, facilitating a rapid response typically within 30 minutes to minimize capture stress [26]. Between May and October 2016, thirty-six white sharks were captured using this method [26]. Upon capture, responders secured the shark alongside a research vessel, performed morphometric measurements (e.g., total length, sex), and attached biologging tags before release approximately 1 km offshore [25] [26]. Blood physiology samples taken from these sharks indicated that the capture process was relatively benign, with response times appropriate for minimizing long-term negative impacts [26].
Multi-Sensor Biologging Tag Deployment
The core of the fine-scale behavioral investigation relied on deploying "daily diary" biologging tags on eight white sharks [25]. These tags represent the optimal standard for recording integrated movement, behavior, and environmental context. Tags were configured to record data for periods ranging from 10 to 87 hours post-release [25].
The integrated sensor suite included:
- Video: To document environmental context, interactions with other organisms, and direct visual evidence of behavior.
- Tri-axial Accelerometer: To measure dynamic body acceleration (DBA), which serves as a proxy for activity and energy expenditure, and to identify specific body movements such as tailbeats.
- Tri-axial Gyroscope: To measure body rotation and orientation.
- Tri-axial Magnetometer: To derive compass heading, which is crucial for dead-reckoning track reconstruction.
- Depth Sensor: To record vertical movements and dive profiles [25].
Track Reconstruction via Dead-Reckoning
To reconstruct the precise, fine-scale movements of the sharks, researchers employed a dead-reckoning procedure. This technique integrates:
- Speed: Derived from Dynamic Body Acceleration (DBA) or, in other studies, from a speed paddle or Pitot tube [1].
- Heading: Obtained from the magnetometer data, after correcting for the animal's orientation [25] [1].
- Change in Depth: Recorded by the pressure sensor [1].
By sequentially calculating movement vectors from these parameters, a continuous, three-dimensional path of the shark's movements was reconstructed, providing unprecedented detail on their post-release behavior [25] [1].
Behavioral State Modeling with Hidden Markov Models (HMMs)
Hidden Markov Models (HMMs) were used to objectively identify distinct behavioral modes from the complex, multi-dimensional biologging data [25]. HMMs are particularly suited for this task as they relate time-series of observations (e.g., acceleration, heading, depth) to a most likely sequence of underlying, "hidden" behavioral states [25]. The modeling process involved:
- Data Preparation: The high-frequency data from all sensors were synchronized and integrated into a multivariate time series.
- Model Training: The HMM algorithm was applied to this dataset to identify a predefined number of discrete behavioral states, characterized by unique combinations of sensor readings.
- State Classification: The model output provided a time-stamped sequence of the most probable behavioral state for the shark, enabling researchers to quantify the duration and timing of different behaviors, such as "disturbed" swimming versus "resting" or "circling" [25].
Long-Term Fate Monitoring via Acoustic and Satellite Telemetry
To assess longer-term survival and broad-scale movements post-release, sharks were also tagged with:
- Acoustic Tags: Transmitters that emit unique coded signals detected by underwater receiver arrays. The 36 white sharks in the SMART drumline study were detected for an average of 591 days post-release (range: 45–1075 days) [26].
- Dorsal Fin-Mounted Satellite-Linked Radio Transmitters (SLRTs): These tags communicate with satellites when the shark's fin breaks the surface, providing geo-location data over months to years. In the same study, even sharks not detected by acoustic arrays showed SLRT detections for 43 to 639 days, confirming survival [26].
Key Findings and Data Synthesis
Quantitative Analysis of Post-Capture Recovery
Table 1: Summary of Post-Capture Recovery Metrics in White Sharks
| Parameter | Findings | Method of Analysis |
|---|---|---|
| Immediate Post-Release Movement | Rapid offshore movement, remaining >3.5 km from coast for first 3 days. | Satellite telemetry (SLRT) locations [26]. |
| Short-Term Displacement | 77% of sharks remained >1.9 km from coast 10 days post-release; average of 5 km from capture site. | Acoustic and satellite telemetry data analysis [26]. |
| Activity-Based Recovery Period | Average of 9.7 hours based on tailbeat analysis. | Accelerometer-derived tailbeat metrics [25]. |
| Size-Dependent Recovery | Evidence of smaller individuals having longer recovery periods. | Correlation of tailbeat recovery duration with shark size [25]. |
| Long-Term Survival Rate | 100% (36/36 sharks) survived capture and release. | Combined acoustic and satellite tag detections over 43-1075 days [26]. |
Identification of Cryptic Circling Behavior
Beyond the initial recovery period, the integrated analysis of multisensor data revealed a cryptic behavioral shift. The magnetometer data and dead-reckoned tracks showed that sharks transitioned to prolonged periods of diurnal clockwise-counterclockwise circling [25]. This behavior was characterized by regular, repetitive turns and was most prominent during the day. The researchers hypothesize that this stereotypic circling may represent a form of rest or even unihemispheric sleep, a state where one brain hemisphere sleeps while the other remains active, a phenomenon previously documented in some marine mammals and birds [25]. This finding provides compelling, albeit indirect, evidence for sleep-like states in a continuously swimming elasmobranch.
Visualization of Experimental Workflow and Behavioral Modeling
Integrated Biologging Analysis Workflow
The following diagram illustrates the comprehensive workflow from animal capture to behavioral insight, integrating the protocols described above.
Behavioral State Modeling with Hidden Markov Models
This diagram outlines the logical structure of the Hidden Markov Model (HMM) used to identify cryptic behavioral states from raw sensor data.
The Scientist's Toolkit: Essential Research Reagents and Materials
Table 2: Key Research Reagents and Materials for Biologging Studies on White Sharks
| Item | Category | Function / Application |
|---|---|---|
| SMART Drumline | Capture & Alert System | Non-lethal fishing gear with GPS-enabled buoy that sends real-time alerts upon capture, enabling rapid response [26]. |
| "Daily Diary" Tag | Multi-sensor Biologger | Records integrated data from accelerometer, gyroscope, magnetometer, depth sensor, and video camera [25]. |
| Acoustic Tag | Telemetry Transmitter | Emits unique acoustic signal detected by underwater receivers for long-term presence/absence monitoring and coarse-scale movement tracking [26]. |
| Satellite-Linked Radio Transmitter (SLRT) | Telemetry Transmitter | Transmits location data to satellites when the shark's fin breaks the surface, providing broad-scale movement data over oceanic ranges [26]. |
| Hidden Markov Models (HMMs) | Analytical Software/Algorithm | A statistical framework for identifying latent ("hidden") behavioral states from time-series sensor data [25]. |
| Dead-Reckoning Software | Analytical Software/Algorithm | Computes fine-scale, 3D animal movements from speed, heading, and depth data [25] [1]. |
| Anesthesia (e.g., MS-222) | Physiological Reagent | Used in surgical procedures for more invasive tag attachments (e.g., EEG studies) to induce a surgical plane of anesthesia [27]. |
This case study demonstrates the power of an Integrated Bio-logging Framework to address complex ecological questions. By moving beyond single-sensor telemetry and embracing a multi-sensor approach combined with advanced statistical modeling like HMMs, researchers can decode the cryptic behaviors of marine megafauna. The application of this framework to white sharks captured on SMART drumlines has not only validated the tool's effectiveness for non-lethal mitigation—by showing initial offshore movement and 100% survival—but has also yielded fundamental biological insights, such as the potential for sleep-like states in continuously swimming sharks [25] [26]. This methodology provides a robust template for future studies aiming to link animal physiology, behavior, and movement across applied and pure ecological contexts.
Navigating the Challenges: Data, Technology, and Collaboration Hurdles
The field of movement ecology is undergoing a revolution driven by bio-logging technology, which generates massive, high-frequency, multivariate datasets on animal behavior, physiology, and environmental interactions [1]. This biologging revolution presents a fundamental "big data" problem characterized by immense volume, velocity, and variety [1]. Traditional analytical approaches are often inadequate for these complex datasets, which may contain thousands of data points for each measured variable from individual animals [28]. The paradigm-changing opportunities of bio-logging sensors are vast, but researchers face significant challenges in data exploration, visualization, and analysis [1]. This technical guide addresses these challenges within the context of an Integrated Bio-logging Framework (IBF), providing movement ecology researchers with methodologies for efficient data exploration and multi-dimensional visualization to extract meaningful ecological insights from complex biologging data.
Data Exploration Strategies for Large Biologging Datasets
Initial Data Assessment and Cleaning
Before visualization, biologging data requires careful preparation. This initial phase involves checking for data entry issues, identifying outliers, and understanding distributional characteristics of variables [29]. For time-series biologging data, particular attention must be paid to temporal autocorrelation, where successive values depend on prior sampling events [28]. This autocorrelation violates the independence assumption of standard statistical tests and requires specialized handling throughout the analysis pipeline.
Effective data exploration involves generating summary statistics and distribution plots for all variables to identify potential data quality issues. For sensor data, this may include identifying unrealistic values resulting from sensor malfunction or transmission errors. The use of automated scripts for this initial assessment ensures consistency and reproducibility when working with large datasets.
Data Reduction Techniques
Table 1: Data Reduction Techniques for Biologging Data
| Technique | Description | Use Case | Considerations |
|---|---|---|---|
| Data Sampling | Selecting a representative subset of data | Initial exploration of massive datasets | Must preserve underlying patterns and distributions |
| Data Aggregation | Summarizing data using statistics (mean, max) | Identifying higher-level patterns | Loss of fine-scale behavioral information |
| Dimensionality Reduction | Projecting high-dimensional data to lower dimensions | Visualizing multi-sensor relationships | Interpretation of derived dimensions needed |
| Behavioral Classification | Grouping raw data into behavioral states | Reducing time-series to state sequences | Requires validation of classification accuracy |
Given the size of biologging datasets, direct visualization of all data points is often impractical. Data reduction techniques are essential for effective exploration [30]. Data sampling involves selecting a representative subset of the data, reducing computational and visual complexity while preserving essential patterns [30]. For example, instead of visualizing every GPS fix, researchers might sample regular intervals or use algorithms that preserve trajectory characteristics while reducing point density.
Data aggregation summarizes information using categorical or group variables such as individual identity, species, or time periods [29]. In a retail analogy applied to ecology, instead of visualizing individual animal movements, researchers might aggregate data by regions or habitat categories to identify broader spatial patterns [30]. This approach enables researchers to identify regional movement trends, preferred habitats, and seasonal patterns.
Multi-Dimensional Visualization Techniques
Foundational Visualization Approaches
Effective visualization is crucial for exploring big data, interpreting variables, and communicating results [29]. The development of an effective data visualization typically follows a structured process: (1) determining the visualization goal (e.g., exploring data, relationships, model outcomes), (2) preparing the data (cleaning, organizing, transforming), (3) identifying the ideal visualization tool, (4) producing the visualization, and (5) interpreting and presenting the information [29].
Marginal plots represent a powerful foundational approach, combining a scatter plot with histograms or boxplots in the margins of the x- and y-axes [29]. These plots enable researchers to examine both the relationship between two variables and their individual distributions simultaneously. For example, a researcher might plot animal speed against body temperature while visualizing the distribution of each variable in the margins.
In R, the ggplot2 package provides a versatile grammar of graphics for building diverse visualizations [29]. A typical ggplot2 template builds plots layer by layer using the + operator, allowing for complex visualizations through simple syntax:
Advanced Multi-Dimensional Visualization
Hierarchical visualization techniques like tree maps and sunburst charts represent large, complex data sets in a structured manner that allows users to drill down into different levels of detail [30]. For example, in movement ecology, hierarchical visualization could display animal movements by region, habitat type, and individual, enabling researchers to explore patterns across spatial and organizational scales.
Parallel coordinate plots effectively visualize multidimensional data by representing each data point as a line passing through parallel axes, where each axis represents a different variable [30]. For biologging data, axes might represent time, location, depth, acceleration, and environmental variables. By observing the interactions between lines, researchers can identify correlations, clusters, and outliers across multiple dimensions simultaneously. This technique is particularly valuable for understanding the complex relationships between animal behavior, physiology, and environmental conditions.
Interactive visualization enables dynamic exploration of large data sets through zooming, filtering, and selection techniques [30]. By incorporating interactive elements such as sliders, filters, and brushing techniques, researchers can focus on specific data subsets, enabling deeper analysis and discovery of hidden insights [30]. For example, interactive visualizations could allow researchers to filter animal tracking data by date ranges, specific individuals, or behavioral states to evaluate movement patterns under different conditions.
Experimental Protocols for Biologging Data Analysis
Protocol 1: Behavioral Classification from Multi-Sensor Data
Objective: To classify animal behavior from high-frequency multi-sensor data using machine learning approaches.
Materials: Tri-axial accelerometer, magnetometer, and gyroscope data; GPS location data; computational resources for machine learning.
Methodology:
- Data Collection: Collect high-frequency (typically 10-100 Hz) data from inertial measurement units (IMUs) including accelerometers, magnetometers, and gyroscopes deployed on study animals [1].
- Data Preprocessing: Calibrate sensors, filter noise, and segment data into fixed-length windows (e.g., 3-5 seconds) for analysis.
- Feature Extraction: Calculate summary statistics (mean, variance, covariance) for each axis and combinations of axes within each window.
- Ground Truth labeling: Establish behavioral labels through direct observation, video recording, or characteristic patterns in the data.
- Model Training: Train supervised machine learning classifiers (e.g., random forest, support vector machines) using extracted features and behavioral labels.
- Validation: Validate model performance using cross-validation and independent test datasets.
- Application: Apply trained models to unlabeled datasets to classify behavior across entire tracking periods.
This protocol enables researchers to translate raw sensor data into ecologically meaningful behavioral states, facilitating analysis of behavioral budgets, activity patterns, and energy expenditure.
Protocol 2: Movement Path Reconstruction via Dead-Reckoning
Objective: To reconstruct fine-scale 3D movement paths when GPS locations are unavailable or insufficiently detailed.
Materials: Tri-axial accelerometer, magnetometer, depth sensor/pressure transducer; initial position fix.
Methodology:
- Sensor Integration: Deploy integrated sensors including accelerometers (for speed estimation), magnetometers (for heading), and depth sensors (for vertical position) [1].
- Speed Estimation: Calculate dynamic body acceleration (DBA) from accelerometer data and calibrate against known speeds to establish a speed-DBA relationship [1].
- Heading Determination: Use magnetometer data to determine animal orientation, compensating for local magnetic declination.
- Path Reconstruction: Apply dead-reckoning algorithms that use speed, heading, and time between measurements to calculate successive movement vectors:
Positionₜ₊₁ = Positionₜ + (Speedₜ × Δt × Headingₜ) - Path Correction: Incorporate periodic absolute position fixes (e.g., from GPS or acoustic telemetry) to correct for cumulative errors in dead-reckoning.
- Visualization: Plot reconstructed paths in 2D or 3D space, incorporating environmental layers for context.
This protocol enables reconstruction of fine-scale movement paths even in environments where GPS signals are unavailable, such as underwater, underground, or in dense canopy cover.
The Researcher's Toolkit: Essential Solutions for Biologging Data
Table 2: Essential Research Reagent Solutions for Biologging Data Analysis
| Tool/Solution | Function | Application Example |
|---|---|---|
| R Statistical Environment | Data manipulation, analysis, and visualization | Comprehensive data exploration and statistical modeling |
| ggplot2 Package | Grammar of graphics for visualization | Creating publication-quality plots of animal movements |
| Movebank Database | Repository for animal tracking data | Archiving, sharing, and accessing biologging data [5] |
| Biologging intelligent Platform (BiP) | Standardized platform for sharing biologging data | Storing sensor data with metadata for cross-disciplinary research [5] |
| Online Analytical Processing (OLAP) Tools | Calculate environmental parameters from animal data | Deriving surface currents, ocean winds, and waves from animal movements [5] |
| Parallel Coordinate Plot Tools | Visualizing multidimensional relationships | Identifying correlations between multiple environmental and behavioral variables |
| Interactive Visualization Libraries (plotly) | Creating web-based, interactive visualizations | Exploring large datasets through dynamic filtering and zooming [29] |
| Machine Learning Libraries (caret, tensorflow) | Classifying behaviors from sensor data | Automating behavioral annotation from acceleration data |
Integrated Framework for Biologging Data Analysis
The analysis of biologging data benefits from a structured framework that connects biological questions with appropriate sensors, analytical techniques, and visualization approaches [1]. The Integrated Bio-logging Framework (IBF) emphasizes the importance of multi-disciplinary collaborations between ecologists, statisticians, computer scientists, and engineers to fully leverage the potential of biologging data [1].
Figure 1: Integrated Bio-logging Framework for Movement Ecology
The framework illustrates the iterative nature of biologging research, where ecological interpretations generate new biological questions, driving further investigation. Within this framework, efficient data exploration and multi-dimensional visualization serve as critical bridges between raw data collection and robust statistical analysis, enabling researchers to formulate appropriate hypotheses and select suitable analytical approaches.
Analytical Workflow for Time-Series Biologging Data
Biologging data typically exhibits strong temporal autocorrelation, where successive measurements are dependent on previous values [28]. This autocorrelation presents analytical challenges that require specialized approaches beyond standard statistical tests.
Figure 2: Analytical Workflow for Time-Series Biologging Data
When analyzing physiological or movement time-series data, researchers should avoid simple statistical tests like t-tests or ordinary generalized linear models, as these greatly inflate Type I error rates when applied to autocorrelated data [28]. Instead, appropriate modeling frameworks include:
- Autoregressive (AR) models: Assume that previous values in the time series are required to understand current values [28].
- Autoregressive Moving Average (ARMA) models: Combine both autoregressive and moving average components for greater flexibility [28].
- Generalized Least Squares (GLS): Extends ordinary least squares to account for correlated errors [28].
- Hidden Markov Models (HMMs): Infer hidden behavioral states from observed sensor data [1].
These approaches properly account for the temporal structure in biologging data, providing more robust parameter estimates and biological insights.
The biologging revolution presents movement ecologists with unprecedented opportunities to understand animal movement, behavior, and ecology. However, realizing this potential requires sophisticated approaches to data exploration and visualization that can handle the volume, velocity, and variety of biologging data. By adopting the strategies outlined in this guide—including data reduction techniques, multi-dimensional visualization, specialized analytical protocols, and an integrated framework for analysis—researchers can transform overwhelming datasets into meaningful ecological insights. The future of movement ecology will be increasingly data-driven, requiring continued development of efficient visualization and analytical techniques to conquer the big data challenges posed by modern bio-logging technology.
The field of movement ecology is being transformed by biologging technologies that generate massive datasets on animal movement, behavior, and physiology. These data hold unprecedented potential for addressing critical challenges in conservation, public health, and fundamental ecological research. However, this potential remains constrained by significant interoperability challenges stemming from diverse data formats, inconsistent metadata practices, and isolated data management systems. The development of standardized platforms represents a pivotal advancement toward overcoming these barriers. This technical guide examines how integrated platforms like Movebank and the Biologging intelligent Platform (BiP) are establishing the technical foundations for true data interoperability, enabling researchers to realize the full scientific value of biologging data within a collaborative framework.
The urgency for such integration is underscored by emerging applications that depend on seamless data exchange. Recent research demonstrates how biologging data can function as an early warning system for zoonotic disease outbreaks by detecting abnormal movement patterns indicative of infection [31]. This application exemplifies the "One Health" approach, recognizing the profound interconnections between human, animal, and environmental health. Implementing such systems requires robust technical infrastructure that can integrate diverse data streams in near-real-time, highlighting the critical role of interoperable platforms in addressing global challenges.
Platform Architectures: Technical Foundations for Data Interoperability
Movebank: A Comprehensive Data Management Ecosystem
Movebank operates as a centralized repository for animal tracking data, supporting the entire research lifecycle from data collection and management through analysis and long-term archiving. Its architecture is designed to accommodate diverse tracking technologies while enforcing consistent data organization through shared data models and vocabularies. A key differentiator is its formal Data Repository service, which provides curation, digital object identifiers (DOIs), and long-term preservation, ensuring data persistence and citability [32]. As of January 2024, the repository contained 325 curated datasets with 279 million locations describing movements of over 15,000 animals representing 229 species [32].
The platform's interoperability extends through its commitment to the FAIR Principles (Findable, Accessible, Interoperable, and Reusable), implemented through rigorous review processes, data licensing, and integration with global discovery tools [32]. Movebank's data can be published to biodiversity platforms like the Global Biodiversity Information Facility (GBIF) and Ocean Biodiversity Information System (OBIS) using Darwin Core standards, significantly expanding their potential for ecological synthesis and species distribution modeling [33]. This cross-platform compatibility demonstrates sophisticated data interoperability at an ecosystem scale.
Biologging intelligent Platform (BiP): Standardization for Cross-Disciplinary Applications
The Biologging intelligent Platform (BiP) adopts a complementary approach focused explicitly on standardizing sensor data and metadata to facilitate secondary use across disciplines. Whereas many existing databases primarily store location data, BiP accommodates diverse parameters including depth, speed, acceleration, body temperature, and environmental measurements [5]. Its architecture addresses critical interoperability barriers by enforcing international standard formats including the Integrated Taxonomic Information System (ITIS), Climate and Forecast Metadata Conventions (CF), and ISO standards [5].
A distinctive technical feature of BiP is its Online Analytical Processing (OLAP) tools, which calculate environmental parameters such as surface currents, ocean winds, and waves from animal-borne sensor data [5]. This functionality transforms raw animal movement data into standardized environmental measurements usable by oceanographers, meteorologists, and climate scientists. By implementing algorithms from published studies directly within the platform, BiP creates a reproducible workflow for deriving cross-disciplinary data products from primary biologging observations.
Table 1: Comparative Technical Capabilities of Movebank and BiP
| Feature | Movebank | Biologging intelligent Platform (BiP) |
|---|---|---|
| Primary Focus | Animal tracking data management and archiving | Sensor data standardization and cross-disciplinary analysis |
| Data Types | Location data and sensor records | Comprehensive sensor data including depth, speed, acceleration, environmental parameters |
| Standardization Approach | Shared data models and vocabulations | International standards (ITIS, CF, ACDD, ISO) |
| Unique Capabilities | Movebank Data Repository with DOI assignment, GBIF/OBIS integration | OLAP tools for environmental parameter calculation, direct linkage to publication DOIs |
| Interoperability Features | FAIR data principles, Darwin Core transformation | Standardized column names, date formats, and file structures |
| Scale | 7.5 billion location points across 1,478 taxa | Newer platform with specialized processing capabilities |
Metadata Standardization: The Backbone of Data Interoperability
Metadata Schemas and Implementation
Robust metadata provision forms the critical foundation for data interoperability across platforms. Both Movebank and BiP implement comprehensive metadata schemas that contextualize primary observations with essential information about animal subjects, instrumentation, and deployment circumstances. BiP's schema specifically organizes metadata into three structured categories: (1) animal traits (species, sex, body size, life history), (2) instrument specifications (device type, manufacturer, sensors), and (3) deployment details (location, method, timing) [5].
This standardized approach enables meaningful data integration across studies by ensuring that essential contextual information travels with the primary sensor data. Implementation features such as pull-down menus and automated field completion reduce entry errors and terminological inconsistencies that frequently compromise interoperability [5]. By conforming to international standards rather than platform-specific conventions, these metadata structures support seamless data exchange between systems and disciplines.
Transformational Protocols: Enabling Cross-Platform Data Integration
A critical interoperability function involves transforming high-resolution tracking data into formats suitable for biodiversity assessment and distribution modeling. Movebank supports this through the movepub R package, which provides methodologies for converting GPS tracking data to Darwin Core format for publication to GBIF and OBIS [33]. The transformation protocol includes several key technical decisions:
- Data reduction to hourly positions per animal to balance resolution with manageable data volume
- Exclusion of outliers and data from experimentally manipulated animals
- Precision reduction for sensitive species to mitigate conservation risks
- Maintenance of references to original datasets through DOIs
This transformation process exemplifies how interoperability can be achieved without sacrificing data quality or attribution, maintaining connections to rich source datasets while enabling use in broader biodiversity contexts.
Practical Implementation: Experimental Protocols and Workflows
Data Submission and Standardization Protocol
Implementing effective data interoperability requires systematic approaches to data preparation and submission. The following protocol outlines key steps for researchers:
Data Preparation Phase: Organize sensor data into consistent tabular formats, flag low-quality records as outliers, and compile comprehensive reference information about animal subjects, instrumentation, and deployment circumstances [33]. For BiP, this includes preparing detailed metadata conforming to international standards [5].
Platform Selection Phase: Choose appropriate platforms based on research objectives. Movebank's Data Repository offers citability and long-term preservation ideal for completed research datasets [32], while BiP provides specialized tools for cross-disciplinary environmental parameter extraction [5].
Metadata Assignment Phase: Utilize platform-specific tools (pull-down menus, automated terminology) to ensure consistent metadata application. Complete all required fields including taxonomic information, deployment details, and sensor specifications [5].
Quality Control Phase: Conduct internal review before submission. Movebank's curation team provides additional quality checks for repository submissions [32], while BiP's standardization processes ensure format consistency [5].
Publication and Licensing Phase: Select appropriate data licenses (e.g., Creative Commons) and access restrictions. Movebank Data Repository issues DOIs for data citation [32], while BiP applies CC BY 4.0 licensing to open datasets [5].
Data Interoperability Workflow
The following diagram illustrates the integrated workflow for achieving data interoperability across platforms, from initial collection to cross-disciplinary application:
Table 2: Research Reagent Solutions for Biologging Data Interoperability
| Tool/Resource | Function | Implementation Considerations |
|---|---|---|
| Movebank Data Repository | Formal archiving with DOI assignment, ensures long-term data preservation and citability | Requires data curation; best initiated while manuscripts are in review; provides CC licensing options [32] |
| Biologging intelligent Platform (BiP) | Sensor data standardization and environmental parameter calculation | Implements international metadata standards; OLAP tools derive oceanographic/meteorological data [5] |
movepub R Package |
Transforms Movebank GPS data to Darwin Core format for biodiversity platforms | Enables GBIF/OBIS integration; reduces data to hourly positions; maintains reference to original dataset [33] |
| Darwin Core Standard | Standardized format for sharing biodiversity data | Facilitates integration with global biodiversity infrastructure (GBIF, OBIS); supports species distribution modeling [33] |
| Creative Commons Licenses | Defines terms of use for shared data | Enables required attribution tracking; supports flexible data reuse policies while maintaining creator credit [33] |
Advanced Applications: Interoperability in Research and Public Health
The interoperability enabled by platforms like Movebank and BiP facilitates advanced applications that transcend traditional disciplinary boundaries. A compelling example emerges in public health surveillance, where animal movement data can serve as an early warning system for disease outbreaks. Researchers have proposed a framework using biologging devices to detect abnormal movement patterns linked to infection, potentially identifying zoonotic disease spread before outbreaks reach crisis levels [31].
This approach demonstrated practical utility during the 2021/22 avian flu outbreak in Israel's Hula Valley, where GPS-tracked cranes provided real-time data that guided management decisions during a mass mortality event [31]. The framework leverages interoperable data to enable six specific applications: (1) early warning systems, (2) real-time alerts when animals enter sensitive zones, (3) pre-symptomatic illness detection, (4) disease spread tracking, (5) targeted intervention guidance, and (6) predictive outbreak modeling [31].
Similarly, environmental monitoring applications benefit from data interoperability through platforms like BiP, which integrates animal-borne observations with oceanographic and meteorological data streams. The platform's OLAP tools can calculate surface currents, ocean winds, and wave parameters from animal movement data, creating valuable environmental datasets particularly in regions undersampled by conventional observing systems [5]. These applications highlight how interoperability multiplies the scientific value of biologging data beyond their original collection purposes.
The technical architecture supporting data interoperability involves multiple components working in concert to transform raw sensor data into discoverable, reusable resources. The following diagram illustrates this integrated framework:
The ongoing development of biologging platforms points toward increasingly sophisticated interoperability frameworks. Future advancements will likely include expanded standardization for diverse species and sensor types, automated publication pipelines to biodiversity platforms, and enhanced privacy-aware data sharing for sensitive species [33]. The integration of platforms like Movebank and BiP with global observation systems such as the Animal Borne Ocean Sensors (AniBOS) project further demonstrates the trajectory toward comprehensive environmental monitoring networks [5].
True interoperability requires more than technical compatibility—it demands cultural shifts toward open data sharing, collaborative development of standards, and institutional support for data curation. The platforms examined here provide the technical foundation for these collaborations, creating infrastructure that connects specialized research in movement ecology with broader scientific and societal challenges. As biologging technologies continue to evolve, robust interoperability frameworks will ensure that these rich data streams can fulfill their potential to illuminate ecological processes, inform conservation practice, and protect global health.
The field of movement ecology is undergoing a paradigm shift, driven by the advent of animal-borne sensors (bio-loggers) that provide unprecedented insights into animal behavior, physiology, and environmental interactions [1]. These technologies can record a suite of kinematic and environmental data, elucidating animal ecophysiology and directly improving conservation efforts [34]. An integrated bio-logging framework (IBF) represents a holistic approach to study design, connecting biological questions, sensor selection, data management, and analytical methods through multidisciplinary collaboration [1]. Despite this potential, a significant knowledge-action gap persists in conservation science, occurring when research outputs do not result in actions to protect or restore biodiversity [35]. This gap is perpetuated by barriers that make knowledge unavailable to practitioners, challenging to interpret, or difficult to use. This technical guide outlines how an integrated bio-logging framework, coupled with open science practices, can bridge this gap to enhance the effectiveness of conservation globally.
The Knowledge-Action Gap in Conservation
The knowledge-action gap in conservation science presents a critical challenge that undermines the return on investment in ecological research. Fundamental barriers include:
- Knowledge Unavailability: Practitioners and policy makers often cannot access scientific literature behind paywalls, preventing the application of relevant findings [35].
- Interpretation Challenges: Complex statistical models and specialized terminology in scientific literature can be inaccessible to conservation managers [35].
- Useability Limitations: Research outputs often lack the practical tools, contextual recommendations, or accessible formats needed for direct implementation in conservation practice [35].
The consequences of this gap are profound, increasing the likelihood that conservation decisions are based on personal experience, anecdotal evidence, or political beliefs rather than scientific evidence [35]. Furthermore, substantial global biases and gaps exist in the collection of bio-logged data, with the majority of data collected in remote or suburban regions in Europe and the United States, while highly urbanized areas and regions across the Global South are largely ignored [24]. These disparities hinder the development of effective global biodiversity conservation strategies.
An Integrated Biologging Framework for Knowledge Transfer
The Integrated Bio-logging Framework (IBF) connects four critical areas—biological questions, sensor selection, data management, and analytical techniques—through a cycle of feedback loops, linked by multi-disciplinary collaboration [1]. This framework provides a structured approach to ensuring that biologging research produces actionable knowledge for conservation practitioners.
Table 1: Nodes of the Integrated Bio-Logging Framework for Conservation Application
| Framework Node | Description | Role in Bridging Science-Practice Gap |
|---|---|---|
| Biological Questions | Formulating conservation-driven research questions | Ensures research addresses pressing management needs and conservation priorities |
| Sensor Selection | Choosing appropriate sensors (GPS, accelerometers, environmental sensors) | Matches technology to measurable parameters relevant to conservation monitoring |
| Data Management | Handling storage, standardization, and sharing of complex datasets | Enables data accessibility and interoperability for practitioners |
| Analytical Techniques | Applying appropriate statistical models and machine learning | Generates interpretable and actionable insights from complex biologging data |
A key feature of the IBF is its flexibility to accommodate both question-driven and data-driven approaches [1]. In a question-driven pathway, researchers start with a specific conservation problem (e.g., reducing bycatch of marine mammals), then select appropriate sensors and analytical methods to address it. In a data-driven pathway, the exploration of existing biologging data can reveal novel patterns that inform new conservation strategies.
Open Science Platforms for Accessible Data
Open science practices directly address the fundamental barriers of availability, interpretability, and useability that perpetuate the knowledge-action gap [35]. Several key platforms and initiatives have emerged to support the sharing and application of biologging data for conservation.
Table 2: Biologging Data Platforms and Their Conservation Applications
| Platform/Initiative | Primary Function | Conservation Applications |
|---|---|---|
| Biologging intelligent Platform (BiP) | Standardized platform for sharing, visualizing, and analyzing biologging data | Stores sensor data with metadata conforming to international standards; facilitates collaborative research across disciplines [5] |
| Movebank | Largest database of animal tracking data | Provides 7.5 billion location points and 7.4 billion other sensor data across 1478 taxa (as of January 2025) for distribution mapping and meta-analyses [5] |
| AniBOS | Global ocean observation system using animal-borne sensors | Gathers physical environmental data worldwide using marine animals as environmental sentinels [5] |
| Bio-logger Ethogram Benchmark | Public benchmark for comparing machine learning techniques | Standardizes evaluation of behavior classification methods, enabling robust activity budgeting for conservation management [34] |
These platforms exemplify how open science can transform conservation by making critical data available. For instance, BiP not only stores sensor data but also standardizes this information to facilitate secondary data analysis through its Online Analytical Processing (OLAP) tools, which can calculate environmental parameters such as surface currents, ocean winds, and waves from data collected by animals [5]. This functionality expands the utility of biologging data beyond biological questions to directly inform environmental monitoring for conservation.
Case Studies: From Biologging Data to Conservation Action
Disease Surveillance and Management
Biologging has emerged as a powerful tool for detecting and managing wildlife disease outbreaks, which pose growing threats to both human and animal health [36]. A six-component framework leverages historical and near-real-time biologging data from tracked animals to support disease management across outbreak stages:
- Identifying Sentinel Species: Selecting appropriate species that serve as early warning systems for pathogen presence
- Detecting Anomalous Behavior: Using accelerometers and other sensors to identify sickness behaviors indicative of infection
- Mapping Transmission Risk: Combining movement data with pathogen epidemiology to model spread pathways
- Monitoring Interventions: Assessing the effectiveness of control measures in near-real-time
- Predicting Spillover Risk: Identifying areas and species with high potential for cross-species transmission
- Informing Public Health Policies: Translating data into actionable management recommendations [36]
For example, researchers have used accelerometer sensors connected to wild boars to detect when animals are sick with African swine fever [24]. Similarly, GPS-tracked white storks have revealed that individuals often feed in landfills, suggesting potential pathways for pathogen exposure and transmission [24].
Real-Time Biodiversity Monitoring and Protected Area Management
Bio-logging provides direct, real-time observations of individual animal performances, survival strategies, and reproductive successes in dynamically changing environments [24]. This capability transforms how we monitor and manage protected areas:
- Marine Megafauna Protection: A comprehensive synthesis of satellite tracking data from 484 individuals across six marine megafauna species (including sea turtles, humpback and blue whales, whale sharks, and tiger sharks) in north-western Australia overlayed animal movement data with maps of anthropogenic threats (coastal development, shipping traffic, fishing effort, etc.). The analysis revealed distinct hotspots where critical habitats overlap with multiple threats, enabling science-based guidance for mitigation strategies such as adjusting shipping lanes or expanding protected areas [37].
- Dynamic Management Strategies: Movement data can facilitate more holistic protections for diverse taxa by considering spatiotemporal and cultural elements of animal behavior. For instance, dynamic management strategies that integrate animal culture can yield more effective conservation outcomes, as demonstrated in cetacean conservation [38].
The following workflow diagram illustrates how biologging data progresses from collection to conservation action:
Addressing Global Biases in Conservation Data
Despite its potential, an analysis of biologging data revealed substantial global biases, with most data collected in remote or suburban regions in Europe and the United States, while rapidly changing environments across the Global South are underrepresented [24]. Addressing this imbalance requires:
- Democratizing Access: Deploying emerging software-defined tracking technologies more broadly and fairly, particularly in underrepresented regions [24].
- Expanding Monitoring Scope: Increasing biologging efforts in urban environments and human-dominated landscapes where human-wildlife conflicts are most pronounced [24].
- Building Local Capacity: Ensuring that conservation practitioners in biodiverse regions have the tools and training to utilize biologging technologies effectively.
Essential Tools and Experimental Protocols
The Scientist's Toolkit: Research Reagent Solutions
Table 3: Essential Biologging Tools for Conservation-Ready Research
| Tool/Sensor Type | Function | Conservation Application Examples |
|---|---|---|
| GPS/GNSS receivers | Animal location tracking | Space use analysis, migratory corridor identification, human-wildlife conflict monitoring [1] |
| Tri-axial accelerometers | Measure dynamic body acceleration | Behavior classification, energy expenditure estimation, disease detection [34] |
| Environmental sensors | Record ambient conditions | Habitat quality assessment, climate change monitoring, oceanographic data collection [5] |
| Data standardization protocols | Ensure interoperability | Metadata standards (ITIS, CF, ACDD, ISO) enable data sharing and collaboration [5] |
| Machine learning classifiers | Automated behavior recognition | Activity budgeting at population scale, anomaly detection [34] |
Analytical Framework for Quantifying Environmental Influence
A machine learning-based analytic framework quantifies the influence of environmental variables on animal movement by utilizing the multivariate richness of biologging data [39]. This approach involves:
- Predicting Environmental Variables: Building a model to predict an environmental variable (e.g., resource availability) from a large number of animal movement variables, representing the environment as perceived by the animal [39].
- Maximizing Informative Variables: Using as many meaningful movement variables as possible, including human-constructed ecological variables, mathematical/physical variables, or abstract features from automated deep learning algorithms [39].
- Rigorous Validation: Predicting environmental variables on a separate test dataset from a different temporal range than the training set to prevent overfitting due to autocorrelation in animal movement data [39].
- Quantifying Influence: Using the coefficient of determination (R²) to quantify the fit between predicted and measured environmental variables, representing how much of the variation in the environmental variable influenced animal movement in a multivariate fashion [39].
This framework proved effective in a case study demonstrating that on a one-hour timescale, 37% of the variation in grass availability and 33% of time since milking influenced cow movements, providing quantifiable metrics of environmental impact on behavior [39].
The following diagram illustrates the conceptual framework for translating biologging data into conservation decisions:
Implementation Roadmap and Future Directions
Transforming conservation with biologging data requires strategic implementation of open science practices and addressing current limitations:
- Adopt Open Access Publishing: Ensure conservation research is available to all practitioners through open access publishing models that break down paywall barriers [35].
- Share Open Materials: Increase transparency and useability of research findings by sharing detailed methods, data, code, and software [35].
- Develop Open Education Resources: Enable conservation scientists and practitioners to acquire the skills needed to effectively use research outputs [35].
- Enhance Analytical Methods: Address the challenges of analyzing complex, autocorrelated time-series data from biologging devices with appropriate statistical models [28].
- Promote Multi-Sensor Approaches: Leverage the frontier of multi-sensor biologging to build a more comprehensive understanding of animal-environment interactions [1].
The long-term adoption of these open science practices would help researchers and practitioners achieve conservation goals more quickly and efficiently while reducing inequities in information sharing [35]. However, short-term costs for individual researchers—including insufficient institutional incentives to engage in open science and knowledge mobilization—remain a significant challenge that must be addressed through institutional policy changes.
As global change accelerates, with expanding human infrastructure, climate shifts, and habitat loss, understanding and managing wildlife movement and connectivity through biologging becomes increasingly critical for effective conservation [37]. By implementing the integrated framework outlined in this guide, the conservation community can transform the potential of biologging into tangible conservation outcomes that bridge the science-practice gap.
The field of biologging, which involves attaching data recorders to animals to monitor their behavior, physiology, and surrounding environment, has revolutionized movement ecology research [5]. The practice has expanded from initial studies on Antarctic seals and penguins to include a diverse array of terrestrial and marine species, providing unprecedented insights into animal movement, environmental tracking, and ecosystem dynamics [5]. However, the distribution of biologging studies across global ecosystems remains markedly uneven, creating significant biases in our understanding of animal ecology and movement patterns. This technical guide examines the current inequities in biologging study distribution within the framework of integrated biologging, proposing concrete methodological solutions and strategic approaches to create a more globally representative and equitable research paradigm.
Current State of Biologging Distribution Inequities
Documented Geographical Biases
Analysis of existing biologging data reveals pronounced geographical concentrations that limit the global applicability of findings. Marine biologging efforts are overwhelmingly concentrated in polar regions and the eastern Pacific Ocean, with data from phocid seals in these regions becoming comparable in volume to that collected by Argo floats [5]. This concentration creates significant knowledge gaps for temperate and tropical marine ecosystems where pinnipeds are absent, despite efforts to use sea turtles, sharks, and large-bodied fish as alternative data collection platforms [5].
Terrestrial biologging exhibits similar biases, with individual tracking studies often limited to small sample sizes (typically <30 individuals) over short time periods (days to months), restricting broad-scale ecological inferences [7]. This limitation is particularly acute for broadly distributed species or those with large populations, where logistical and financial constraints prevent representative sampling [7].
Table 1: Documented Biases in Global Biologging Study Distribution
| Bias Category | Current Status | Impact on Research |
|---|---|---|
| Geographical Coverage | Concentrated in Antarctic, Arctic, and eastern Pacific [5] | Limited understanding of tropical/temperate ecosystems |
| Taxonomic Representation | Over-reliance on pinnipeds in marine environments [5] | Gaps in species-specific movement ecology |
| Sensor Diversity | Majority of stored data is location-only [7] | Limited behavioral and physiological context |
| Data Standardization | Inconsistent formats across devices and manufacturers [5] | Hinders collaborative research and meta-analyses |
Consequences for Ecological Understanding and Conservation
The inequitable distribution of biologging studies has profound implications for both basic ecology and conservation applications. Biased data collection creates gaps in understanding population-level movements, including range contractions, expansions, climate tracking, and migration patterns that are essential for effective conservation planning [7]. This limitation is particularly critical given that human pressures distinctly shift community composition and decrease local diversity across terrestrial, freshwater, and marine ecosystems [40]. Without representative global data, conservation strategies may be inadequately targeted, potentially overlooking regions and species most vulnerable to anthropogenic impacts.
Integrated Biologging Framework: Addressing Inequities
Conceptual Foundation
The Integrated Biologging Framework (IBF) provides a structured approach to optimize the use of biologging techniques across diverse ecosystems and research questions [41]. This framework emphasizes that multisensor approaches represent a new frontier in biologging, while also addressing current limitations in sensor technology, data exploration, and analytical methods [41]. When applied specifically to addressing distribution inequities, the IBF enables researchers to:
- Systematically identify geographical and taxonomic gaps in existing biologging data
- Develop targeted deployment strategies that complement existing datasets
- Implement standardized data formats that facilitate global collaborations
- Create multidimensional visualization methods appropriate for diverse ecosystems
Strategic Framework for Equitable Distribution
Diagram 1: Strategic framework for equitable biologging distribution
Methodological Solutions for Reducing Biases
Alternative Sensor Platforms for Understudied Regions
In regions where traditional biologging platforms are unavailable or impractical, researchers can deploy sensors on alternative species that fill similar ecological niches. For tropical and temperate marine environments where pinnipeds are absent, sea turtles, sharks, and large-bodied fish have proven effective for collecting oceanographic data, with water temperature data from SRDLs on turtles showing high correlation with measurements from established observation instruments [5]. For terrestrial systems, broad-scale occurrence data from crowdsourced databases (eBird, iNaturalist), weather surveillance radars, and passive automated sensors (acoustic monitoring units, camera trap networks) can complement traditional biologging to infer population-level movements [7].
Table 2: Platform Alternatives for Understudied Ecosystems
| Ecosystem Type | Traditional Platforms | Alternative Platforms | Validated Parameters |
|---|---|---|---|
| Tropical Marine | Pinnipeds (limited) | Sea turtles, sharks, large fish [5] | Water temperature, salinity, dive profiles [5] |
| Temperate Marine | Pinnipeds (limited) | Seabirds, sea turtles [5] | Ocean currents, winds, waves [5] |
| Freshwater | Limited tracking studies | Acoustic monitoring, camera traps [7] | Presence/absence, density, migration timing [7] |
| Remote Terrestrial | Large mammals | Sensor networks, crowd-sourced data [7] | Distribution shifts, range changes [7] |
Standardized Protocols for Multi-Sensor Deployment
Implementing standardized sensor deployment and data collection protocols across regions is essential for generating comparable datasets. The Biologging intelligent Platform (BiP) establishes internationally recognized standards for sensor data and metadata storage, conforming to Integrated Taxonomic Information System (ITIS), Climate and Forecast Metadata Conventions (CF), Attribute Conventions for Data Discovery (ACDD), and International Organization for Standardization (ISO) formats [5]. Key methodological considerations include:
- Sensor Selection: Match appropriate sensors and sensor combinations to specific biological questions, recognizing that multisensor approaches are a new frontier in biologging [41].
- Metadata Collection: Document detailed metadata including animal traits (sex, body size), instrument specifications, and deployment circumstances using standardized templates [5].
- Temporal Resolution: Align sampling frequency with movement properties of the species and research questions, ensuring sufficient temporal resolution to detect relevant biological patterns [7].
Complementary Methodological Approaches
Diagram 2: Methodological approaches for filling biologging gaps
Technological and Analytical Tools
Research Reagent Solutions
Table 3: Essential Tools for Equitable Biologging Research
| Tool Category | Specific Examples | Function & Application |
|---|---|---|
| Data Loggers | Satellite Relay Data Loggers (SRDLs) [5] | Transmit compressed data (dive profiles, depth-temperature) via satellite without recapture |
| Sensor Types | Accelerometers, depth sensors, water temperature sensors, salinity sensors [5] | Capture behavioral, physiological, and environmental data |
| Data Platforms | Biologging intelligent Platform (BiP) [5] | Standardized storage of sensor data and metadata following international standards |
| Analytical Tools | Online Analytical Processing (OLAP) tools [5] | Calculate environmental parameters (surface currents, ocean winds) from animal-collected data |
| Occurrence Databases | Movebank, eBird, iNaturalist [7] | Provide broad-scale occurrence data for population-level movement inference |
Data Integration and Analysis Framework
Effective integration of biologging data across diverse sources requires sophisticated analytical approaches. The Structural Similarity (SSIM) index, adapted from computer science image compression techniques, offers a quantitative spatial comparison tool that can be enhanced to incorporate uncertainty from underlying spatial models [42]. This approach uses a spatially-local window to calculate statistics based on local mean, variance, and covariance between compared maps, providing novel insights into spatial structure that cannot be obtained through visual inspection or cell-by-cell subtraction alone [42].
For population-level movement analysis, researchers can employ distance-based unconstrained ordination plots to assess individual and case-specific effects of human pressures on community composition [40]. This meta-analytical framework allows discrimination between changes of homogeneity and shifts in composition of biological communities in relation to human pressures, facilitating cross-ecosystem comparisons.
Implementation Roadmap
Collaborative Partnerships and Capacity Building
Addressing global biologging inequities requires intentional collaboration between well-resourced and under-resourced research institutions. Effective partnership models include:
- Technology Transfer: Sharing access to biologging platforms like the Biologging intelligent Platform (BiP), which provides interactive data upload, metadata input, and format standardization capabilities [5].
- Training Programs: Developing regional expertise in biologging deployment, data management, and analysis techniques, particularly for multisensor approaches that represent a new frontier in biologging [41].
- Data Sharing Frameworks: Implementing balanced data sharing agreements that respect ownership while enabling broader access, such as BiP's flexible open and private data settings with CC BY 4.0 licensing for open datasets [5].
Funding and Infrastructure Development
Sustainable progress toward equitable biologging distribution requires strategic investment in:
- Appropriate Technology: Developing cost-effective, durable sensors suitable for deployment in diverse environmental conditions across underrepresented regions.
- Data Infrastructure: Expanding storage and computational capacity in underrepresented regions to facilitate local data management and analysis.
- Logistical Support: Building capacity for field operations in remote and understudied ecosystems, including deployment, recovery, and maintenance of biologging equipment.
Overcoming global inequities in biologging study distribution requires a concerted, systematic approach that integrates technological innovation, methodological standardization, and intentional collaboration. By implementing the Integrated Biologging Framework with specific attention to geographical and taxonomic gaps, researchers can generate a more comprehensive understanding of animal movement ecology across global ecosystems. The strategies outlined in this technical guide provide a roadmap for developing a truly global biologging infrastructure that supports both basic ecological research and effective conservation planning in an era of rapid environmental change.
The paradigm-changing opportunities of bio-logging sensors for ecological research, especially movement ecology, are vast, enabling researchers to observe the unobservable by collecting high-frequency behavioral, physiological, and environmental data from free-ranging animals [1]. This revolution has resulted in the development and use of a variety of sensors, including accelerometers, magnetic field sensors, gyrometers, temperature and salinity sensors, video cameras, and proximity-loggers [1]. However, this rapid technological expansion has created a critical gap: how best to match the most appropriate sensors and sensor combinations to specific biological questions, and how to analyze the complex, high-dimensional data they produce [1]. The crucial questions of how best to optimize sensor use and analyze complex bio-logging data are mostly ignored, creating a disconnect between data collection and analytical capacity. This paper examines the core technical constraints of biologging sensors and evaluates the statistical modeling challenges that must be overcome to realize the full potential of integrated biologging frameworks in movement ecology.
Sensor Constraints in Biologging Technology
Physical and Technical Limitations of Current Sensors
Biologging sensors face inherent physical and technical constraints that limit their application and data quality. Table 1 summarizes the primary constraint categories and their implications for research.
Table 1: Technical Constraints of Biologging Sensors and Their Research Implications
| Constraint Category | Specific Limitations | Impact on Research |
|---|---|---|
| Power & Memory | Limited battery life, finite storage capacity | Restricts deployment duration and sampling frequency; creates trade-offs between sensor types and data resolution [1] |
| Size & Weight | Strict miniaturization requirements (typically <3-5% of animal body mass) | Limits sensor types and combinations possible; constrains battery size and thus operational lifetime [1] |
| Data Transmission | Limited bandwidth in satellite and radio systems | Restricts data volume transmission, necessitating data compression or summarization before transmission [5] |
| Environmental Challenges | Canopy cover impeding GPS signals, saltwater blocking radio waves, extreme pressure at depth | Causes data gaps and failures in telemetry devices; requires supplemental sensing strategies [1] [43] |
A key limitation of telemetry devices is transmission technology failure, such as when canopy cover impedes GPS satellite fixes [1]. Similarly, radio waves cannot penetrate saltwater, limiting surface-only observations in marine environments [5]. These constraints often necessitate the combined use of inertial measurement units (IMUs) with elevation/depth recording sensors to reconstruct animal movements in 2D and 3D using dead-reckoning procedures, irrespective of transmission conditions [1].
Data Quality and Resolution Challenges
Sensor data quality is affected by multiple factors that complicate interpretation:
- Error Propagation: In dead-reckoning, errors in speed estimation (from dynamic body acceleration) and heading (from magnetometers) accumulate over time, causing significant drift in reconstructed movement paths without regular absolute position fixes [1].
- Noisy Measurements: Sensors like accelerometers capture both biological signals and environmental noise, requiring sophisticated filtering techniques to extract meaningful behavioral signatures [1].
- Spatio-Temporal Mismatch: The scale and resolution of sensor data often misalign with environmental data sources, creating analytical challenges when linking animal movement to environmental covariates [44].
Analytical Challenges in Movement Ecology
Limitations of Current Statistical Approaches
The field of movement ecology faces significant analytical hurdles in extracting biological meaning from complex multi-sensor data. Table 2 compares common statistical models used to characterize species-habitat associations, highlighting their specific limitations.
Table 2: Limitations of Common Statistical Models in Movement Ecology
| Model Type | Primary Function | Key Limitations |
|---|---|---|
| Resource Selection Functions (RSF) | Estimates relative probability of habitat use based on environmental characteristics [45] | Often fails to account for temporal autocorrelation in movement data; can produce biased inference if relevant environmental covariates are omitted [45] [44] |
| Step Selection Functions (SSF) | Models habitat selection based on movement steps between successive locations [45] [44] | Requires relatively high-frequency data; misspecified availability distributions can lead to erroneous conclusions [45] |
| Hidden Markov Models (HMM) | Relates movement data to discrete behavioral states and environmental covariates [45] | Computational complexity increases with data volume and state complexity; requires careful model selection to avoid overfitting [45] |
| Dynamic Interaction Indices | Quantifies potential interactions between moving individuals [44] | Cannot account for environmental covariates; often spuriously detects interactions when animals respond to same environmental features [44] |
Each model is appropriate for specific research questions and scales of inference [45]. For example, while RSFs and SSFs are typically used to address similar questions on habitat selection, SSFs generally require relatively high-frequency data compared to RSFs [45]. Neglecting the effects of physical environmental features when analysing interactions between moving animals leads to biased inference, where inter-individual interactions are spuriously inferred as affecting movement when animals are actually responding to the same environmental features [44].
The Big Data Challenge in Multi-Sensor Biologging
The integration of multiple sensors creates significant computational and analytical challenges:
- Data Volume and Complexity: Multi-sensor approaches generate high-frequency multivariate data streams that greatly expand the fundamentally limited and coarse data that could be collected using location-only technology such as GPS [1]. A single accelerometer can generate millions of data points per deployment, creating storage, processing, and visualization challenges.
- Data Integration: Fusing data from different sensors (e.g., accelerometry, magnetometry, depth, temperature) requires precise time-synchronization and calibration, with errors propagating through analytical pipelines [1].
- Dimensionality: The high-dimensional feature spaces extracted from multi-sensor datasets can lead to overfitting unless appropriate dimension-reduction techniques are employed [1].
Advanced Analytical Frameworks and Solutions
Integrated Bio-logging Framework (IBF)
The Integrated Bio-logging Framework (IBF) represents a structured approach to address the challenges of biologging study design and analysis [1]. This framework connects four critical areas—questions, sensors, data, and analysis—via a cycle of feedback loops, linked by multi-disciplinary collaboration [1]. The IBF emphasizes that taking advantage of the bio-logging revolution will require a large improvement in the theoretical and mathematical foundations of movement ecology to include the rich set of high-frequency multivariate data [1].
The following diagram illustrates the core workflow and decision points within this integrated framework:
Advanced Statistical Modeling Approaches
Several advanced statistical approaches show promise for addressing the limitations of current movement models:
Functional Data Analysis (FDA): FDA is a statistical approach for analyzing dynamic data that vary continuously, modeling entire curves or functions to capture underlying patterns instead of viewing data as isolated points [46]. This approach is particularly useful for sensor data like acceleration profiles, temperature curves, and spectral measurements where shape and structure are key to understanding [46]. FDA handles noisy data through filtering, transformation, alignment, and smoothing techniques that reduce noise impact while preserving important patterns [46].
State-Space Models and HMMs: These models account for both observation error in sensor measurements and underlying behavioral states, providing a more robust framework for interpreting noisy sensor data [45]. HMMs can reveal variable associations with environmental covariates across different behaviors, for example, identifying a positive relationship between prey diversity and slow-movement behavior that might be missed by other methods [45].
Spatial+ Methods: When landscape data is unavailable or incomplete, Spatial+ methods can reduce bias from unmeasured spatial factors in interaction analyses [44]. This approach removes the effect of space on considered covariates, thereby reducing spurious interaction effects [44].
Multi-Sensor Integration and Data Fusion
Multi-sensor approaches represent a new frontier in biologging, with the combined use of multiple sensors providing indices of internal state and behavior, revealing intraspecific interactions, reconstructing fine-scale movements, and measuring local environmental conditions [1]. For example, combining geolocator and accelerometer tags has enabled researchers to record flight behavior of migrating swifts, while micro barometric pressure sensors have uncovered the aerial movements of migrating birds [1]. Sensor fusion techniques, such as those used in laser powder bed fusion manufacturing processes, demonstrate how integrating multiple sensing phenomena can more accurately characterize complex systems [47].
Experimental Protocols and Research Toolkit
Standardized Methodologies for Sensor Data Analysis
To ensure reproducible results in biologging studies, researchers should implement standardized protocols for data collection and analysis:
- Sensor Calibration Procedures: Before deployment, all sensors should undergo laboratory and field calibration to characterize measurement error and establish baseline performance under controlled conditions [1]. Magnetometers require local magnetic field calibration to minimize heading errors for dead-reckoning [1].
- Behavioral Validation Experiments: Conduct controlled experiments where animal behavior is directly observed (via video) and correlated with sensor measurements to build robust classification models, especially for accelerometer-based behavior identification [4].
- Data Preprocessing Pipeline: Implement consistent protocols for data smoothing, filtering, and compression that are appropriate for the specific sensor type and research question [1] [46].
Research Reagent Solutions for Biologging Studies
Table 3: Essential Tools and Platforms for Modern Biologging Research
| Tool Category | Specific Solutions | Function and Application |
|---|---|---|
| Data Management Platforms | Movebank, Biologging intelligent Platform (BiP) [5] | Standardized sensor data and metadata storage; facilitate data sharing and collaborative research across disciplines |
| Online Analytical Processing | BiP OLAP tools [5] | Calculate environmental parameters from animal-borne sensor data (e.g., surface currents, ocean winds, waves) |
| Sensor Fusion Algorithms | Feature-driven and raw data-driven machine learning models [47] | Integrate multiple sensor streams to characterize complex phenomena like predator-prey interactions or environmental conditions |
| Movement Analysis Packages | amt, momentuHMM in R [45] |
Implement SSFs, HMMs, and other movement models with standardized methodologies |
The technical constraints of biologging sensors and limitations of current statistical models represent significant but surmountable challenges in movement ecology. Overcoming these limitations requires a multi-disciplinary approach that integrates engineering, statistics, ecology, and computer science [1]. Future advances will depend on developing more sophisticated statistical foundations that can properly handle the rich, high-frequency multivariate data generated by modern bio-logging technology [1]. Equally important will be the establishment of collaborative frameworks and standardized platforms for sharing, visualizing, and analyzing biologging data [5]. If these challenges can be addressed, clear potential exists for developing a vastly improved mechanistic understanding of animal movements and their roles in ecological processes, and for building realistic predictive models to address critical conservation challenges in a changing world [1] [48].
Validating Approaches and Comparing Methods in Movement Ecology
Habitat use studies are fundamental to wildlife ecology, informing conservation strategies and management actions. The methods used to collect data on animal-environment relationships significantly influence the inferences drawn. This whitepaper provides a technical comparison between two predominant approaches for studying habitat use: biologging coupled with Resource Selection Functions (RSF) and camera trapping integrated with Imperfect Detection Models (IDM).
Biologging involves attaching electronic devices to animals to remotely collect data on their movements, behavior, and physiology [49] [1]. When combined with RSF, which statistically compares used locations to available locations, this approach reveals habitat selection patterns from the individual's perspective [49]. Conversely, camera traps are stationary, automatically triggered cameras that capture animal presence at specific locations [49]. When analyzed with IDM, which accounts for imperfect detection probability, this approach infers habitat use patterns from a population-level perspective [49] [50].
Understanding the strengths, limitations, and appropriate contexts for each method is crucial for designing effective wildlife studies, particularly within the emerging Integrated Bio-logging Framework for movement ecology research [1] [2].
Technical Foundations of Both Approaches
Biologging and Resource Selection Functions (RSF)
Biologging technologies encompass a suite of sensors deployed on animals, including GPS receivers, accelerometers, magnetometers, gyroscopes, and environmental sensors [1]. These devices collect high-frequency data on animal location, movement, behavior, and the surrounding environment.
Resource Selection Functions are statistical models that compare environmental covariates at locations used by animals to those available within their domain to quantify selection patterns [49]. The core RSF equation takes the form:
[ w(x) = exp(β₁x₁ + β₂x₂ + ... + βₙxₙ) ]
Where ( w(x) ) is the relative probability of selection, ( x₁...xₙ ) are environmental covariates, and ( β₁...βₙ ) are coefficients estimated from the data [49].
Table 1: Key sensors used in biologging and their primary applications
| Sensor Type | Measured Parameters | Primary Ecological Applications |
|---|---|---|
| GPS/GNSS | Horizontal position | Space use, home range, movement paths |
| Accelerometer | Dynamic body acceleration | Behavior identification, energy expenditure, biomechanics |
| Magnetometer | Heading direction | Movement reconstruction, orientation |
| Gyroscope | Body rotation | Fine-scale movement analysis |
| Pressure sensor | Depth/altitude | 3D movement reconstruction |
| Temperature/Salinity | Ambient conditions | Environmental monitoring, space use |
Camera Traps and Imperfect Detection Models (IDM)
Camera traps provide a non-invasive method for documenting animal presence through photographic evidence. Modern units can operate continuously for extended periods, triggered by passive infrared motion sensors [49] [51].
Imperfect Detection Models, including occupancy models and N-mixture models, address a critical limitation of wildlife surveys: the failure to detect species when present. These models use repeated surveys to estimate detection probability (p) and true occupancy (ψ) or abundance (N) [49] [50]. The basic occupancy model structure is:
[ zi \sim Bernoulli(ψi) ] [ y{ij} \mid zi \sim Bernoulli(zi × p{ij}) ]
Where ( zi ) is the true occupancy at site i, ( y{ij} ) is the observed detection/non-detection at site i during survey j, and ( p_{ij} ) is the detection probability [49].
Methodological Comparison: Experimental Protocols
Field Deployment Protocols
Biologging deployment requires animal capture and handling, which involves significant logistical planning, permitting, and ethical considerations [49] [1]. Key steps include:
- Device selection: Matching sensor capabilities, size (<3-5% of body mass), attachment method, and power requirements to biological questions and study species [1]
- Animal capture: Using safe, species-appropriate methods (traps, nets, chemical immobilization) by trained personnel
- Device attachment: Securing tags via collars, harnesses, adhesives, or direct implantation depending on species and study objectives
- Data retrieval: Via remote transmission (satellite, UHF) or physical recapture and tag recovery [1]
Camera trap deployment follows a different protocol focused on spatial sampling:
- Grid design: Systematic or stratified random placement across the study area to ensure representative sampling of environmental gradients [49] [50]
- Station setup: Mounting cameras approximately 30-50 cm above ground on secure substrates (trees, posts)
- Configuration: Setting appropriate sensitivity, trigger intervals, and image resolution for target species
- Maintenance: Regular visits to replace batteries, memory cards, and address technical issues [50] [51]
Data Processing and Analytical Workflows
The data processing pipelines differ substantially between approaches:
Biologging data processing involves:
- Data cleaning and filtering to remove erroneous fixes
- Behavioral classification using machine learning approaches applied to multi-sensor data (e.g., accelerometry)
- Path reconstruction using movement models and dead-reckoning approaches [1]
- Environmental covariate extraction for each animal location
Camera trap data processing includes:
- Image organization and species identification
- Temporal independence criteria application to define separate detection events
- Covariate extraction for each camera location
- Formatting detection histories for occupancy or N-mixture models [50] [52]
Comparative Analysis: Empirical Evidence
Doñana National Park Case Study
A direct comparative study in Doñana National Park (Spain) simultaneously deployed both methods to study habitat use of three ungulate species: red deer (Cervus elaphus), fallow deer (Dama dama), and wild boar (Sus scrofa) [49] [53]. The research involved 60 camera trap stations and 17 biologged animals (7 red deer, 6 fallow deer, 4 wild boar) monitored during the same periods.
Table 2: Comparison of key habitat predictors identified by RSF and IDM approaches in Doñana National Park
| Species | RSF Approach (Biologging) | IDM Approach (Camera Traps) | Spatial Agreement |
|---|---|---|---|
| Red Deer | Strong selection for wet enclosed areas | Wet areas influential for relative abundance; year/time affected detection | Moderate, increased at broader scales |
| Fallow Deer | Selection related to marshland vegetation | Habitat openness positively influenced use | Low, divergent patterns |
| Wild Boar | Use of scrubland areas | Use of areas with higher water availability | High across scales |
The study found that the two approaches identified different environmental predictors as most relevant and produced spatial patterns of habitat use with varying levels of concordance depending on species and scale [49] [53]. For wild boar, both methods showed high agreement in predicted spatial use, while for fallow deer, the patterns were largely divergent.
Northwestern Territories Avian Study
Research on Sandhill Cranes (Antigone canadensis) in Canada compared habitat models derived from 229 camera traps and 160 Autonomous Recording Units (ARUs) [50]. The study tested models at two spatial scales (300m and 2000m) and found that:
- ARU-based models estimated higher occupancy probabilities and performed better at the 2000m landscape scale
- Camera trap models had better fit at the 300m home range scale
- An integrated model combining both data sources did not improve predictive performance over single-method models [50]
Multi-Species Comparison in Eastern Washington
A comprehensive study simultaneously collected GPS collar (Lagrangian) and camera trap (Eulerian) data for seven species to compare inferences about habitat and spatial associations [54]. The research found general agreement between predicted spatial distributions for most species in paired analyses, though specific habitat relationships differed. The discrepancies were attributed to differences in statistical power associated with each sampling method and spatial mismatches in the data [54].
Table 3: Advantages and limitations of biologging and camera trapping approaches
| Aspect | Biologging with RSF | Camera Trapping with IDM |
|---|---|---|
| Spatial Perspective | Individual-level (Lagrangian) | Population-level (Eulerian) |
| Data Collection | Continuous animal paths | Point-based detections |
| Key Strengths | High-resolution individual movement data; Behavior-habitat links; Unlimited by animal activity state | Non-invasive; Cost-effective; Minimal behavioral impact; Multi-species data; No handling required |
| Key Limitations | Invasive handling required; High cost per individual; Potential behavioral effects; Small sample sizes | Limited to active periods; Uncertain detection area; Extensive data processing; Misses inactivity periods |
| Statistical Approach | Compares used vs available locations | Accounts for imperfect detection |
| Ideal Applications | Fine-scale habitat selection; Movement ecology; Energetics; Individual variation | Multi-species monitoring; Population-level patterns; Long-term trends; Rare species |
The Scientist's Toolkit: Essential Research Solutions
Table 4: Essential equipment and analytical solutions for habitat use studies
| Tool Category | Specific Solutions | Function & Application |
|---|---|---|
| Biologging Hardware | GPS loggers, Accelerometers, Gyroscopes, Magnetometers | Collect movement, behavior, and environmental data from free-ranging animals |
| Camera Trap Systems | Passive infrared motion-activated cameras | Document animal presence and activity patterns non-invasively |
| Data Management Platforms | Movebank, Biologging intelligent Platform (BiP) | Store, standardize, share, and visualize biologging data [5] |
| Analytical Frameworks | Resource Selection Functions (RSF), Occupancy Models, N-Mixture Models | Statistically link animal data to environmental predictors |
| Sensor Integration Tools | Inertial Measurement Units (IMUs), Multi-sensor tags | Capture comprehensive behavioral and environmental data [1] |
| Data Processing Software | CamtrapR, camtrapR, move package for R |
Manage and process camera trap and movement data efficiently |
Integrated Framework for Movement Ecology
The Integrated Bio-logging Framework (IBF) provides a structured approach to optimize the use of animal-borne sensors in movement ecology research [1] [2]. This framework connects four critical areas through a cycle of feedback loops:
- Biological Questions: Formulating precise research objectives
- Sensor Selection: Matching appropriate sensors and combinations to questions
- Data Collection: Implementing efficient sampling designs
- Analysis Methods: Applying appropriate statistical models and visualization techniques
The IBF emphasizes that multi-sensor approaches represent a new frontier in biologging, while highlighting the importance of multi-disciplinary collaborations to address the complexities of bio-logging data [1] [2].
The comparative evidence indicates that biologging and camera trapping approaches are not methodologically equivalent but rather complementary [49] [53] [54]. Biologging provides detailed individual-level data on movement and behavior, while camera traps offer population-level perspectives across broader spatial scales with minimal invasiveness.
Key considerations for method selection include:
- Biological question: Individual mechanisms vs. population patterns
- Study species: Size, behavior, and sensitivity to human disturbance
- Spatial and temporal scale: Fine-scale movements vs. landscape-level distribution
- Resource availability: Budget, expertise, and logistical constraints
- Ethical considerations: Handling impacts vs. cultural values [50]
Future advancements will likely focus on integrated approaches that combine both methodologies to leverage their complementary strengths [49]. The ongoing development of multi-sensor platforms [1], standardized data sharing platforms like Biologging intelligent Platform (BiP) [5], and sophisticated analytical frameworks will further enhance our ability to understand and conserve wildlife in rapidly changing environments.
For researchers designing habitat use studies, the most robust approach may involve strategically combining biologging and camera trapping to obtain both individual-and population-level insights, thereby creating a more comprehensive understanding of wildlife ecology.
The paradigm-changing opportunities of bio-logging sensors for ecological research are vast, offering an unprecedented window into the lives of animals [1]. However, a significant challenge remains in bridging the gap between the rich, high-frequency data collected from individual organisms and the broader patterns observed at population, community, and ecosystem levels [55] [56]. The movement of organisms is one of the key mechanisms shaping biodiversity, affecting the distribution of genes, individuals, and species in space and time [55]. While technological advancements have revolutionized our ability to collect detailed movement data, the crucial task of scaling this information up to understand ecological processes has often been hindered by methodological and conceptual gaps [1] [56]. This whitepaper outlines an integrated framework, building upon the concept of an Integrated Bio-logging Framework (IBF), to explicitly connect individual movement data with population-level and ecosystem processes [1]. By synthesizing recent technological advancements, analytical approaches, and theoretical foundations, we provide a comprehensive guide for researchers seeking to understand the mechanistic links between animal movement and broader ecological dynamics.
Theoretical Foundations: Connecting Scales of Biological Organization
The Movement Ecology Framework
The conceptual framework for movement ecology introduced by Nathan et al. (2008) provides a foundational structure for understanding individual movement. This framework distinguishes between three basic components related to the focal individual—internal state, motion capacity, and navigation capacity—that are affected by various external factors, with the resulting movement path feeding back to the internal and external components [55]. This individual-based framework serves as the essential starting point for any scaling exercise, as it encapsulates the fundamental drivers and mechanisms of movement.
Mobile Links and Biodiversity Dynamics
To extend the individual-based movement framework to population and ecosystem levels, the concept of "mobile links" is essential [55]. Mobile links describe how moving animals connect otherwise separate communities and ecosystems. These links can be categorized by their primary functions:
- Resource Links: Movement that transports nutrients, energy, or other physical resources across ecosystem boundaries (e.g., anadromous fish transporting marine-derived nutrients to freshwater systems).
- Genetic Links: Movement that facilitates gene flow between populations, affecting genetic structure and evolutionary trajectories.
- Process Links: Movement that modifies ecological processes such as herbivory, predation, or seed dispersal across spatial scales.
The impact of these mobile links varies significantly depending on the type of movement involved—foraging, dispersal, or migration—each operating at different spatiotemporal scales and having differential effects on biodiversity [55].
Movement Types and Their Ecological Impacts
Table: Ecological Impacts of Different Movement Types
| Movement Type | Spatiotemporal Scale | Primary Ecological Impacts | Examples |
|---|---|---|---|
| Foraging | Frequent, within home range, daily cycles | Vegetation structure, nutrient distribution, prey populations | Grazing heterogeneity affecting plant communities [55] |
| Dispersal | Intermediate, between reproductive events | Gene flow, population connectivity, meta-population dynamics | Avoidance of kin competition, bet-hedging in stochastic environments [55] |
| Migration | Large-scale, seasonal, regular intervals | Resource redistribution, nutrient subsidies, disease transport | Snow geese providing allochthonous resources to Arctic foxes [55] |
The Integrated Bio-logging Framework (IBF)
The Integrated Bio-logging Framework (IBF) connects four critical areas for optimal study design—questions, sensors, data, and analysis—through a cycle of feedback loops, linked by multi-disciplinary collaboration [1]. The IBF provides a structured approach for researchers to develop study designs that effectively bridge individual movement data with population-level processes.
Framework Components and Workflow
The diagram below illustrates the core structure and workflow of the Integrated Bio-logging Framework:
From Questions to Sensors: Matching Technology to Research Objectives
The first critical node in the IBF involves matching appropriate bio-logging sensors to specific biological questions. The ever-increasing variety of sensors available requires careful selection to ensure data collection aligns with research objectives [1].
Table: Sensor Selection Guide for Scaling Individual Data to Population Processes
| Sensor Type | Data Collected | Relevant Population/Ecosystem Questions | Optimization Considerations |
|---|---|---|---|
| Location (GPS, ARGOS) | Animal positions over time | Space use, habitat selection, meta-population connectivity | Use in combination with behavioural sensors; create visualizations to interpret space use [1] |
| Intrinsic (Accelerometer, Magnetometer, Gyroscope) | Body posture, dynamic movement, orientation | Behavioural identification, energy expenditure, activity budgets | Use in combination with other sensors; increase sensitivity for micro-movements [1] |
| Environmental (Temperature, Salinity) | Ambient conditions | Habitat suitability, species distributions, responses to environmental change | In situ remote sensing; arrays to localize animals [1] |
| Physiological (Heart Rate, Temperature Loggers) | Internal state metrics | Energetics, stress responses, reproductive status | Calibration required for ecological interpretation [1] |
Multi-sensor approaches represent a new frontier in bio-logging, as the combined use of multiple sensors can provide indices of internal state, reveal intraspecific interactions, reconstruct fine-scale movements, and measure local environmental conditions [1]. For example, combining GPS with accelerometers and environmental sensors enables researchers to not only track where animals move but also understand why they move, how they interact with their environment, and what energetic consequences these movements have.
Methodological Approaches: From Data Collection to Population Inference
Experimental Protocols for Multi-Scale Movement Studies
Protocol 1: Environmental Inference from Multivariate Movement Data
Recent advancements propose a data-driven analytic framework to quantify environmental influence on animal movement that accommodates the multifaceted nature of movement data [39]. Instead of fitting simplified movement descriptors to environmental variables, this approach centers on predicting environmental variables from the full set of multivariate movement data.
Procedure:
- Data Collection: Deploy multi-sensor bio-loggers (e.g., GPS, accelerometers, magnetometers) on study subjects. Collect concurrent environmental data (e.g., resource availability, weather conditions).
- Feature Extraction: Extract comprehensive movement variables from raw sensor data, including:
- Movement trajectory descriptors (speed, turning angles, path tortuosity)
- Body movement metrics from accelerometers (dynamic body acceleration, posture)
- Derived activity classifications (foraging, resting, traveling)
- Model Training: Use machine learning algorithms (e.g., Random Forest, Support Vector Regression) to predict environmental variables from movement features using a training dataset.
- Model Validation: Predict environmental variables on a separate test dataset from a different temporal range to avoid autocorrelation issues.
- Inference: Use the coefficient of determination (R²) between predicted and measured environmental variables to quantify how much environmental variation influences animal movement.
This protocol demonstrated that 37% of variation in grass availability and 33% of time since milking influenced cow movements on a one-hour timescale, with different movement features responding to different environmental factors [39].
Protocol 2: Dead-Reckoning for Fine-Scale Movement Reconstruction
A key limitation of telemetry devices is that transmission technology can fail in certain conditions. Dead-reckoning procedures combine inertial measurement units (IMUs) and elevation/depth recording sensors to reconstruct animal movements in 2D and 3D irrespective of transmission conditions [1].
Procedure:
- Sensor Deployment: Equip animals with IMUs (accelerometers, magnetometers, gyroscopes) and pressure sensors for depth/altitude.
- Data Collection: Collect high-frequency data on:
- Speed (using speed-dependent dynamic body acceleration for terrestrial animals)
- Animal heading (from magnetometer data)
- Change in altitude/depth (from pressure data)
- Path Reconstruction: Calculate successive movement vectors from speed, heading, and depth/altitude change.
- Ground-Truthing: Use periodic GPS fixes or known location points to correct for cumulative errors in dead-reckoning.
- Integration: Combine fine-scale movement paths with environmental layers and population data.
Analytical Frameworks for Population-Level Inference
Spatial Population Models
Several modeling approaches enable researchers to scale individual movement data to population-level processes:
- Reaction-Diffusion Models: Assume individuals move at random over large, homogeneous areas, dying and producing offspring according to rates that depend linearly on local population density. Useful for describing population invasion and range expansion [56].
- Integro-Difference Equations: Combine a redistribution kernel (describing probability of movement between locations) with local population growth. Particularly valuable for understanding effects of dispersal on invasion speed [56].
- Moment Closure and Pair Approximations: Describe probability distributions of statistical ensembles of populations, accounting for discrete nature of individuals and stochastic components of births, deaths, and movement. Useful for analyzing spatially realistic models more thoroughly than through simulation alone [56].
State-Space Modeling and Hidden Markov Models
These approaches are particularly valuable for dealing with imperfect observation and inferring hidden behavioral states from movement data:
- State-Space Models: Separate the ecological process (true movement and behavior) from the observation process (imperfect location data).
- Hidden Markov Models (HMMs): Identify behavioral states from movement characteristics, allowing researchers to connect fine-scale behavior to population-level distribution patterns.
The Scientist's Toolkit: Essential Research Reagents and Technologies
Table: Essential Research Reagents and Technologies for Integrated Movement Studies
| Tool Category | Specific Technologies | Function in Scaling Individual to Population Data | Key Considerations |
|---|---|---|---|
| Bio-logging Sensors | GPS, Accelerometers, Magnetometers, Gyroscopes, Depth Sensors | Collect high-resolution movement and behavioral data from individual animals | Power requirements, memory capacity, attachment methods, sensor calibration [1] |
| Environmental Monitoring | Remote Sensing Data, Weather Stations, Habitat Mapping | Provide context for movement decisions and connections to ecosystem processes | Spatial and temporal resolution matching movement data [39] |
| Machine Learning Algorithms | Random Forest, Support Vector Machines, Neural Networks | Analyze complex multivariate movement data and predict environmental influences | Training/validation data requirements, computational resources, interpretability [39] |
| Spatial Analysis Tools | GIS Software, R/Python Spatial Packages | Analyze movement paths in relation to environmental variables and population distributions | Data integration capabilities, statistical functionality [56] |
| Population Modeling Frameworks | Reaction-Diffusion, Integro-Difference, Individual-Based Models | Scale individual movement rules to population-level distributions and dynamics | Computational efficiency, biological realism, analytical tractability [56] |
Data Management and Visualization Strategies
Tackling the Big Data Challenge
The bio-logging revolution presents significant challenges in data management, exploration, and visualization. Taking advantage of this revolution requires:
- Efficient Data Exploration: Developing tools and methods for quickly summarizing and understanding complex, high-frequency multivariate data.
- Advanced Visualization: Implementing multi-dimensional visualization methods to represent complex movement paths, associated sensor data, and environmental contexts.
- Appropriate Archiving and Sharing: Establishing standards and protocols for archiving and sharing bio-logging data to facilitate multi-study comparisons and meta-analyses [1].
Visualizing Cross-Scale Relationships
The following diagram illustrates the conceptual relationships between individual movement data and population-level processes:
Case Studies: Successful Integration of Movement Data with Population Processes
Machine Learning for Environmental Inference
A recent study demonstrated the power of machine learning approaches to quantify environmental influence on animal movement [39]. Researchers tracked eight dairy cows with GPS and accelerometers while simultaneously measuring grass availability, time since milking, and wind speed. By predicting environmental variables from multivariate movement data using Random Forest algorithms, they quantified that 37% of variation in grass availability and 33% of time since milking was reflected in cow movement patterns. This approach proved insensitive to spurious correlations between environmental variables and provided insights into which specific movement features (neck movement during grazing, landscape-scale movement patterns) were most influenced by different environmental factors.
Mobile Links and Biodiversity Dynamics
Research on the three main movement types—foraging, dispersal, and migration—has revealed their distinct impacts on biodiversity across different spatiotemporal scales [55]:
- Foraging Movements: Cattle, pony, and deer movements affect both sward height and vegetation composition through nutrient concentration in latrines, demonstrating how individual foraging decisions scale up to influence plant community structure [55].
- Dispersal Movements: Dispersal has profound impacts on genetic structure of populations through gene flow, while also linking populations through disease transmission, movement of mutualistic endosymbionts, and nutrient subsidies across ecosystem boundaries [55].
- Migratory Movements: Migratory animals like snow geese provide allochthonous resources to Arctic foxes, creating reproductive responses that demonstrate how individual migration decisions influence predator population dynamics [55].
The integration of individual movement data with population-level and ecosystem processes represents one of the most promising frontiers in movement ecology. Taking full advantage of the bio-logging revolution will require:
- Theoretical and Mathematical Advancements: Developing the theoretical and mathematical foundations of movement ecology to include rich sets of high-frequency multivariate data [1].
- Multi-Disciplinary Collaborations: Establishing robust collaborations between ecologists, statisticians, computer scientists, engineers, and mathematical biologists to catalyze opportunities offered by current and future bio-logging technology [1].
- Improved Analytical Methods: Creating new analytical methods that can properly handle the complexities of bio-logging data, particularly for scaling individual processes to population levels [1] [56].
- Enhanced Data Infrastructure: Building infrastructure for storing, sharing, and analyzing large, complex bio-logging datasets across research groups and disciplines.
If these advances are achieved, clear potential exists for developing a vastly improved mechanistic understanding of animal movements and their roles in ecological processes, and for building realistic predictive models to address pressing conservation and management challenges in an era of global environmental change [1]. The Integrated Bio-logging Framework provides a structured approach for navigating this complex but rewarding research landscape, enabling researchers to effectively scale from individual movements to the ecological processes that shape our planet's biodiversity.
The paradigm-changing opportunities of bio-logging sensors are revolutionizing ecological research, particularly movement ecology, by allowing scientists to observe the unobservable [1]. Modern movement ecology requires an integrative approach that links raw movement data to specific ecological functions. This guide articulates this process through an Integrated Bio-logging Framework (IBF) that creates a cyclical feedback loop connecting biological questions, sensor selection, data exploration, and analytical techniques through multi-disciplinary collaboration [1]. The framework addresses the critical challenge of matching appropriate sensors and analytical techniques to specific biological questions, thereby transforming complex multivariate data into quantifiable metrics of ecological function, including animal encounters, seed dispersal patterns, and nutrient flows across landscapes.
The Quantitative Toolkit: Sensors and Metrics for Ecological Functions
Research Reagent Solutions: Essential Tools for Field Research
The following table details key equipment and computational tools required for quantifying movement-driven ecological processes.
Table 1: Essential Research Reagents and Tools for Movement Ecology
| Tool Category | Specific Examples | Primary Function in Quantifying Ecological Function |
|---|---|---|
| Location Sensors | GPS, ARGOS, Acoustic Telemetry Arrays, Geolocators [1] | Precisely tracks animal position in 2D/3D space to map movement paths and identify potential encounter locations or dispersal routes. |
| Intrinsic State Sensors | Accelerometers, Magnetometers, Gyroscopes (often combined as IMUs) [1] | Infers behavior (e.g., foraging, resting), energy expenditure, and internal state, linking movement to functional outcomes like feeding or seed handling. |
| Environmental Sensors | Temperature, Salinity, Microphone, Video Loggers [1] | Measures the physical and biological context of movement, enabling correlation between environment, behavior, and ecological function. |
| Proximity Loggers | Radio Frequency Identification (RFID) Tags [1] | Directly quantifies animal-animal encounters or animal-resource interactions critical for studying social networks or seed dispersal. |
| Data Visualization & Analysis Platforms | Movebank, Biologging intelligent Platform (BiP) [5] [1] | Provides standardized platforms for storing, visualizing, and analyzing complex bio-logging data, facilitating multi-scale and meta-analysis. |
| Theoretical & Analytical Models | State-Space Models, Hidden Markov Models (HMMs), Lévy Flight Analysis [57] [1] | Provides the statistical and mathematical foundation for inferring hidden behavioral states and testing evolutionary hypotheses about movement strategies. |
Quantifying Seed Dispersal as a Strategic Search
Viewing seed dispersal as a strategic search for suitable habitat provides a powerful theoretical lens for quantification. The dispersal strategy of a plant species can be described by its dispersal kernel—the probability distribution of dispersal distances—which can be optimized through evolution to balance trade-offs between finding habitat, avoiding kin competition, and colonizing new patches [57].
Simulation studies using models like the truncated two-dimensional Pareto distribution allow researchers to explore how different dispersal kernels (governed by the scaling exponent μ) perform under various landscape configurations [57]:
[ p(l)=\frac{1}{2\pi}\left[\frac{2-\mu }{{l{max}}^{2-\mu }-{l{min}}^{2-\mu }}\right]{l}^{-\mu } ]
Table 2: Evolved Dispersal Kernels in Different Landscape Types
| Landscape Characteristic | Fragmentation Level | Patch Turnover Dynamics | Selected Dispersal Strategy (μ value) | Ecological Implication |
|---|---|---|---|---|
| Static and Patchy | High | Low | Short-distance dominated (μ > 3) [57] | Favors local colonization and avoids risky long-distance dispersal into unsuitable matrix. |
| Dynamic and Fragmented | Variable | High | Multi-scale strategies (μ ~ 2, Lévy-like) [57] | Optimizes search efficiency across a wide range of scales, balancing local exploitation and long-distance exploration. |
| Uniform and Unpredictable | Low | Very High | Long-distance dominated (μ → 1) [57] | Serves as a bet-hedging strategy to track shifting habitat conditions over large spatial scales. |
Quantifying Animal Encounters and Nutrient Flows
Quantifying encounters requires sensors that detect co-location or direct interaction. Proximity loggers directly record animal-animal encounters, while GPS tags with high temporal resolution can infer them [1]. The resulting data can be transformed into interaction networks, where nodes represent individuals and edges represent recorded encounters. The structure of these networks (e.g., centrality, connectivity) quantifies potential pathways for disease transmission or information transfer.
Nutrient flows, such as the movement of marine-derived nutrients from sea to land by seabirds or anadromous fish, can be quantified by:
- Tracking Vectors: Using GPS or ARGOS tags to map the movement of animals between nutrient source and deposition areas [1].
- Measuring Deposition: Correlating animal presence (from tracking data) with direct chemical measurements of nutrient concentration (e.g., nitrogen, phosphorus) in soils or vegetation at landing, roosting, or breeding sites.
Experimental Protocols and Analytical Workflows
Protocol for Deploying an Integrated Bio-Logging System
Objective: To simultaneously collect data on animal movement, behavior, and environmental context to link movement to ecological function.
Materials: GPS transmitter, tri-axial accelerometer, environmental sensor (e.g., temperature), data storage/transmission unit, appropriate attachment harness, data visualization platform (e.g., BiP or Movebank) [5] [1].
Procedure:
- Sensor Configuration: Program all sensors with a synchronized internal clock. Set GPS to record position at a frequency appropriate to the research question (e.g., every 15 minutes for broad-scale migration, every second for fine-scale foraging). Set accelerometer to a high frequency (e.g., 20-50 Hz) to capture detailed behavior [1].
- Calibration: Calibrate sensors according to manufacturer specifications before deployment. For accelerometers, this may involves recording stationary periods and known orientations.
- Field Deployment: Safely capture and handle the target animal. Securely attach the bio-logger using a species-appropriate method (e.g., harness, collar, glue) designed to minimize impact on the animal's natural behavior. Record deployment metadata: individual ID, species, sex, age, body condition, deployment time and location [5].
- Data Retrieval & Upload: Retrieve the device via recapture or remote data transmission. Download raw data and upload it to a standardized platform like the Biologging intelligent Platform (BiP), ensuring all associated metadata (individual traits, device details, deployment info) is entered using international standards [5].
- Data Processing: Use the platform's tools to standardize data formats and correct for any sensor drift or error.
Protocol for Analyzing Movement to Identify Seed Dispersal
Objective: To reconstruct animal movement paths and identify potential seed dispersal events and distances.
Materials: GPS tracking data, acceleration data, species-specific knowledge of gut passage times, environmental data, GIS software, statistical software (R, Python) [57] [1].
Procedure:
- Path Reconstruction and Cleaning: Use a state-space model (SSM) to filter and interpolate raw GPS data, accounting for measurement error and producing a regularized movement path [1].
- Behavioral Classification: Apply a machine learning classifier or Hidden Markov Model (HMM) to the high-frequency accelerometer data to classify behavior (e.g., foraging, resting, traveling) at each GPS point [1].
- Identifying Foraging Events: Isolate GPS locations classified as "foraging" as potential fruit ingestion sites.
- Modeling Dispersal Kernels: For each foraging location, model a seed shadow. The kernel shape (e.g., Gaussian, negative exponential, Lévy) should be selected based on the animal's movement strategy. For example, a Lévy-like kernel with a scaling exponent (μ) ~2 may be appropriate for species in dynamic landscapes [57]. The gut passage time (GPT) is used to determine the potential displacement between an ingestion site (foraging location) and a deposition site (subsequent location after GPT has elapsed).
- Validation: Ground-truth model predictions by conducting field surveys at predicted deposition sites to look for seeds or seedlings.
Diagram 1: Analysis Workflow for Ecological Function
Visualization and Data Standards
Effective communication of complex movement data requires clear, standardized visualizations. A significant challenge in biological visualizations is the inconsistent use of symbols, particularly arrows, which can have over 70 different meanings in biological literature, creating confusion for students and researchers alike [58]. Illustrators must strive for clarity and consistency, and instructors should explicitly guide students in interpreting these symbols [58].
Adherence to technical visualization standards is equally critical. The WCAG 2.0 Level AAA guidelines require a contrast ratio of at least 4.5:1 for standard text and 3:1 for large-scale text against its background [59] [60] [61]. For graphical objects in charts and diagrams, a minimum 3:1 contrast ratio between adjacent colors is required to ensure that users with low vision or color blindness can distinguish the elements [61].
Diagram 2: Integrated Bio-Logging Framework
The integration of advanced bio-logging technology with a robust theoretical framework enables a mechanistic understanding of how animal movement drives fundamental ecological processes. By following the Integrated Bio-logging Framework—using appropriate sensors to collect multivariate data, analyzing it with models grounded in evolutionary theory like optimized dispersal kernels, and visualizing results with clarity and consistency—researchers can move beyond simply describing movement to truly quantifying its functional consequences. This approach is critical for building predictive models of ecosystem responses to global change, species invasions, and habitat fragmentation, ultimately supporting more effective conservation and management strategies.
Animal movement is a fundamental behavioral trait shaped by the need to find food, locate suitable habitat, avoid predators, and reproduce [62]. The emergence of bio-logging technologies—including high-resolution GPS tracking, accelerometers, and environmental sensors—has produced an unprecedented explosion of movement data, enabling researchers to study movement patterns in greater detail than ever before [37] [1]. However, a significant challenge remains: quantifying how movement patterns and their drivers change across spatiotemporal scales [63]. This technical guide presents a comprehensive framework for multi-scale movement analysis, providing researchers with methodologies to connect fine-scale diel routines to lifetime movement phases for improved ecological forecasting in response to global change.
The central premise of this approach is that animal movement is inherently hierarchical, with distinct but interconnected processes operating at different temporal and spatial scales [62] [63]. Understanding how these scales link mechanistically provides a powerful foundation for predicting how animals may respond to environmental change, from altered daily routines to shifts in seasonal migration patterns and lifetime space use [64].
Theoretical Framework: Hierarchical Path Segmentation
The Integrated Biologging Framework (IBF)
The Integrated Biologging Framework (IBF) offers a structured approach to designing movement ecology studies, connecting biological questions with appropriate sensor technologies, data processing methods, and analytical techniques through an iterative cycle of feedback loops [1]. This framework emphasizes that multi-sensor approaches represent a new frontier in biologging, while also highlighting the importance of multi-disciplinary collaborations to fully leverage the opportunities presented by current and future bio-logging technology [1] [2]. The IBF is particularly valuable for guiding scale-specific study design and ensuring that data collection strategies align with the hierarchical nature of movement processes.
Multi-Scale Movement Segmentation
A hierarchical path-segmentation (HPS) framework provides the conceptual foundation for connecting movement processes across scales (Figure 1) [63] [64]. This framework organizes movement into discrete but interconnected levels:
Figure 1: Hierarchical segmentation of animal movement tracks across spatiotemporal scales
Fundamental Movement Elements (FuMEs)
FuMEs represent elemental biomechanical movements - repeatable sequences of stereotypical body movements such as walking, wing flapping, body undulating, trotting, galloping, and sprinting [64]. These movements are typically executed at rates measured in seconds or fractions of seconds, though in smaller animals and birds, this rate could be measured in centiseconds [64]. When relocation data is insufficient to characterize complete FuME sequences, researchers can derive metaFuMEs - statistical characterizations (average step size, turning angles with standard deviations, and auto-correlations) of homogeneous movement activities that span an order of magnitude longer than the relocation sampling frequency [64].
Canonical Activity Modes (CAMs)
CAMs are behavioral segments dominated by distinctive activities such as resting, foraging, grazing, or directed walking [63] [64]. These represent functionally relevant behaviors that combine FuMEs into ecologically meaningful sequences. CAMs have variable durations, with some lasting only minutes while others persist for several hours [64]. The identification and classification of CAMs enables researchers to connect mechanical movement patterns with behavioral states and ecological functions.
Diel Activity Routines (DARs)
DARs represent complete 24-hour movement sequences and serve as the crucial anchor point in the hierarchical framework due to their fixed duration determined by the earth's rotation [63] [65]. The appropriate start/end time for DAR analysis may vary among species - for nocturnal barn owls, it begins before individuals leave for nocturnal feeding bouts, while for black rhinoceros, a dawn start/end time proves most appropriate [65] [64]. DARs provide a natural temporal unit for comparative analysis across individuals and species, reflecting the circadian rhythms that regulate physiology and behavior in most animals [62].
Lifetime Movement Phases (LiMPs) and Lifetime Tracks (LiTs)
LiMPs represent extended periods with consistent movement patterns, such as seasonal migrations, dispersal events, or residence in particular home ranges [62] [63]. These phases have variable durations, lasting from weeks to months or even years. The complete LiT of an individual represents the entire sequence of movement from birth to death, comprising multiple LiMPs connected through transitional movements [63]. Understanding how DARs assemble into LiMPs and ultimately into LiTs enables forecasting of long-term space use adaptations to environmental change.
Table 1: Hierarchical Scales of Animal Movement Analysis
| Scale | Temporal Duration | Definition | Key Metrics |
|---|---|---|---|
| Fundamental Movement Elements (FuMEs) | Seconds to sub-seconds | Elemental biomechanical movements (walking, wing flapping, etc.) | Body movement sequences, kinematics |
| Canonical Activity Modes (CAMs) | Minutes to hours | Behavioral segments dominated by distinctive activities (foraging, resting, directed travel) | Step length, turning angle, tortuosity, behavioral classification |
| Diel Activity Routines (DARs) | 24-hour fixed period | Complete daily movement sequence anchored by circadian rhythms | Net displacement, maximum diameter, path openness, area covered |
| Lifetime Movement Phases (LiMPs) | Weeks to months | Extended periods with consistent movement patterns (seasonal migration, dispersal, ranging) | Home range size, migration timing and routes, range fidelity |
| Lifetime Track (LiT) | Individual's lifetime | Complete movement sequence from birth to death | Dispersal distance, lifetime range, habitat use patterns |
Methodological Protocols for Multi-Scale Analysis
Data Collection and Sensor Selection
Optimizing sensor selection is crucial for effective multi-scale movement analysis. Following the Integrated Biologging Framework, researchers should match sensor capabilities to specific biological questions across hierarchical scales [1]:
For FuME-level analysis: High-frequency accelerometers (typically ≥10 Hz), magnetometers, and gyroscopes capture detailed biomechanical movements. Multi-sensor packages (IMUs) enable detailed reconstruction of body movements and posture [1].
For CAM-level analysis: Medium to high-frequency GPS (1-30 minute intervals) combined with tri-axial accelerometers (1-10 Hz) allow identification of behavioral states through machine learning classification [1]. Environmental sensors (temperature, humidity) provide context for behavioral switches.
For DAR-level analysis: Regular-interval GPS fixes (5-60 minutes) sufficient to reconstruct daily paths without excessive energy consumption or data storage demands. Sub-hourly or multi-minute frequencies (2-20 points per hour) are recommended for reliable DAR characterization [65].
For LiMP and LiT-level analysis: Long-duration tracking using satellite telemetry (Argos, GPS), geolocators, or acoustic telemetry arrays, often with reduced location frequency but extended battery life to capture seasonal and lifetime patterns [1].
Table 2: Sensor Selection for Multi-Scale Movement Analysis
| Sensor Type | Data Captured | Appropriate Scales | Key Considerations |
|---|---|---|---|
| High-frequency GPS | Position (1-30 second intervals) | CAMs, DARs | Power intensive, limited by canopy cover |
| Accelerometer | Body acceleration, behavior identification | FuMEs, CAMs | High data volume, requires behavior classification |
| Magnetometer | Heading direction | FuMEs, CAMs | Essential for dead-reckoning path reconstruction |
| Environmental sensors | Temperature, humidity, etc. | All scales | Context for movement decisions |
| Satellite transmitters | Position over large scales | LiMPs, LiTs | Lower spatial accuracy, global coverage |
DAR Categorization Protocol
Characterizing DAR geometry provides a powerful approach for comparing daily movement patterns across individuals and populations. The following protocol, adapted from Luisa Vissat et al. (2023), enables robust DAR classification [65]:
Data Preparation: Segment continuous tracking data into 24-hour periods using biologically relevant start/end times specific to the study species. For nocturnal species, begin DARs before evening departure; for diurnal species, dawn often provides appropriate segmentation.
Calculate Whole-Path Metrics: Compute four geometric measurements for each DAR:
- Net displacement: Distance between start and end points
- Maximum displacement: Greatest distance from start point to any location along the path
- Maximum diameter: Largest distance between any two points in the trajectory
- Maximum width: Greatest perpendicular distance from the line connecting start and end points
Cluster Analysis: Apply a Ward clustering algorithm to the standardized whole-path metrics to identify distinct DAR categories. Determine the optimal number of clusters using heuristic approaches that balance variance capture with practical interpretability.
Principal Components Analysis (PCA): Conduct PCA to reduce dimensionality and identify composite factors. PC1 typically represents a "scale factor" capturing overall movement extent, while PC2 often represents an "openness factor" indicating the degree of return to origin.
Spatio-temporal Distribution Analysis: Map the distribution of DAR types across individuals grouped by biological traits (age, sex) and seasonal periods to identify patterns in movement strategy implementation.
Analytical Methods for Scale Integration
Linking movement processes across scales requires specialized analytical approaches:
Hidden Markov Models (HMMs): Identify latent behavioral states from relocation data, connecting FuMEs and CAMs by associating specific movement metrics (step length, turning angle) with behavioral modes [63].
Behavioral Change-Point Analysis (BCPA): Detect structural changes in movement trajectories to segment paths into homogeneous behavioral phases [63].
Multi-Scale Random Walks: Develop hierarchical movement models that simulate processes across scales, incorporating individual-state and environmental covariates to predict emergent space use patterns [63].
Path Segmentation Algorithms: Apply moving window analyses to identify shifts in movement metrics, facilitating the classification of CAMs within DARs [64].
Case Study: Multi-Scale Analysis in Barn Owls
A comprehensive study of barn owls (Tyto alba) in northeastern Israel demonstrates the practical application of hierarchical movement analysis [65]. Researchers utilized reverse-GPS data from an ATLAS tracking system to analyze 6,230 individual DARs from 44 owls, implementing the DAR categorization protocol outlined in Section 3.2.
The analysis revealed seven distinct DAR categories representing different shapes and scales of nightly routines: five closed categories (returning to same roost), one partially open category (returning to nearby roost), and one fully open category (leaving for another region) [65]. Principal Components Analysis showed that PC1 (scale factor) accounted for 86.5% of variation, while PC2 (openness factor) explained an additional 8.4% of variation [65].
Statistical analysis using generalized linear mixed models with PC1 as the dependent variable demonstrated that DARs were significantly larger in young owls than adults, and in males than females [65]. This multi-scale approach enabled researchers to identify idiosyncratic behaviors within family groups and understand how individual differences manifest in daily movement routines with potential consequences for lifetime space use.
The Scientist's Toolkit: Essential Research Solutions
Table 3: Research Reagent Solutions for Multi-Scale Movement Analysis
| Tool/Solution | Function | Application Examples |
|---|---|---|
| Bio-logging Platforms | Standardized data management and sharing | Movebank, Biologging intelligent Platform (BiP) [5] |
| Inertial Measurement Units | Capture FuMEs and metaFuMEs | Accelerometer-magnetometer-gyroscope packages for detailed movement reconstruction [1] |
| ATLAS Reverse-GPS | High-resolution tracking in limited areas | Fine-scale DAR analysis in barn owls [65] |
| Satellite Telemetry | Broad-scale movement monitoring | LiMP and LiT analysis for migratory species [37] |
| Hidden Markov Model Packages | Behavioral state identification | R packages (momentuHMM, moveHMM) for CAM classification [63] |
| Path Segmentation Algorithms | Identify behavioral shifts | Behavioral Change Point Analysis (BCPA) for path segmentation [63] |
| Cluster Analysis Tools | DAR categorization | Ward clustering algorithms for movement type classification [65] |
| Environmental Data Layers | Contextualize movement decisions | Remote sensing data on resource distribution, temperature, human impact [37] |
Applications for Ecological Forecasting
Predicting Responses to Global Change
The hierarchical framework enables mechanistic forecasting of how animals may respond to environmental change by understanding how alterations at finer scales propagate to broader patterns [64]. For example:
Climate change impacts: Understanding how temperature increases alter CAM sequences (e.g., increased resting during heat) enables predictions of how DARs will change, ultimately affecting seasonal range use (LiMPs) and lifetime distribution patterns (LiTs) [64].
Habitat fragmentation: Analyzing how barriers affect FuMEs and CAMs allows predictions of how DARs will be modified, with consequences for dispersal LiMPs and population connectivity across LiTs [37].
Resource shifts: Tracking how changes in resource distribution alter foraging CAMs provides insights into how DARs will be reconfigured, potentially leading to range shifts at LiMP scales [64].
Conservation and Management Applications
Multi-scale movement analysis directly informs conservation by identifying critical behaviors across spatial and temporal domains:
Protected area design: Understanding LiMP patterns reveals seasonal habitat requirements that may extend beyond current protected boundaries [37].
Migration conservation: Identifying critical CAMs and DARs during migratory LiMPs enables targeted protection of stopover sites and movement corridors [37].
Human-wildlife conflict: Analyzing DAR patterns in relation to human infrastructure facilitates prediction and mitigation of conflict hotspots [36].
The multi-scale analysis framework connecting diel routines to lifetime movement phases represents a powerful approach for advancing movement ecology and improving ecological forecasting. By explicitly addressing the hierarchical organization of animal movement and providing methodologies to link processes across scales, this framework enables researchers to move beyond descriptive pattern analysis toward mechanistic understanding and prediction. As biologging technologies continue to evolve and computational methods become more sophisticated, the integration of cross-scale movement processes will play an increasingly vital role in understanding and predicting animal responses to rapid environmental change.
The accelerating biodiversity crisis necessitates innovative approaches to monitor and mitigate anthropogenic impacts on wildlife. Threat mapping emerges as a critical conservation tool, defined as the spatial integration of animal movement data with layers of human activity to quantify exposure and vulnerability. This guide details the technical processes behind this integration, framing it within the broader scope of an Integrated Bio-logging Framework (IBF) for movement ecology research [1]. The core principle is to move beyond simply tracking animal locations and instead create a dynamic, mechanistic understanding of how human pressures directly influence behavior, fitness, and population persistence [18].
Biologging provides the "animal's-eye view" of the world, delivering high-resolution data on movement, behavior, physiology, and even the surrounding environment from sensors attached to animals [5] [18]. These rich, individual-level datasets form one pillar of threat mapping. The second pillar consists of geospatial layers quantifying anthropogenic pressures, such as the Human Modification Index (HM), which integrates multiple stressors including urban areas, crop and pasture lands, mining, road networks, and light pollution [66]. By formally integrating these data streams, researchers can identify collision points between wildlife and human activities, assess the effectiveness of protected areas, and provide a science-based foundation for conservation interventions [37].
Foundational Concepts and Data Requirements
The Integrated Bio-logging Framework (IBF) for Threat Mapping
The IBF provides a structured cycle for designing threat-mapping studies, connecting biological questions with appropriate sensor technology, data management, and analytical techniques through multi-disciplinary collaboration [1]. For threat mapping, the framework ensures that the biologging data collected is precisely matched to the anthropogenic layers it will be integrated with, both spatially and temporally.
- Question to Sensors: The specific conservation threat being investigated dictates the choice of biologging sensors and the required resolution of anthropogenic data. For example, studying vehicle collision risk requires high-resolution GPS data integrated with detailed road network layers, while investigating the impacts of light pollution may involve light-level geolocators and remote-sensing data on night-time illumination [1].
- Sensors to Data: Modern biologgers are multi-sensor platforms. Beyond location, sensors can record three-dimensional acceleration (for behavior and energy expenditure), audio (to detect gunshots or construction), and environmental parameters like temperature and salinity [5] [1]. This multivariate data provides context for why an animal might be vulnerable in a specific location.
- Data to Analysis: The complex, high-dimensional data from biologging requires advanced analytical techniques for visualization, pattern recognition, and model fitting to properly link animal movement to threat layers [1].
Core Components of a Threat Mapping System
A robust threat mapping system is built on three core data components, which must be standardized to be interoperable.
Table 1: Core Data Components for Threat Mapping
| Component | Description | Example Sources & Standards |
|---|---|---|
| 1. Biologging Data | Animal-borne sensor data including location, behavior, and physiology. | GPS/Argos locations, acceleration (for behavior), body temperature, heart rate [18] [1]. |
| 2. Animal Metadata | Standardized information about the tracked animal and deployment. | Species, sex, body size, breeding status; device details; deployment location and time [5]. |
| 3. Anthropogenic Impact Layers | Geospatial data quantifying human pressures on the environment. | Human Modification Index [66], shipping traffic, fishing effort, oil/gas infrastructure, light pollution [37]. |
The Biologging intelligent Platform (BiP) exemplifies the move towards standardizing both sensor data and associated metadata using international standards like the Integrated Taxonomic Information System (ITIS) and Climate and Forecast Metadata Conventions [5]. This standardization is crucial for collaborative projects and meta-analyses that pool data from multiple studies to assess threats at a population or species level [5].
Methodological Workflow: From Data Collection to Integration
The following workflow provides a step-by-step protocol for conducting a threat mapping analysis.
Data Acquisition and Pre-processing
Step 1: Biologging Data Collection Select and deploy biologging devices that balance battery life, sensor suite, data resolution, and device weight to address the specific biological question [1]. For instance, a study on cumulative threat exposure for migratory marine megafauna used satellite telemetry tracks from 484 individuals across six species [37]. Pre-processing includes filtering location data for errors and calibrating sensors.
Step 2: Anthropogenic Data Compilation Compile relevant, co-registered geospatial layers for all anthropogenic pressures of interest. The Human Modification Index is a key dataset that integrates 14 stressors, including urban areas, agriculture, mining, roads, and electrical infrastructure [66]. Other critical layers include shipping traffic density, fishing effort, and light pollution maps.
Step 3: Behavioral Annotation from Biologging Data Use biologging data to classify animal behavior, which is essential for understanding the context of threat exposure. Accelerometer data is particularly valuable for identifying behaviors like foraging, resting, and traveling using machine learning classifiers [1]. For example, recursive movement patterns in GPS data can identify nesting or denning sites [18].
Spatio-temporal Data Integration and Analysis
Step 4: Spatial Overlay and Exposure Quantification Spatially overlay the animal movement trajectories (with annotated behaviors) with the compiled anthropogenic impact layers in a Geographic Information System. This allows for the calculation of cumulative exposure scores, quantifying how much and what types of human pressures an individual animal encounters throughout its movement path [37]. A study in north-western Australia used this method to reveal that high-risk zones, though making up less than 14% of the tracked area, represented critical hotspots of threat overlap for multiple species [37].
Step 5: Modeling Impacts on Fitness and Demography The ultimate goal is to link threat exposure to individual fitness and population-level parameters. This involves modeling how measured exposure influences:
- Survival: Identifying mortality events and their causes (e.g., poisoning, collision) from tracking data [18].
- Reproduction: Detecting reproductive attempts and success through movement patterns (e.g., central-place foraging) [18].
- Energetics: Using accelerometer-derived metrics like Dynamic Body Acceleration to estimate energy expenditure in different anthropogenic landscapes [18].
Table 2: A Scientist's Toolkit for Threat Mapping
| Tool Category | Specific Tool / Reagent | Function in Threat Mapping |
|---|---|---|
| Biologging Platforms | GPS/Argos Satellite Tags | Provides core location data for movement trajectories. |
| Tri-axial Accelerometers | Classifies behavior (e.g., foraging, flight) and estimates energy expenditure. | |
| Environmental Sensors (Temp, Salinity) | Records in-situ environmental conditions animals experience. | |
| Analysis Platforms | MoveApps | A no-code, cloud-based platform for building reproducible analysis workflows for tracking data [67]. |
| Biologging intelligent Platform (BiP) | Standardizes and stores biologging data and metadata, includes Online Analytical Processing tools [5]. | |
| Anthropogenic Data | Global Human Modification (HM) Index | A comprehensive, high-resolution raster dataset of human pressure on terrestrial ecosystems [66]. |
| Global Fishing Watch / Ship Traffic Data | Provides dynamic data on vessel-based ocean threats. |
Visualizing the Workflow and Analytical Logic
The following diagram illustrates the integrated, cyclical process of a threat mapping study, from concept to conservation action.
Advanced Analytical Techniques and Tools
Analytical Platforms and Computational Tools
Making threat mapping accessible and reproducible requires robust computational tools. MoveApps is a serverless, no-code analysis platform that allows researchers to design and share analytical workflows for animal tracking data [67]. Users can build workflows from modular Apps to perform tasks like data cleaning, behavioral segmentation, and spatial analysis without advanced coding skills, promoting transparency and reproducibility.
For more standardized storage and analysis, the Biologging intelligent Platform (BiP) not only stores sensor data and metadata but also includes Online Analytical Processing (OLAP) tools. These tools can calculate environmental parameters, such as surface currents and ocean winds, from the data collected by the animals themselves, effectively turning animals into environmental sentinels [5].
Quantifying Vulnerability and Cumulative Impacts
The analytical goal is to move beyond simple overlap to a mechanistic understanding of vulnerability. This involves:
- Hierarchical Movement Analysis: Frameworks that partition an individual's trajectory into a nested hierarchy of behavioral modes (e.g., foraging, commuting) and larger-scale phases (e.g., migration) can reveal how threats impact different life history stages [37].
- Cumulative Threat Assessment: As demonstrated by Ferreira et al., overlaying movement data from multiple species with maps of various anthropogenic threats allows for the identification of multi-species hotspots where cumulative exposure is highest [37]. This prioritizes areas where conservation action would have the greatest benefit.
- Counterfactual Analysis: To assess the effectiveness of Protected Areas (PAs), a framework incorporating both the current intensity of human pressures and their temporal changes within PAs, compared to matched unprotected areas, provides a more thorough assessment of anthropogenic vulnerability [66].
Case Study Application: Migratory Marine Megafauna
A seminal study by Ferreira et al. (cited in [37]) effectively demonstrates the threat mapping workflow. Researchers compiled satellite-telemetry tracks from 484 individuals across six marine megafauna species (sea turtles, humpback whales, blue whales, whale sharks, and tiger sharks) in north-western Australia.
- Data Integration: The animal movement paths were spatially overlaid with multiple anthropogenic threat layers, including coastal development, shipping traffic, fishing effort, and underwater noise.
- Result: The analysis revealed distinct hotspots of cumulative threat exposure near the Ningaloo and Pilbara regions, where critical habitats (e.g., turtle nesting sites, whale migration corridors) coincided with intensive industrial and maritime activity. A key finding was that while high-risk zones constituted a small portion (<14%) of the total tracked area, no species was entirely free from human influence.
- Conservation Outcome: This multi-species, data-driven assessment provides concrete guidance for mitigation strategies, such as adjusting shipping lanes to reduce vessel strikes or strategically expanding marine protected areas to cover identified hotspots [37].
The field of threat mapping is rapidly evolving. Future directions include addressing the current geographic and taxonomic biases in biologging studies, which are often concentrated in sparsely populated areas and on larger species, leaving significant gaps in the Global South and for smaller organisms [18]. Technological advances in software-defined tracking will soon provide real-time information on energy budgets, reproduction, and survival, enabling near real-time conservation interventions [18]. Finally, major advances are required in the theoretical and mathematical foundations of movement ecology to fully leverage the rich, high-frequency multivariate data generated by modern biologging [1].
In conclusion, the integration of biologging data with anthropogenic impact layers represents a powerful paradigm shift in conservation science. It transforms animal movement paths from mere descriptive lines on a map into dynamic narratives of how wildlife perceives and responds to a human-dominated world. By following the structured workflows and leveraging the growing toolkit of platforms and sensors outlined in this guide, researchers can generate the robust, mechanistic evidence needed to design effective conservation strategies and safeguard biodiversity in the Anthropocene.
Conclusion
Integrated biologging frameworks represent a paradigm shift in movement ecology, transforming vast, complex data streams into a mechanistic understanding of animal behavior, ecology, and conservation. The synthesis of foundational principles, advanced methodologies, and robust validation confirms that a structured, question-driven approach is essential for leveraging the full potential of biologging technology. Key takeaways include the power of multi-sensor packages and HMMs to reveal hidden behavioral states, the critical importance of data standardization and sharing platforms for collaborative science, and the demonstrated value of biologging as a direct reporting tool for conservation impact. Future progress hinges on technological miniaturization, equitable global access to technology, and continued development of theoretical and mathematical models capable of analyzing high-frequency, multivariate data. By closing the loop between data collection, analysis, and application, integrated biologging frameworks will increasingly enable researchers to forecast species' responses to global change and design effective, evidence-based conservation strategies.
References
- 1. Optimising the use of bio-loggers for movement ecology ... [https://pmc.ncbi.nlm.nih.gov/articles/PMC7041970/]
- 2. Optimizing the use of biologgers for movement ecology ... [https://research-portal.st-andrews.ac.uk/en/publications/optimizing-the-use-of-biologgers-for-movement-ecology-research]
- 3. Development of a multisensor biologging collar and ... [https://pmc.ncbi.nlm.nih.gov/articles/PMC11420106/]
- 4. Advances in biologging can identify nuanced energetic costs ... [https://movementecologyjournal.biomedcentral.com/articles/10.1186/s40462-024-00448-y]
- 5. Biologging intelligent Platform (BiP): an integrated and ... [https://movementecologyjournal.biomedcentral.com/articles/10.1186/s40462-025-00551-8]
- 6. Analysis of local habitat selection and large-scale attraction ... [https://movementecologyjournal.biomedcentral.com/articles/10.1186/s40462-021-00260-y]
- 7. Estimating the movements of terrestrial animal populations ... [https://movementecologyjournal.biomedcentral.com/articles/10.1186/s40462-021-00294-2]
- 8. Hidden Markov Model (HMM) Tutorial [http://practicalcryptography.com/miscellaneous/machine-learning/hidden-markov-model-hmm-tutorial/]
- 9. A hidden Markov movement model for rapidly identifying ... [https://pmc.ncbi.nlm.nih.gov/articles/PMC5383489/]
- 10. Animal behaviour on the move: the use of auxiliary information ... [https://movementecologyjournal.biomedcentral.com/articles/10.1186/s40462-023-00401-5]
- 11. Flexible hidden Markov models for behaviour-dependent ... [https://movementecologyjournal.biomedcentral.com/articles/10.1186/s40462-023-00392-3]
- 12. Hidden Markov models identify major movement modes in ... [https://movementecologyjournal.biomedcentral.com/articles/10.1186/s40462-021-00243-z]
- 13. Dead-reckoning facilitates determination of activity and habitat ... [https://animalbiotelemetry.biomedcentral.com/articles/10.1186/s40317-024-00383-0]
- 14. Dead Reckoning - an overview | ScienceDirect Topics [https://www.sciencedirect.com/topics/computer-science/dead-reckoning]
- 15. animal behaviour recognition using magnetometers [https://movementecologyjournal.biomedcentral.com/articles/10.1186/s40462-019-0172-6]
- 16. Dead reckoning [https://en.wikipedia.org/wiki/Dead_reckoning]
- 17. Vector Graph Assisted Pedestrian Dead Reckoning Using ... [https://pmc.ncbi.nlm.nih.gov/articles/PMC4435204/]
- 18. From biologging to conservation: Tracking individual ... [https://pmc.ncbi.nlm.nih.gov/articles/PMC12337290/]
- 19. White stork movements reveal the ecological connectivity ... [https://movementecologyjournal.biomedcentral.com/articles/10.1186/s40462-023-00380-7]
- 20. Accelerometry predicts daily energy expenditure in a bird ... [https://pmc.ncbi.nlm.nih.gov/articles/PMC3565507/]
- 21. Acceleration predicts energy expenditure in a fat, flightless, ... [https://www.nature.com/articles/s41598-020-78025-7]
- 22. Early Post-Fledging Mortality and Causes of Death in White [https://bioone.org/journalArticle/Download?urlid=10.3161%2F104.062.0403]
- 23. Determination of nest occupation and breeding effect of the ... [https://pmc.ncbi.nlm.nih.gov/articles/PMC7024061/]
- 24. Transforming conservation with real-time data of individual ... [https://ourenvironment.berkeley.edu/news/transforming-conservation-real-time-data-individual-animals]
- 25. Integrating Biologging and Behavioral State Modeling to ... [https://www.frontiersin.org/journals/marine-science/articles/10.3389/fmars.2021.791185/full]
- 26. Capture Response and Long-Term Fate of White Sharks ... [https://www.mdpi.com/2079-7737/12/10/1329]
- 27. An electrophysiological correlate of sleep in a shark - PMC [https://pmc.ncbi.nlm.nih.gov/articles/PMC11579818/]
- 28. A brief introduction to the analysis of time-series data from ... [https://pmc.ncbi.nlm.nih.gov/articles/PMC8237163/]
- 29. 5 Visualizing big data - Okan Bulut [https://okanbulut.github.io/bigdata/visualizing-big-data.html]
- 30. Techniques for Handling and Displaying Large Data Sets [https://medium.com/plumbersofdatascience/visualizing-big-data-techniques-for-handling-and-displaying-large-data-sets-84839c493202]
- 31. Decoding wildlife movement to predict the next pandemic [https://www.eurekalert.org/news-releases/1098333]
- 32. Movebank Data Repository [https://www.movebank.org/cms/movebank-content/data-repository]
- 33. Movebank [https://www.movebank.org/cms/movebank-content/archiving-biodiversity]
- 34. A benchmark for computational analysis of animal behavior ... [https://movementecologyjournal.biomedcentral.com/articles/10.1186/s40462-024-00511-8]
- 35. Closing the knowledge‐action gap in conservation with open ... [https://pmc.ncbi.nlm.nih.gov/articles/PMC9300006/]
- 36. Using wild-animal tracking for detecting and managing ... [https://www.sciencedirect.com/science/article/abs/pii/S0169534725001351]
- 37. Editorial: Advances in modelling and analysis of animal ... [https://www.frontiersin.org/journals/ecology-and-evolution/articles/10.3389/fevo.2025.1655346/full]
- 38. Integrating space, time, and culture in animal conservation ... [https://pubmed.ncbi.nlm.nih.gov/41244746/]
- 39. Inferring an animal's environment through biologging [https://movementecologyjournal.biomedcentral.com/articles/10.1186/s40462-020-00228-4]
- 40. The global human impact on biodiversity [https://www.nature.com/articles/s41586-025-08752-2]
- 41. Optimizing the use of biologgers for movement ecology research - Archive ouverte HAL [https://hal.science/hal-02337189]
- 42. Novel application of a quantitative spatial comparison tool ... [https://www.sciencedirect.com/science/article/pii/S1470160X16302990]
- 43. Biologging as a potential platform for resolving ocean ... [https://www.sciencedirect.com/science/article/pii/S2772735125000265]
- 44. Considering landscape heterogeneity improves the inference ... [https://movementecologyjournal.biomedcentral.com/articles/10.1186/s40462-025-00567-0]
- 45. An introduction to statistical models used to characterize ... [https://movementecologyjournal.biomedcentral.com/articles/10.1186/s40462-025-00549-2]
- 46. The ultimate guide to functional data analysis (FDA) for ... [https://www.jmp.com/en/analytics-in-practice/functional-data-analysis]
- 47. Basics of Sensor Data Analysis [https://medium.com/@maizi5469/basics-of-sensor-data-analysis-f82425dd8184]
- 48. Evaluating Contributions of Recent Tracking-Based Animal ... [https://www.frontiersin.org/journals/ecology-and-evolution/articles/10.3389/fevo.2019.00519/full]
- 49. The method matters. A comparative study of biologging ... [https://www.sciencedirect.com/science/article/abs/pii/S0048969723046788]
- 50. Using data from camera traps and autonomous recording ... [https://ace-eco.org/vol20/iss2/art11/]
- 51. Camera trap data reveals the habitat use and activity ... [https://wildlife-biodiversity.com/index.php/jwb/article/view/202]
- 52. Chapter 10 Habitat use | An Introduction to Camera Trap ... [https://bookdown.org/c_w_beirne/wildCo-Data-Analysis/habitat-use.html]
- 53. The method matters. A comparative study of biologging ... [https://pubmed.ncbi.nlm.nih.gov/37543342/]
- 54. Are we telling the same story? Comparing inferences made ... [https://www.scilit.com/publications/b26bdae971c1f77e7d49507a19c2d3ad]
- 55. Integrating movement ecology with biodiversity research [https://movementecologyjournal.biomedcentral.com/articles/10.1186/2051-3933-1-6]
- 56. Building the bridge between animal movement and population ... [https://pmc.ncbi.nlm.nih.gov/articles/PMC2894961/]
- 57. Seed dispersal as a search strategy: dynamic and fragmented ... [https://movementecologyjournal.biomedcentral.com/articles/10.1186/s40462-020-00239-1]
- 58. Arrows in Biology: Lack of Clarity and Consistency Points to ... [https://pmc.ncbi.nlm.nih.gov/articles/PMC6007777/]
- 59. Text has enhanced contrast | ACT Rule | WAI [https://www.w3.org/WAI/standards-guidelines/act/rules/09o5cg/]
- 60. Text has enhanced contrast - Rules - Siteimprove [https://alfa.siteimprove.com/rules/sia-r66]
- 61. Color contrast accessibility requirements explained [https://blog.pope.tech/2022/11/08/color-contrast-accessibility-requirements-explained/]
- 62. Multi-scale movement syndromes for comparative analyses of ... [https://movementecologyjournal.biomedcentral.com/articles/10.1186/s40462-022-00365-y]
- 63. A hierarchical path-segmentation movement ecology framework [https://ecologicalprocesses.springeropen.com/articles/10.1186/s13717-022-00399-5]
- 64. An animal movement track segmentation framework for ... [https://www.frontiersin.org/journals/ecology-and-evolution/articles/10.3389/fevo.2023.1171169/full]
- 65. Categorizing the geometry of animal diel movement patterns ... [https://pmc.ncbi.nlm.nih.gov/articles/PMC10029274/]
- 66. Anthropogenic vulnerability assessment of global terrestrial ... [https://www.sciencedirect.com/science/article/abs/pii/S0006320723001659]
- 67. MoveApps: a serverless no-code analysis platform for animal ... [https://movementecologyjournal.biomedcentral.com/articles/10.1186/s40462-022-00327-4]