A Practical Guide to the Analytical Hierarchy Process for Ecosystem Service Weighting and Decision-Making
This article provides a comprehensive guide for researchers and environmental professionals on applying the Analytical Hierarchy Process (AHP) to weight and prioritize ecosystem services.
A Practical Guide to the Analytical Hierarchy Process for Ecosystem Service Weighting and Decision-Making
Abstract
This article provides a comprehensive guide for researchers and environmental professionals on applying the Analytical Hierarchy Process (AHP) to weight and prioritize ecosystem services. Covering foundational principles to advanced applications, it details the step-by-step methodology for structuring decision hierarchies, conducting pairwise comparisons, and calculating criterion weights. The content addresses common implementation challenges, consistency verification, and strategies for integrating AHP with other decision-support frameworks like Multi-Criteria Decision Analysis (MCDA). Through case studies from forest management, urban planning, and agricultural trade-offs, it demonstrates AHP's practical utility in balancing diverse stakeholder interests and optimizing environmental management strategies for sustainable outcomes.
Understanding AHP Fundamentals for Ecosystem Service Valuation
Historical Development
The Analytic Hierarchy Process (AHP) is a structured decision-making framework developed by Thomas Saaty in the 1970s at the Wharton School of the University of Pennsylvania [1] [2] [3]. Originally created to organize and analyze complex decisions, AHP has since evolved into one of the most widely used multi-criteria decision analysis (MCDA) methods across diverse fields including business, government, engineering, healthcare, and environmental management [1] [2] [3].
AHP emerged as a response to the need for systematic approaches to decision-making that could incorporate both quantitative and qualitative factors while accounting for human judgment [2] [4]. Saaty's fundamental insight was that complex decisions could be broken down into hierarchical structures and evaluated through systematic pairwise comparisons [1] [3]. The method gained significant traction after Saaty partnered with Ernest Forman to develop Expert Choice software in 1983, making the computational aspects more accessible to practitioners [3].
Since its inception, AHP has been extensively studied and refined, with biennial International Symposiums on the Analytic Hierarchy Process (ISAHP) facilitating ongoing methodological development and knowledge exchange among academics and practitioners worldwide [3]. The method's versatility has led to applications ranging from project portfolio selection and strategic planning to ecosystem service valuation and healthcare decision-making [2] [5] [4].
Core Principles of AHP
Hierarchical Decomposition
The foundational principle of AHP is hierarchical decomposition, which involves breaking down complex decision problems into progressively more manageable components [1] [2] [3]. A typical AHP hierarchy consists of at least three levels:
- Level 1: The overarching decision goal
- Level 2: Criteria (and potentially sub-criteria) for evaluating alternatives
- Level 3: The decision alternatives being considered [1]
This hierarchical structure enables decision-makers to focus on one set of comparisons at a time, reducing cognitive load and ensuring systematic evaluation of all decision elements [3].
Pairwise Comparisons and Saaty's Scale
AHP uses pairwise comparisons to derive weights and priorities through a structured evaluation process [1] [2]. Decision-makers compare elements at each hierarchical level against each other based on their relative importance or preference. These comparisons are quantified using Saaty's 1-9 scale of relative importance [2] [4]:
Table: Saaty's Fundamental Scale of Pairwise Comparisons
| Intensity of Importance | Definition | Explanation |
|---|---|---|
| 1 | Equal importance | Two activities contribute equally to the objective |
| 3 | Moderate importance | Experience and judgment slightly favor one activity over another |
| 5 | Strong importance | Experience and judgment strongly favor one activity over another |
| 7 | Very strong importance | An activity is favored very strongly over another |
| 9 | Extreme importance | The evidence favoring one activity over another is of the highest possible order of affirmation |
| 2, 4, 6, 8 | Intermediate values | Used when compromise is needed |
Reciprocals (1/2, 1/3, ..., 1/9) are used when the second element is preferred over the first [1] [4].
Mathematical Foundation
The pairwise comparisons are organized into a comparison matrix, and priority vectors are derived using eigenvalue calculations [1] [2] [6]. The principal eigenvector of the pairwise comparison matrix represents the relative priorities of the compared elements [2] [5]. This mathematical foundation allows AHP to transform subjective judgments into quantitative values that can be synthesized across the entire hierarchy [3].
Consistency Measurement
AHP incorporates mechanisms to check the logical consistency of judgments through the Consistency Ratio (CR) [2] [7] [6]. A CR ≤ 0.10 is generally considered acceptable, indicating that the pairwise comparisons are sufficiently consistent [7] [6]. Higher consistency ratios suggest potential inconsistencies that may require revisiting the judgments [2].
AHP Application Protocol for Ecosystem Service Weighting
Phase 1: Problem Structuring
Step 1: Define Decision Goal
- Clearly articulate the ecosystem service weighting objective (e.g., "Prioritize ecosystem services for conservation planning in Central Yunnan Province") [8]
Step 2: Develop Hierarchical Structure
- Construct a hierarchy with the decision goal at the top level
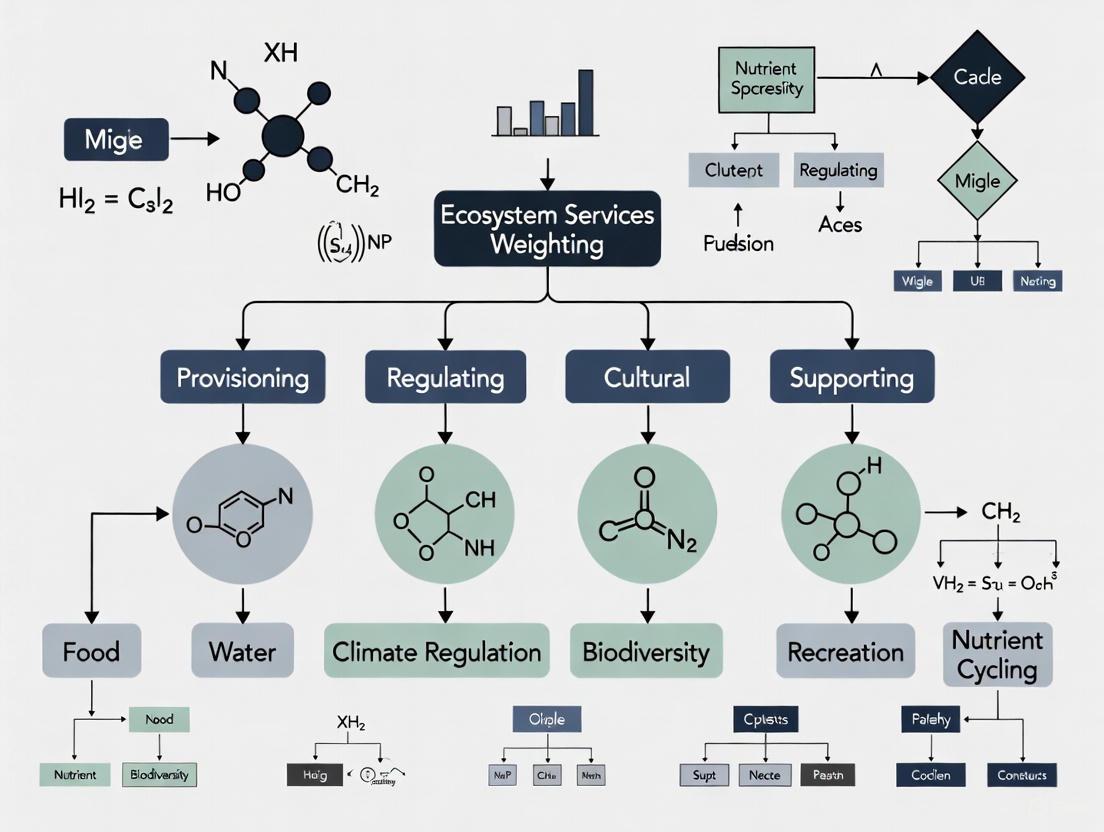
- Identify key evaluation criteria (e.g., provisioning, regulating, supporting, and cultural services)
- Specify sub-criteria as needed (e.g., water yield, carbon storage, habitat quality, soil conservation)
- Include alternatives at the lowest level [1] [8]
AHP Hierarchy for Ecosystem Services
Step 3: Conduct Pairwise Comparisons
- Compare all criteria and sub-criteria pairs using Saaty's scale
- Document judgments in a pairwise comparison matrix
- Repeat for alternatives with respect to each criterion [1] [5]
Table: Pairwise Comparison Matrix Example for Ecosystem Services
| Water Yield | Carbon Storage | Habitat Quality | Soil Conservation | |
|---|---|---|---|---|
| Water Yield | 1 | 1/5 | 3 | 4 |
| Carbon Storage | 5 | 1 | 9 | 7 |
| Habitat Quality | 1/3 | 1/9 | 1 | 2 |
| Soil Conservation | 1/4 | 1/7 | 1/2 | 1 |
Phase 3: Mathematical Synthesis
Step 4: Calculate Priority Vectors
- Square the pairwise comparison matrix
- Compute row sums and normalize to derive priority weights
- Iterate until weights stabilize (eigenvector method) [1]
Step 5: Check Consistency
Step 6: Synthesize Overall Priorities
- Combine criterion weights with alternative scores using weighted-sum aggregation
- Generate overall rankings for decision alternatives [1] [2]
AHP Computational Workflow
Research Reagent Solutions for Ecosystem Service Assessment
Table: Essential Methodological Tools for Ecosystem Service Research
| Research Component | Representative Tools/Methods | Application in Ecosystem Service Weighting |
|---|---|---|
| Biophysical Modeling | InVEST model, RUSLE | Quantify ecosystem service provision (e.g., water yield, soil conservation) [8] |
| Data Collection | PPGIS, field surveys, remote sensing | Gather spatial and empirical data on ecosystem services [9] |
| Statistical Analysis | Principal Component Analysis (PCA) | Identify key drivers and reduce dimensionality [8] |
| Spatial Analysis | Geodetector model, GIS | Analyze spatial patterns and driving factors of ecosystem services [8] |
| Decision Support Software | Expert Choice, Prioritization Helper | Facilitate AHP calculations and sensitivity analysis [2] [3] |
Advanced Methodological Considerations
Handling Multiple Stakeholder Perspectives
In ecosystem service weighting, incorporating diverse stakeholder values is crucial. AHP facilitates participatory decision-making by allowing different stakeholder groups to provide judgments that can be aggregated using geometric means or other aggregation techniques [5] [6]. Research by Gompf et al. demonstrated how AHP can reconcile perspectives from academic institutions, city authorities, and mobility service providers in sustainability assessments [5].
Integration with Other Assessment Methods
AHP can be effectively combined with other analytical approaches for comprehensive ecosystem service assessment:
- Principal Component Analysis (PCA): Construct Integrated Ecosystem Service Indices (IESI) to objectively weight multiple services [8]
- Geographic Information Systems (GIS): Spatial explicit ecosystem service mapping and valuation [9]
- Social well-being assessment: Link ecosystem services to human well-being dimensions [9]
Addressing Uncertainty and Sensitivity
Robust AHP applications in ecosystem research should include:
- Sensitivity analysis to test how weight variations affect final rankings [6]
- Scenario analysis to evaluate ecosystem service priorities under different management regimes [8]
- Uncertainty propagation to account for measurement errors in biophysical data [8]
The Analytic Hierarchy Process provides a rigorous, mathematically sound framework for weighting ecosystem services that systematically incorporates both scientific data and stakeholder values. Its structured approach to breaking down complex decisions, combined with its ability to handle multiple criteria and diverse perspectives, makes it particularly valuable for environmental management applications. When properly implemented with appropriate consistency checks and sensitivity analyses, AHP generates transparent, defensible weightings that can support informed ecosystem management decisions and policy development.
The Role of AHP in Multi-Criteria Decision Analysis for Environmental Management
The Analytical Hierarchy Process (AHP) has emerged as a pivotal Multi-Criteria Decision-Making (MCDM) tool, enabling researchers and environmental managers to transform complex, multi-faceted environmental problems into structured, solvable hierarchies. In the realm of environmental management, decisions often involve balancing a diverse set of ecological, social, and economic criteria, where trade-offs are inherent. The AHP method, introduced by Thomas Saaty, provides a robust framework for weighting these criteria through pairwise comparisons, converting both quantitative and qualitative assessments into a coherent decision-making model [5] [10]. Its application is particularly valuable in ecosystem service weighting, as it offers a systematic and transparent means to incorporate expert judgement and stakeholder values into environmental prioritization, thereby supporting more sustainable and defensible management outcomes [11] [10].
Methodological Foundations of AHP
The AHP method structures a decision problem into a hierarchical model, with the overall goal at the apex, followed by criteria and sub-criteria, and finally the decision alternatives at the base [5] [10]. This breakdown simplifies complex problems into a series of pairwise comparisons, where decision-makers evaluate the relative importance of two elements at a time using a standardized 1-9 scale of judgement [5].
A key advantage of AHP is its capacity to integrate tangible and intangible aspects, accommodating the subjectivism and uncertainty inherent in environmental decision-making [10]. The process involves constructing a comparison matrix, from which priority weights are derived by solving for the principal eigenvector and eigenvalue. The resulting weights represent the relative importance of each criterion, and an overall consistency ratio (CR) is computed to validate the coherence of the judgements, with a CR below 0.10 generally considered acceptable [5] [10].
Application Notes: AHP in Environmental Management
The application of AHP in environmental management is illustrated through diverse case studies. For instance, research in Western Iran utilized AHP in conjunction with Geographic Information Systems (GIS) to identify optimal locations for wind farms. The study considered electrical, techno-economic, environmental, and geo-infrastructure criteria, ultimately identifying six suitable areas capable of supporting 216 MW of capacity and reducing greenhouse gas emissions by over 1.2 million tons [12]. Similarly, a study in the Jequitinhonha River Basin, Brazil, employed AHP for environmental fragility mapping, hierarchically sorting five key environmental criteria to support conservation zone management [11].
Table 1: Summary of Environmental AHP Application Case Studies
| Study Location | Primary Objective | Key Criteria Employed | Outcome |
|---|---|---|---|
| Western Iran [12] | Wind farm site selection | Electrical, Techno-economic, Environmental, Geo-infrastructure | Identified 4 suitable sites; 216 MW potential; ~1.26M ton CO₂e reduction |
| Jequitinhonha Basin, Brazil [11] | Environmental fragility mapping | Physical landscape attributes | Created a prioritized map for conservation and ecological restoration |
| Urban Mobility, Germany [5] | Social sustainability assessment | Local Community, User, Worker, Value Chain Actors, Society | Provided clear weighting guidance for decision-makers in urban mobility |
Criteria and Weighting for Ecosystem Services
Establishing a relevant and comprehensive set of criteria is fundamental. Weights for these criteria are typically derived through expert consultation. A study on sustainable neighborhoods, for example, defined a hierarchy with six main criteria: Ecology and land use, Infrastructure, Transport, Resources, Social well-being, and Neighborhood environment [10]. Engaging a diverse group of experts ensures that the weighting reflects multiple perspectives. For instance, a mobility services study successfully gathered judgements from academic institutions, city authorities, and service providers [5].
Table 2: Example Criteria and Relative Weights from an Environmental Study
| Criterion | Description | Relative Weight (%) |
|---|---|---|
| Global Warming Potential | Impact on climate change via GHG emissions | 22.5 |
| Resource Consumption | Use of natural resources and materials | 19.0 |
| Energy Efficiency | Life-cycle energy demand | 18.5 |
| Circularity Potential | Potential for reuse, recycling, and recovery | 17.5 |
| Ecosystem Impact | Direct impact on local biodiversity and land | 14.5 |
| Economic Feasibility | Cost-effectiveness and implementation cost | 8.0 |
Experimental Protocols
Protocol: AHP for Environmental Criteria Weighting
This protocol details the steps for determining priority weights for environmental criteria or ecosystem services using the AHP method, adaptable for studies in fields like forestry, urban planning, or energy development [12] [5] [10].
Phase 1: Problem Definition and Hierarchical Structure Formulation
- Define the Goal: Clearly articulate the environmental decision problem (e.g., "To identify priority areas for ecological restoration").
- Literature Review: Conduct a systematic review to identify relevant environmental criteria and sub-criteria from scientific literature, certification systems (e.g., BREEAM, LEED), and policy documents [13] [10].
- Build the Hierarchy: Construct a tree with the goal at Level 1, the main criteria at Level 2, and any sub-criteria at Level 3. If applicable, decision alternatives form the base level.
Phase 2: Expert Selection and Survey Design
- Expert Identification: Identify and recruit a panel of experts (typically 10-50) with proven experience in the relevant environmental field. Sourcing from academia, government authorities, and industry ensures diverse perspectives [5] [10].
- Questionnaire Development: Design a survey for pairwise comparisons. For each pair of criteria within the same hierarchical level, the expert judges which is more important and to what degree, using Saaty's 1-9 scale [5].
- Survey Execution: Administer the questionnaire, preferably using online survey tools. Provide clear instructions and definitions for all criteria to ensure consistent understanding [5] [10].
Phase 3: Data Processing and Consistency Validation
- Construct Comparison Matrices: For each expert, compile their judgements into a square pairwise comparison matrix for each level of the hierarchy.
- Calculate Priority Weights: Compute the principal eigenvector for each matrix to derive the local priority weights for criteria and sub-criteria. Specialized software (e.g., Expert Choice, R, Python libraries) can automate this [10].
- Check Consistency: Calculate the Consistency Ratio (CR) for each set of comparisons. A CR ≤ 0.10 indicates acceptable consistency. If the CR is higher, the expert may need to review their judgements [5] [10].
- Aggregate Judgements: Aggregate the validated individual weightings from all experts (e.g., using the geometric mean) to produce a final set of group priority weights.
Protocol: GIS-AHP Integration for Spatial Environmental Planning
This protocol combines AHP with GIS for mapping environmental suitability or fragility, commonly used in site selection and regional zoning [12] [11].
- Criterion Selection and Hierarchy Creation: Follow Phase 1 of the general AHP protocol to define the goal and relevant spatial criteria (e.g., slope, soil type, land use, proximity to protected areas).
- AHP Weighting: Use the AHP method (Phases 2 & 3 of the general protocol) to determine the relative importance (weights) of each spatial criterion.
- GIS Data Layer Preparation: Obtain or create spatial data layers (e.g., raster or polygon datasets) for each criterion in the GIS environment.
- Data Layer Standardization: Reclassify all data layers to a common suitability scale (e.g., 1-9), where higher values indicate higher suitability or greater fragility.
- Weighted Overlay Analysis: Perform a GIS weighted overlay analysis. Multiply each standardized data layer by its corresponding AHP-derived weight and sum the results to generate a final composite suitability/fragility map.
- Validation and Interpretation: Validate the model output with ground-truth data or expert opinion and interpret the results to inform planning decisions.
The Scientist's Toolkit: Research Reagent Solutions
Table 3: Essential Tools and Resources for AHP Environmental Research
| Tool / Resource | Type | Function in AHP Research |
|---|---|---|
| Expert Panel | Human Resource | Provides the essential pairwise comparison judgements to derive criteria weights. Diversity across sectors (academia, government, industry) is key [5] [10]. |
| AHP Software | Analytical Tool | Automates the calculation of eigenvectors, weights, and consistency ratios from comparison matrices, saving time and reducing errors [10]. |
| GIS Software | Spatial Analysis Tool | Manages, analyzes, and visualizes spatial data layers for integration with AHP weights in land-use and suitability studies [12] [11]. |
| Online Survey Platform | Data Collection Tool | Facilitates the efficient distribution and collection of pairwise comparison questionnaires from experts, especially in large or geographically dispersed panels [5] [10]. |
| Saaty's 1-9 Scale | Methodological Standard | Provides the fundamental scale for translating qualitative expert judgements into quantitative values for pairwise comparisons [5]. |
The Analytic Hierarchy Process (AHP) is a multi-criteria decision analysis (MCDA) method developed by Thomas Saaty in the 1970s at the Wharton School of the University of Pennsylvania [1] [2]. It is designed to help decision-makers structure complex problems into a hierarchical framework, evaluate multiple criteria, and rank alternatives based on both quantitative and qualitative factors [2] [14]. For researchers in ecosystem service weighting, AHP provides a structured framework to translate expert judgments and stakeholder preferences into quantifiable weights, thereby supporting more transparent and defensible environmental decision-making.
Core Terminology and Hierarchical Structure
The foundational structure of AHP is a hierarchy that decomposes a complex decision problem into manageable components. The standard hierarchy consists of three primary levels [1] [14]:
- Goal: The overarching objective or decision you are trying to achieve (e.g., "Prioritize ecosystem services for conservation planning").
- Criteria: The factors or attributes that are relevant to achieving the goal (e.g., "Biodiversity," "Carbon Sequestration," "Recreational Value"). Criteria can be further broken down into sub-criteria for more detailed analysis.
- Alternatives: The potential options, choices, or scenarios being evaluated against the criteria (e.g., "Forest Management Scenario A," "Wetland Restoration Scenario B").
This hierarchical structure for ecosystem service research can be visualized as follows:
Pairwise Comparisons and Saaty's Scale
The Pairwise Comparison Process
Pairwise comparisons form the operational core of AHP, where decision-makers compare elements two at a time with respect to their parent element in the hierarchy [14]. Instead of attempting to weight all criteria simultaneously, this method breaks down judgments into simpler, more reliable comparisons. For ecosystem service research, this means comparing the relative importance of two services at a time (e.g., "How much more important is biodiversity than carbon sequestration for our conservation goal?").
Saaty's Fundamental Scale
AHP uses a standardized 1-9 ratio scale to quantify judgments during pairwise comparisons [1] [2]. The scale and its interpretation for ecosystem service research are detailed in Table 1.
Table 1: Saaty's Fundamental Scale of Relative Importance
| Intensity of Importance | Definition | Explanation for Ecosystem Service Context |
|---|---|---|
| 1 | Equal importance | Two services contribute equally to the objective |
| 3 | Moderate importance | Experience and judgment slightly favor one service over another |
| 5 | Strong importance | Experience and judgment strongly favor one service over another |
| 7 | Very strong importance | One service is favored very strongly over another |
| 9 | Extreme importance | The evidence favoring one service over another is of the highest possible order of affirmation |
| 2, 4, 6, 8 | Intermediate values | Used when compromise is needed between adjacent judgments |
| Reciprocals | If service i has one of the above numbers assigned to it when compared with service j, then j has the reciprocal value when compared with i | Used for less important services compared to more important ones |
Experimental Protocol for Ecosystem Service Weighting
Protocol: Establishing Criterion Weights via Pairwise Comparison
Purpose: To derive quantitative weights for ecosystem services through systematic pairwise comparisons.
Materials:
- List of relevant ecosystem services (criteria)
- Saaty's scale reference table
- Data collection matrix or specialized AHP software
Procedure:
Structure the Decision Hierarchy:
- Define the overarching goal for ecosystem service valuation
- Identify 4-9 key ecosystem services as criteria
- Structure alternatives (management scenarios, policy options, or geographic areas)
Develop Pairwise Comparison Matrix:
- Create a reciprocal matrix where each ecosystem service is compared against every other service
- For n criteria, there will be n(n-1)/2 pairwise comparisons
- Use the question: "With respect to [conservation goal], how much more important is [Ecosystem Service A] than [Ecosystem Service B]?"
Collect Expert Judgments:
- Engage 3-7 domain experts independently
- Present comparison questions in random order to avoid ordering bias
- Record responses using Saaty's 1-9 scale
Calculate Priority Weights:
Check Consistency:
- Calculate consistency ratio (CR) to validate judgment reliability
- Accept judgments with CR ≤ 0.10 [14]
- If CR > 0.10, revisit comparisons to identify and resolve inconsistencies
Data Analysis:
- Apply the geometric mean to aggregate group judgments: (Judgment₁ × Judgment₂ × ... × Judgmentₙ)¹/ⁿ [14]
- Calculate weights using the approximate eigenvector method (normalization of column sums) [15]
- Compute consistency ratio to ensure logical coherence of judgments [2]
Workflow Visualization
The complete experimental workflow for implementing AHP in ecosystem service research is shown below:
Data Presentation and Calculation Methods
Example: Pairwise Comparison Matrix for Ecosystem Services
Table 2: Example Pairwise Comparison Matrix for Ecosystem Services (Single Expert)
| Ecosystem Service | Biodiversity | Carbon Sequestration | Water Quality | Recreation |
|---|---|---|---|---|
| Biodiversity | 1 | 3 | 2 | 5 |
| Carbon Sequestration | 1/3 | 1 | 1/2 | 2 |
| Water Quality | 1/2 | 2 | 1 | 3 |
| Recreation | 1/5 | 1/2 | 1/3 | 1 |
Calculation of Priority Weights
The geometric mean method provides a straightforward approach to calculate weights from pairwise comparison matrices [15]. The process for the matrix above is demonstrated in Table 3.
Table 3: Weight Calculation Using Geometric Mean Method
| Ecosystem Service | Geometric Mean Calculation | Geometric Mean | Normalized Weight |
|---|---|---|---|
| Biodiversity | (1 × 3 × 2 × 5)^(1/4) | 2.340 | 0.477 |
| Carbon Sequestration | (1/3 × 1 × 1/2 × 2)^(1/4) | 0.760 | 0.155 |
| Water Quality | (1/2 × 2 × 1 × 3)^(1/4) | 1.316 | 0.268 |
| Recreation | (1/5 × 1/2 × 1/3 × 1)^(1/4) | 0.488 | 0.099 |
| Total | 4.904 | 1.000 |
Consistency Ratio Calculation
A consistency ratio (CR) ≤ 0.10 indicates acceptable consistency in judgments [14]. The calculation involves:
- Computing the weighted sum vector
- Finding the consistency index (CI) = (λₘₐₓ - n)/(n - 1), where λₘₐₓ is the principal eigenvalue and n is matrix size
- Calculating CR = CI/RI, where RI is the random index based on matrix size
The Researcher's Toolkit for AHP Implementation
Table 4: Essential Research Reagents and Tools for AHP in Ecosystem Service Research
| Tool/Reagent | Function/Purpose | Implementation Notes |
|---|---|---|
| Expert Panel | Provides judgment inputs for pairwise comparisons | Select 3-7 experts with diverse backgrounds; ensure domain expertise in relevant ecosystem services |
| Saaty's Scale | Standardized metric for quantifying relative importance | Use the 1-9 ratio scale with verbal anchors; ensure all participants understand scale interpretation |
| AHP Software | Automates matrix calculations and consistency checking | Options include Expert Choice, TransparentChoice, or open-source R/Python packages [2] [14] |
| Consistency Ratio | Validates logical coherence of judgments | Target CR ≤ 0.10; higher values indicate need for judgment revision [2] |
| Geometric Mean | Aggregates multiple expert judgments | Preferred over arithmetic mean for ratio data; preserves reciprocal property [14] |
| Sensitivity Analysis | Tests robustness of results to judgment variations | Systematically vary key judgments to determine impact on final rankings |
Application to Ecosystem Service Research
In ecosystem service weighting, AHP enables researchers to:
- Integrate Diverse Perspectives: Combine ecological, economic, and social values through structured expert engagement
- Handle Data Gaps: Make informed decisions even when quantitative data is limited or unavailable
- Document Rationale: Provide transparent documentation of how and why certain weights were assigned
- Support Policy Decisions: Create defensible weighting schemes for environmental management and policy prioritization
The methodology is particularly valuable when dealing with trade-offs between different types of ecosystem services (e.g., provisioning vs. regulating services) and when stakeholder values must be explicitly incorporated into decision-making processes.
Advantages of AHP for Complex Ecosystem Service Trade-off Analysis
Ecosystem management inherently involves complex decision-making where planners must balance competing objectives, such as agricultural production, water yield, biodiversity, and carbon sequestration [16]. The Analytic Hierarchy Process (AHP), a multi-criteria decision analysis (MCDA) technique, provides a structured framework for weighting and prioritizing ecosystem services (ES) to navigate these trade-offs systematically [17] [18]. By breaking down complex problems into a hierarchical structure and employing pairwise comparisons, AHP translates subjective stakeholder judgements into quantitative weights, offering a transparent and participatory approach to environmental management [5] [2]. This application note details the advantages and provides a detailed protocol for applying AHP in ecosystem service trade-off analysis, supporting researchers and policymakers in making informed, sustainable decisions.
Key Advantages of AHP in Ecosystem Service Analysis
The application of AHP in environmental management, particularly for ecosystem service trade-offs, offers several distinct advantages over less structured approaches, as demonstrated in recent sustainability research.
Table 1: Key Advantages of AHP for Ecosystem Service Trade-off Analysis
| Advantage | Description | Relevant Context |
|---|---|---|
| Structured Problem Decomposition | Breaks down a complex problem into a manageable hierarchy (goal, criteria, sub-criteria, alternatives) [2]. | Allows for a systematic analysis of the three pillars of sustainability (Economy, Society, Environment) and their sub-components [18]. |
| Integration of Quantitative & Qualitative Data | Uses pairwise comparisons on a defined scale (Saaty's scale) to quantify subjective preferences [2]. | Enables the incorporation of both biophysical data (e.g., crop yield) and stakeholder values (e.g., cultural importance) [17] [16]. |
| Stakeholder Participation & Transparency | Facilitates a participatory process by engaging experts and stakeholders in the pairwise comparison stage [5]. | Improves the legitimacy of decisions and helps manage conflicts in environmental planning, such as water management [17]. |
| Consistency Validation | Calculates a Consistency Ratio (CR) to check the logical coherence of the judgements provided by decision-makers [2]. | Provides a measure of reliability for the resulting weights, ensuring that the derived priorities are trustworthy [2]. |
| Flexibility in Criteria Selection | The hierarchical model is adaptable and can incorporate non-ES criteria that are relevant to the decision context [17]. | Allows for the inclusion of socio-economic criteria (e.g., jobs, regional economy) alongside pure ecosystem service criteria [17]. |
A primary strength of AHP is its ability to harmonize diverse perspectives. A study on sustainable mobility services successfully used AHP to integrate the priorities of three different expert groups: academic institutions, city authorities, and mobility service providers [5]. While differences emerged, the process provided a clear, aggregated guidance for decision-makers, demonstrating how AHP can reconcile conflicting stakeholder interests in sustainability contexts [5]. Furthermore, AHP's flexibility to handle complex criteria systems was showcased in a comprehensive sustainable development assessment, where a five-level hierarchical criteria system was constructed to analyze the economic, social, and environmental pillars [18].
Experimental Protocols and Workflows
Protocol: AHP for Evaluating Land Management Scenarios
This protocol is adapted from integrated assessment frameworks used in studies like the evaluation of trade-offs in the Loess Plateau of China [16].
Phase 1: Problem Structuring and Hierarchy Development
- Define the Goal: Clearly state the decision problem (e.g., "To identify the optimal land management scenario for balancing agricultural production and ecosystem services in a given region").
- Identify Criteria and Sub-criteria: Select the relevant ecosystem services and other decision criteria based on the goal. These often align with the Millennium Ecosystem Assessment categories [16]:
- Provisioning Services: e.g., Crop Yield, Economic Benefit.
- Regulating Services: e.g., Water Yield, Soil Conservation, Carbon Sequestration.
- Supporting Services: e.g., Biodiversity, Habitat Quality.
- Other Criteria: e.g., Social equity, Implementation cost (if applicable).
- Define Alternatives: Specify the land management scenarios to be evaluated (e.g., Business-as-Usual, Ecological Restoration, Sustainable Intensification) [16].
- Build the Hierarchy: Construct an AHP hierarchy tree with the goal at the top, criteria and sub-criteria in the middle levels, and the alternatives at the bottom.
Phase 2: Data Collection and Pairwise Comparisons
- Expert and Stakeholder Selection: Identify and recruit a diverse group of relevant experts (e.g., ecologists, agronomists, economists, local policymakers).
- Conduct Pairwise Comparisons: Present stakeholders with a questionnaire to compare all elements (criteria, sub-criteria) at each level of the hierarchy against each other with respect to their parent element. Use Saaty's 1-9 scale [2], where 1 indicates equal importance and 9 indicates extreme importance of one element over another.
- Gather Judgements: Collect completed comparison matrices from all participants. A sample size of around 15-50 experts is often sufficient for robust results [5].
Phase 3: Data Analysis and Priority Derivation
- Calculate Local Priorities: For each pairwise comparison matrix, compute the normalized principal eigenvector to derive the local priority weights for each element [5] [2]. This can be done using software like Expert Choice, PriEsT, or statistical packages in R or Python.
- Check Consistency: Calculate the Consistency Ratio (CR) for each matrix. A CR value of less than 0.10 is generally considered acceptable; if higher, the judgements may need to be revisited [2].
- Aggregate Judgements: Aggregate the individual priority vectors from all stakeholders, for example, by using the geometric mean of their individual judgements [5].
- Synthesize Global Priorities: Combine the local priorities throughout the hierarchy to obtain global priority scores for each alternative. This is typically done using a weighted-sum model, multiplying the weight of each criterion by the alternative's performance score on that criterion and summing the results [2].
Phase 4: Interpretation and Trade-off Analysis
- Rank Alternatives: Rank the land management scenarios based on their final global priority scores.
- Perform Sensitivity Analysis: Test how sensitive the final ranking is to changes in the weights of the main criteria. This helps in understanding the robustness of the decision.
- Analyze Trade-offs: Examine the global priority matrix to identify key trade-offs. For instance, a scenario might score high on agricultural production but low on regulating services, which should be explicitly communicated [16].
Diagram 1: AHP hierarchy for land management
Workflow: Integrating AHP with Biophysical Modeling
A robust application of AHP in ecosystem service studies often involves integrating its results with biophysical and economic models to form a comprehensive assessment framework [16].
Table 2: Stages of an Integrated AHP-Biophysical Modeling Workflow
| Stage | Activity | Key Inputs | Outputs |
|---|---|---|---|
| 1. Data Collection & Modeling | Utilize remote sensing data, field observations, and biophysical models (e.g., InVEST, RUSLE) to quantify ecosystem service indicators [16]. | Landsat imagery, soil samples, climate data, land use maps. | Spatially explicit maps and quantitative values for ES indicators (e.g., water yield in m³, soil loss in tons/ha). |
| 2. AHP Weighting | Conduct the AHP process with stakeholders to assign relative importance weights to each ecosystem service indicator. | Stakeholder judgements from pairwise comparisons. | A validated set of weights for all ES criteria and sub-criteria in the hierarchy. |
| 3. Multi-Criteria Integration | Combine the biophysical performance data (from Stage 1) with the AHP-derived weights (from Stage 2) using a weighted-sum model or other MCDA aggregation method. | ES indicator values and AHP criterion weights. | A single composite score for each land management alternative or spatial unit. |
| 4. Trade-off Analysis & Scenarios | Evaluate the composite scores under different land management scenarios (e.g., BAU, Ecological Restoration) and analyze the trade-offs between them [16]. | Composite scores for each alternative. | Ranking of alternatives, identification of win-win and trade-off situations, policy recommendations. |
Diagram 2: Integrated AHP-biophysical workflow
Successful implementation of AHP for ecosystem service analysis requires a combination of software tools, methodological guides, and data sources.
Table 3: Research Reagent Solutions for AHP-based ES Analysis
| Item / Tool | Type | Function / Application |
|---|---|---|
| Expert Choice | Commercial Software | A dedicated AHP software that provides a user-friendly interface for building hierarchies, running pairwise comparisons, calculating weights, and performing sensitivity analysis [2]. |
| PriEsT | Software / Online Tool | An open-source decision support tool designed for AHP, allowing for the elicitation of pairwise comparisons and calculation of priorities, including checks for consistency [18]. |
| R (randomForest package) | Programming Language / Package | Used for land-use classification from remote sensing data, a common preliminary step in mapping ecosystem services [16]. |
| InVEST (Integrated Valuation of Ecosystem Services and Tradeoffs) | Software Suite | A family of spatially explicit biophysical models used to map and value ecosystem services, such as water yield, carbon sequestration, and habitat quality [16]. |
| Saaty's 1-9 Scale | Methodological Framework | The fundamental scale used in AHP to convert qualitative judgements into quantitative values during pairwise comparisons [2]. |
| Consistency Ratio (CR) | Analytical Metric | A key output of AHP calculations that validates the logical consistency of the decision-maker's judgements; a CR < 0.1 is acceptable [2]. |
| Landsat 8 OLI Imagery | Data Source | A primary source of remote sensing data used for land cover/land use classification, which serves as a critical input for many ecosystem service models [16]. |
Ecosystem service valuation is a critical tool for translating the benefits of nature into terms that can be integrated into policy, planning, and decision-making processes. The fundamental challenge in this field lies in creating robust methodologies that can simultaneously account for both tangible factors (with direct market prices) and intangible factors (non-market values) to produce comprehensive assessments. The Analytic Hierarchy Process (AHP), a multi-criteria decision-making (MCDM) method, provides a structured framework for addressing this challenge through systematic pairwise comparisons that derive weighted priorities across diverse environmental criteria [5].
The valuation process typically recognizes a cascade from ecosystem functions (biophysical processes), to ecosystem services (benefits to humans), and finally to values (economic, social, and environmental benefits) [19]. This progression creates a logical structure for organizing valuation efforts, though integrating market and non-market values remains methodologically complex. This document presents application notes and protocols for implementing AHP within ecosystem service valuation research, specifically designed to bridge the tangible-intangible valuation gap.
Theoretical Framework and Weighting Principles
The Role of AHP in Environmental Valuation
The AHP method addresses a core limitation in conventional environmental valuation: the weak comparability of values derived from different measurement approaches [20]. By using a consistent pairwise comparison mechanism, AHP enables researchers to establish relative importance weights across criteria that would otherwise be incommensurate through traditional economic valuation alone. This is particularly valuable when integrating data from market valuation methods (e.g., direct pricing, avoided costs) with values obtained through non-market methods (e.g., contingent valuation, hedonic pricing) [19].
AHP has been successfully applied across numerous environmental domains, including:
- Life Cycle Assessment (LCA) weighting for agricultural production systems [21]
- Social Life Cycle Assessment (S-LCA) for mobility services [5]
- Regional transformative knowledge potential analysis [22]
- Coastal restoration project evaluation [23]
Structuring the Valuation Hierarchy
The foundation of AHP application is converting a complex problem into a hierarchical structure, with the overall goal at the top level and various criteria arranged in subsequent levels [5]. For ecosystem service valuation, a typical hierarchy would include:
- Overall Goal: Comprehensive ecosystem service valuation
- Criteria Level: Major ecosystem service categories (e.g., provisioning, regulating, cultural)
- Subcriteria Level: Specific services within each category
- Alternative Level: Different management scenarios or restoration options
Table 1: Exemplary AHP Hierarchy Structure for Wetland Ecosystem Valuation
| Level 1: Goal | Level 2: Criteria | Level 3: Subcriteria |
|---|---|---|
| Comprehensive Wetland Valuation | Provisioning Services | Food productionWater supplyRaw materials |
| Regulating Services | Carbon sequestrationWater purificationFlood control | |
| Cultural Services | Recreational opportunitiesAesthetic valueEducational value |
Quantitative Foundations and Data Integration
AHP Weighting Outcomes in Environmental Applications
Empirical studies provide quantitative evidence of how AHP derives distinct weighting profiles across environmental criteria. These weights reflect the relative priority of different ecosystem services as determined through expert or stakeholder pairwise comparisons.
Table 2: AHP Weighting Results from Environmental Applications
| Study Context | Impact Categories/Criteria | AHP Weight | Data Source |
|---|---|---|---|
| Agricultural Production LCA [21] | Acidification Potential | 0.222 | Expert surveys (LCA specialists) |
| Terrestrial Eutrophication | 0.203 | Expert surveys (LCA specialists) | |
| Global Warming | 0.191 | Expert surveys (LCA specialists) | |
| Fossil Resources Depletion | 0.129 | Expert surveys (LCA specialists) | |
| Social LCA for Mobility Services [5] | Local Community | Varies by stakeholder group | 48 experts across academia, government, industry |
| User/Consumer | Varies by stakeholder group | 48 experts across academia, government, industry | |
| Worker | Varies by stakeholder group | 48 experts across academia, government, industry |
Integrated Valuation Metrics
A critical advancement in AHP application involves creating bridges between biophysical measurements and economic values. One innovative approach uses the EU carbon dioxide emission allowances as a reference value for monetizing non-provisioning ecosystem services, providing a consistent market-based metric for comparison [20].
Table 3: Ecosystem Service Valuation Metrics and Methods
| Valuation Approach | Application Context | Key Metrics | Reference Point |
|---|---|---|---|
| Market-based Methods [19] | Direct market services | Market prices, revenue generated | Actual market transactions |
| Cost-based Methods [19] | Replacement of services | Avoided costs, replacement costs | Cost of built infrastructure |
| Stated Preference Methods [19] | Non-market services | Willingness-to-pay, contingent valuation | Survey responses |
| Carbon Reference Method [20] | Non-provisioning services | EU ETS carbon allowance prices | December 2021 price: ~€80/ton CO₂ |
Experimental Protocols and Application Notes
Protocol: AHP for Ecosystem Service Weighting in Restoration Planning
Application Context: This protocol provides a structured method for applying AHP to weight ecosystem service criteria in coastal restoration projects, aligning with frameworks suggested by NOAA and The Nature Conservancy [23].
Phase 1: Problem Structuring and Hierarchy Development
- Define Decision Context: Clearly articulate the restoration planning decision and spatial boundaries.
- Identify Stakeholder Groups: Include relevant experts (ecologists, economists), community representatives, and decision-makers.
- Develop Hierarchy Tree: Create a minimum 3-level hierarchy:
- Level 1: Goal (e.g., "Optimal coastal restoration strategy")
- Level 2: Criteria (e.g., "Ecosystem Service Enhancement," "Cost Effectiveness," "Social Equity")
- Level 3: Subcriteria under Ecosystem Services (e.g., "Storm Protection," "Carbon Sequestration," "Recreation Opportunities")
Phase 2: Data Collection and Pairwise Comparisons
- Expert Recruitment: Target 15-25 participants per stakeholder group to ensure statistical reliability [5].
- Pairwise Comparison Design: Develop survey instrument using standard 9-point importance scale (1 = equal importance, 9 = extreme importance) [5].
- Consistency Validation: Implement consistency ratio (CR) check with threshold of CR < 0.10 for acceptable responses.
Phase 3: Weight Calculation and Synthesis
- Eigenvector Calculation: Compute priority weights from pairwise comparison matrices using principal eigenvector method: (A - λₘₐₓI)w = 0 [5].
- Group Aggregation: Use geometric mean to aggregate individual judgments within stakeholder groups.
- Sensitivity Analysis: Test weight stability through scenario analysis with varying input priorities.
Protocol: Hybrid AHP-Carbon Valuation for Non-Market Services
Application Context: This protocol integrates AHP weighting with carbon market valuation to create consistent monetary estimates for non-market ecosystem services, based on research by [20].
Phase 1: Reference Attribute Selection
- Identify Carbon Sequestration as Anchor: Select regulatory ecosystem service of carbon sequestration as reference attribute due to its direct market valuation through emissions trading systems.
- Establish Carbon Value: Determine current EU ETS (or comparable system) carbon allowance price per ton CO₂ (e.g., €80/ton as reference point).
Phase 2: Ratio Comparison and Scaling
- AHP Pairwise Comparison: Conduct AHP analysis comparing carbon sequestration to other non-provisioning services (biodiversity, water purification, recreation, etc.).
- Calculate Relative Ratios: Derive ratio of importance between carbon and other services (e.g., biodiversity = 1.2 × carbon; water purification = 0.8 × carbon).
- Monetary Conversion: Apply ratios to carbon market value to estimate monetary equivalents (e.g., Biodiversity value = 1.2 × €80 = €96/unit area).
Phase 3: Validation and Calibration
- Cross-Method Comparison: Compare results with traditional valuation methods (contingent valuation, benefit transfer) for calibration.
- Uncertainty Assessment: Quantify uncertainty ranges through Monte Carlo simulation with varying carbon prices and AHP ratio inputs.
Table 4: Essential Research Reagents for AHP Ecosystem Service Valuation
| Tool/Resource | Function/Purpose | Application Context |
|---|---|---|
| AHP Survey Platforms [22] | Administer pairwise comparison surveys to expert panels | All AHP applications requiring stakeholder input |
| Consistency Ratio Calculator | Validate response reliability (CR < 0.10 threshold) | Data quality assurance in AHP studies |
| EU ETS Carbon Price Data [20] | Reference value for monetizing regulatory services | Carbon-linked valuation methods |
| Ecosystem Service Coefficients [20] | Biophysical metrics for service quantification | Translation of ecosystem functions to service flows |
| FSC Ecosystem Services Procedure [24] | Certification framework for forest ecosystem services | Standardized claims for biodiversity, carbon, water services |
| Stakeholder Analysis Framework [5] | Identify and categorize expert groups | Participatory weighting processes |
Integrated Workflow Visualization
The following diagram illustrates the complete integrated workflow for combining tangible and intangible factors in environmental valuation using AHP methodology:
The integration of tangible and intangible factors in environmental valuation represents both a methodological challenge and opportunity for advancing evidence-based environmental decision-making. The AHP methodology provides a robust, transparent framework for establishing weighted priorities across diverse ecosystem services, particularly when complemented by innovative anchoring approaches such as carbon market valuation. The protocols and application notes presented here offer researchers structured approaches for implementing these methods across various environmental contexts, from coastal restoration to forest management. As ecosystem service markets continue to evolve [24], these integrated valuation approaches will become increasingly essential for capturing the full value of natural capital in policy and planning decisions.
Implementing AHP: Step-by-Step Methodology and Real-World Applications
The Analytic Hierarchy Process (AHP) is a multi-criteria decision-making (MCDM) method developed by Thomas Saaty in the 1970s that helps individuals and groups tackle complex decisions by organizing decision elements into a hierarchical structure [1] [2] [3]. For researchers in ecosystem services, AHP provides a structured framework to quantify subjective judgments, enabling the comparison of diverse and often incommensurable elements—from tangible economic benefits to intangible cultural values [5] [3]. The process begins with decomposing a complex problem into a hierarchy, progressing from an overarching goal at the top, through various criteria and sub-criteria, down to the decision alternatives at the bottom [1] [2]. This hierarchical breakdown facilitates a systematic evaluation of how different ecosystem services contribute to overall environmental and human well-being, allowing researchers to clarify relationships between components and ensure all relevant factors are considered in the weighting process [5].
The fundamental principle of AHP involves pairwise comparisons of elements at each level of the hierarchy using a standardized scale, which converts expert judgments into numerical values that can be synthesized to derive priorities [2] [3]. This methodology is particularly valuable in ecosystem services research where multiple stakeholders often hold conflicting priorities, and trade-offs between conservation and development objectives must be carefully evaluated [5] [25]. By breaking down the complex reality of ecosystem management into manageable components, AHP helps researchers increase their comprehensive understanding of the problem, its context, and the relationships between its constituent parts [3].
Core Components of an AHP Hierarchy for Ecosystem Services
Defining the Goal
The apex of any AHP hierarchy for ecosystem services research must be a clearly articulated, overarching goal that defines what the decision-making process aims to achieve [1] [2]. This goal represents the fundamental objective that guides the entire evaluation process and should be explicitly stated to ensure all subsequent criteria and alternatives align with this primary purpose. In ecosystem services research, representative goals may include: "Prioritizing wetland conservation areas in a watershed," "Evaluating coastal management strategies for maximizing ecosystem benefits," or "Ranking forest management scenarios for biodiversity conservation and human well-being" [5].
A well-defined goal serves as the reference point for all pairwise comparisons throughout the AHP process, ensuring that judgments about the relative importance of criteria and the performance of alternatives remain consistently focused on what matters most to the decision context [3]. The goal should be sufficiently broad to encompass all relevant considerations yet specific enough to provide clear direction for the selection of criteria and alternatives. For research purposes, the goal should also reflect the spatial and temporal scales relevant to the ecosystem services being evaluated, whether local and immediate or regional and long-term [5] [25].
Establishing Criteria and Sub-criteria
Below the goal in the hierarchy reside the criteria – the factors, attributes, or considerations that define what constitutes a successful outcome relative to the goal [1] [2]. In ecosystem services research, criteria typically correspond to major categories of ecosystem services, often organized according to established classifications such as the Millennium Ecosystem Assessment framework:
- Provisioning Services: Criteria related to tangible goods obtained from ecosystems (e.g., food, fresh water, wood, fiber, genetic resources)
- Regulating Services: Criteria concerning benefits obtained from ecosystem processes (e.g., climate regulation, flood control, water purification, pollination)
- Cultural Services: Criteria encompassing non-material benefits (e.g., recreational, aesthetic, spiritual, educational)
- Supporting Services: Criteria necessary for producing all other ecosystem services (e.g., soil formation, nutrient cycling, primary production) [5]
Each major criterion can be further decomposed into sub-criteria to provide more precise definition and facilitate more accurate pairwise comparisons [1]. For instance, the regulating services criterion might be broken down into sub-criteria such as carbon sequestration, air quality regulation, and erosion control. This decomposition continues until the criteria are sufficiently detailed to enable meaningful evaluation of alternatives [3]. The hierarchical structuring of criteria and sub-criteria allows researchers to focus on comparing elements at the same level within the same branch of the hierarchy, reducing cognitive complexity while maintaining comprehensiveness [2] [3].
Identifying Alternatives
At the base of the hierarchy lie the decision alternatives – the different choices, scenarios, or options that are being evaluated against the criteria to determine which best achieves the overall goal [1]. In ecosystem services research, alternatives might include different land-use plans, policy interventions, management strategies, or conservation priorities [5] [25]. For example, in a study evaluating watershed management approaches, alternatives could include "reforestation of riparian zones," "implementation of agricultural best management practices," "wetland restoration," and "status quo management" [25].
Alternatives should be mutually exclusive (selecting one precludes selecting others), collectively exhaustive (all reasonable options are considered), and clearly defined to enable consistent evaluation against the established criteria [2] [3]. The number of alternatives should strike a balance between being comprehensive enough to capture the full range of possible decisions and being manageable within the constraints of the pairwise comparison process, which grows combinatorially with each additional alternative [1].
Table 1: Example Hierarchy Components for Ecosystem Services Assessment
| Hierarchy Level | Component Type | Ecosystem Services Examples |
|---|---|---|
| Level 1 | Goal | Prioritize watershed management strategies for multiple ecosystem services |
| Level 2 | Criteria | Provisioning Services, Regulating Services, Cultural Services, Supporting Services |
| Level 3 | Sub-criteria | Under Provisioning: Water supply, Food production, Raw materialsUnder Regulating: Water purification, Flood regulation, Climate regulationUnder Cultural: Recreation, Aesthetic value, Educational opportunities |
| Level 4 | Alternatives | Reforestation program, Wetland restoration, Agricultural best practices, Status quo |
Step-by-Step Protocol for Hierarchy Construction
Protocol: Developing the Hierarchical Structure
Purpose: To create a comprehensive hierarchical model that structures the ecosystem services decision problem into goal, criteria, sub-criteria, and alternatives.
Materials Needed: Expert knowledge of the ecosystem services domain, stakeholder input, literature on ecosystem services classification, whiteboard or diagramming software.
Procedure:
Goal Formulation Workshop: Conduct a structured workshop with domain experts and relevant stakeholders to define the overarching decision goal. Use facilitation techniques such as nominal group technique to ensure all perspectives are considered. Document the final goal statement with precise wording [1] [3].
Criteria Identification: Brainstorm all potential criteria relevant to the goal using ecosystem services frameworks as a starting point. Organize similar criteria into logical groupings. Apply the MECE principle (Mutually Exclusive, Collectively Exhaustive) to ensure criteria cover all relevant aspects without overlap [5].
Sub-criteria Development: For each major criterion, identify specific sub-criteria that capture distinct components. Limit the number of sub-criteria under each parent criterion to 5-7 to maintain cognitive manageability in subsequent pairwise comparisons [2].
Alternative Specification: Define clear, implementable alternatives that represent distinct choices. Ensure each alternative is described with sufficient detail to allow evaluation against all sub-criteria [1] [3].
Hierarchy Validation: Review the complete hierarchy with domain experts to verify logical relationships, completeness, and appropriateness for the decision context. Revise based on feedback [3].
Hierarchy Documentation: Create a visual representation of the hierarchy using tree diagrams or similar visualization tools. Document definitions for all elements to ensure consistent interpretation throughout the AHP process [1].
Troubleshooting Tips:
- If the hierarchy becomes too complex (e.g., more than 7 elements at any level), consider creating intermediate levels or grouping related elements.
- If experts disagree on hierarchy structure, document multiple perspectives and use the AHP itself to evaluate different hierarchical structures.
- If alternatives are difficult to compare directly against some criteria, consider modifying the criteria or breaking them down further into more measurable sub-criteria [2].
Visualization of AHP Hierarchy Structure
The following diagram illustrates the generic structure of an AHP hierarchy for ecosystem services research, showing the relationships between different levels:
Ecosystem Services AHP Hierarchy Structure
Experimental Protocols for Pairwise Comparisons
Protocol: Conducting Pairwise Comparisons
Purpose: To systematically compare elements at each level of the hierarchy to determine their relative importance or performance.
Materials Needed: Structured questionnaire, Saaty's 1-9 scale reference table, expert panel, data recording system.
Procedure:
Preparation of Comparison Matrices: For each level of the hierarchy, prepare pairwise comparison matrices where all elements at that level are compared against each other with respect to their parent element from the level above [1].
Expert Training: Brief participating experts on the AHP process, particularly the meaning of Saaty's 1-9 scale and the importance of consistent judgments. Provide examples of pairwise comparisons unrelated to the current decision to familiarize experts with the process [2].
Comparison Execution: Present experts with pairs of elements and ask: "With respect to [parent element], how much more important/preferred is element A compared to element B?" [1]. Experts provide numerical ratings using Saaty's scale:
Table 2: Saaty's Scale for Pairwise Comparisons [1] [2]
| Intensity of Importance | Definition | Explanation |
|---|---|---|
| 1 | Equal importance | Two criteria contribute equally to the objective |
| 3 | Moderate importance | Experience and judgment slightly favor one over another |
| 5 | Strong importance | Experience and judgment strongly favor one over another |
| 7 | Very strong importance | One criterion is favored very strongly over another |
| 9 | Extreme importance | The evidence favoring one over another is of the highest possible order of affirmation |
| 2, 4, 6, 8 | Intermediate values | Used when compromise is needed |
| Reciprocals | If element i has one of the above numbers assigned to it when compared with element j, then j has the reciprocal value when compared with i |
Data Collection: Collect comparisons for all possible pairs at each level. For n elements, this requires n(n-1)/2 comparisons [1]. Use a structured questionnaire or specialized software to ensure all comparisons are captured.
Matrix Completion: For each comparison matrix, place the comparison values in the appropriate cells. The diagonal elements are always 1 (each element compared with itself), and the lower triangle contains reciprocals of the upper triangle [1].
Group Judgment Aggregation: If multiple experts are involved, aggregate their judgments using the geometric mean method to create a single comparison matrix for the group [5].
Quality Control: Calculate consistency ratios for each comparison matrix to identify potentially inconsistent judgments. A consistency ratio below 0.10 is generally acceptable; higher values may require revision of comparisons [2].
Protocol: Calculating Priority Weights
Purpose: To derive normalized priority weights from pairwise comparison matrices that represent the relative importance of elements.
Materials Needed: Pairwise comparison matrices, calculator or software for matrix operations.
Procedure:
Matrix Normalization: Create a normalized pairwise comparison matrix by dividing each element in a column by the sum of that column [1].
Priority Vector Calculation: Compute the average of each row in the normalized matrix to obtain the priority vector (eigenvector approximation) [1] [2].
Consistency Assessment:
- Calculate the weighted sum vector by multiplying the comparison matrix by the priority vector
- Divide each element of the weighted sum vector by the corresponding element of the priority vector
- Compute the average of these values (λmax)
- Calculate the Consistency Index (CI) = (λmax - n)/(n - 1)
- Determine the Consistency Ratio (CR) = CI/RI, where RI is the Random Index (value depends on n) [2]
Hierarchical Synthesis: Combine weights throughout the hierarchy by multiplying each element's weight by the weight of its parent element, then sum these global weights for each alternative [1].
Sensitivity Analysis: Test how sensitive the final ranking of alternatives is to changes in criterion weights to identify which weights most influence the decision [25].
Research Reagent Solutions and Tools
Table 3: Essential Research Tools for AHP Implementation in Ecosystem Services
| Tool Category | Specific Solutions | Function in AHP Research | Application Notes |
|---|---|---|---|
| AHP Software | Expert Choice [2] [3] | Commercial software for AHP implementation with user-friendly interface for constructing hierarchies, conducting pairwise comparisons, and analyzing results | Automates calculations and consistency checks; suitable for complex decision hierarchies |
| Prioritization Helper [2] | Cloud-based AHP application that integrates with Salesforce platform | Enables AHP analysis within familiar business environments; good for organizational decision-making | |
| Survey Platforms | Online questionnaire tools | Administer pairwise comparisons to expert panels | Should incorporate Saaty's scale and validation checks; can use custom-developed or adapted existing platforms |
| Data Analysis Tools | Excel with AHP templates [1] | Spreadsheet-based calculations for priority derivation and consistency checking | Accessible and flexible but requires manual setup; good for smaller hierarchies |
| R or Python with AHP libraries | Programming-based implementation for customized AHP applications | Offers greatest flexibility for specialized analyses and integration with other analytical methods | |
| Visualization Tools | Diagramming software | Create visual representations of decision hierarchies | Enhances communication of hierarchical structure to stakeholders |
| Graphviz/DOT language [26] [27] | Create structured diagrams of hierarchies and relationships | Enables reproducible, programmatic generation of hierarchy visualizations |
Applications in Ecosystem Services Research
The structured hierarchy approach of AHP has been successfully applied across various ecosystem services research contexts, demonstrating its versatility and effectiveness. In urban mobility sustainability assessment, researchers used AHP to weight social indicators for evaluating mobility services, organizing criteria according to stakeholder groups: Local Community, User, Worker, Value Chain Actors, and Society [5]. This application highlighted how AHP can incorporate diverse perspectives through expert questionnaires from academic institutions, city authorities, and mobility service providers, revealing both consensus and divergence in priorities across stakeholder groups [5].
In sanitation services prioritization, a fuzzy AHP approach was developed to create a Sanitation Priority Index (SPI) for communities, incorporating criteria such as demographic factors (20.38% weight), water consumption (16.76%), wastewater reuse potential (15.40%), environmental risks (12.40%), utilities' competency (11.5%), industrial wastes risks (8.72%), socioeconomic context (5.10%), geographical constraints (4.51%), and license constraints (4.8%) [25]. This application demonstrates how AHP can handle complex sustainability decisions involving technical, economic, social, and environmental dimensions while accommodating data uncertainty through fuzzy set theory extensions [25].
For ecosystem services research specifically, AHP hierarchies have been used to balance conservation and development objectives, allocate limited resources across competing conservation priorities, and evaluate trade-offs between different types of ecosystem services [5] [25]. The methodology's strength lies in its ability to integrate quantitative data with qualitative expert judgments, making it particularly valuable for ecosystem services assessment where many benefits are difficult to monetize or quantify through traditional means.
The Analytic Hierarchy Process (AHP), developed by Thomas Saaty in the 1970s, is a structured multi-criteria decision-making (MCDM) method designed to help decision-makers evaluate multiple criteria and balance trade-offs when facing complex problems [1] [14]. Central to this methodology is the technique of pairwise comparison, which simplifies complex decisions by systematically comparing elements two at a time rather than attempting to weigh all factors simultaneously [28]. This approach aligns more naturally with human cognitive capabilities, allowing for more precise and consistent judgments [14].
The foundation of AHP rests on converting qualitative judgments into quantitative values using Saaty's 1-9 scale of relative importance [1] [28]. This scale enables decision-makers to express the intensity of their preference between two items through a standardized ratio scale, creating a pairwise comparison matrix from which criterion weights are mathematically derived [1]. The AHP method has found extensive application across numerous fields including business, government, engineering, healthcare, and environmental management, demonstrating its versatility for prioritization and decision-making in contexts ranging from vendor selection to ecosystem service valuation [5] [14].
Theoretical Foundation
The Mathematics of Pairwise Comparisons
The pairwise comparison method operates within a structured mathematical framework. In AHP, a complex decision problem is decomposed into a hierarchy comprising the main goal at the top, criteria and sub-criteria at intermediate levels, and decision alternatives at the bottom [1]. For each level of the hierarchy, a pairwise comparison matrix is constructed where elements are compared against each other with respect to their contribution to a higher-level element [28].
The pairwise comparison matrix A is defined as:
[ A = [a{ij}] = \begin{bmatrix} w1/w1 & w1/w2 & \cdots & w1/wn \ w2/w1 & w2/w2 & \cdots & w2/wn \ \vdots & \vdots & \ddots & \vdots \ wn/w1 & wn/w2 & \cdots & wn/w_n \end{bmatrix} ]
where (a{ij}) represents the relative importance of element (i) compared to element (j), and (wi) and (wj) are the weights of elements (i) and (j) respectively [28]. The matrix has two key mathematical properties: reciprocality ((a{ji} = 1/a{ij})) and consistency ((a{ik} = a{ij} \times a{jk})) [14].
The weights vector (w) is derived by solving the eigenvalue problem:
[ Aw = \lambda_{max}w ]
where (\lambda_{max}) is the principal eigenvalue of matrix A [5]. The consistency of judgments is evaluated through the Consistency Ratio (CR), which should be ≤ 0.1 to be considered acceptable [14].
Saaty's Fundamental Scale
Saaty's 1-9 scale provides a standardized framework for translating qualitative judgments into quantitative values [28]. The scale and its interpretations are detailed in Table 1.
Table 1: Saaty's 1-9 Scale for Pairwise Comparisons
| Intensity of Importance | Definition | Explanation |
|---|---|---|
| 1 | Equal importance | Two activities contribute equally to the objective |
| 2 | Weak or slight | |
| 3 | Moderate importance | Experience and judgment slightly favor one activity over another |
| 4 | Moderate plus | |
| 5 | Strong importance | Experience and judgment strongly favor one activity over another |
| 6 | Strong plus | |
| 7 | Very strong or demonstrated importance | An activity is favored very strongly over another; its dominance is demonstrated in practice |
| 8 | Very, very strong | |
| 9 | Extreme importance | The evidence favoring one activity over another is of the highest possible order of affirmation |
When element i is less important than element j, the reciprocal values (1/2, 1/3, ..., 1/9) are used [1]. This scale has been validated through both theoretical research and extensive practical application across numerous decision contexts [14] [28].
Experimental Protocol for Pairwise Comparisons
Hierarchical Structuring of the Decision Problem
The initial phase of AHP involves decomposing the complex decision problem into a hierarchical structure [1]. For ecosystem service weighting research, this entails identifying the overarching goal and breaking it down into manageable criteria and sub-criteria.
Diagram 1: Hierarchical structure for ecosystem service valuation
Data Collection Procedure
The data collection for pairwise comparisons follows a systematic protocol:
Structured Data Collection Instrument: Develop a questionnaire presenting all possible pairs of criteria or alternatives. For n elements, this results in n(n-1)/2 pairwise comparisons [5].
Standardized Instruction: Provide clear instructions to respondents, explaining the meaning of Saaty's scale values with examples relevant to the research context [5].
Pairwise Comparison Execution: Present comparisons in a randomized order to avoid sequence bias. For each pair, ask: "With respect to [overarching goal], how much more important is element A than element B?" [1]
Data Recording: Record responses directly into a pairwise comparison matrix. Digital tools can facilitate this process and provide immediate consistency feedback [28].
Consistency Verification: Calculate consistency ratio after data collection. If CR > 0.1, identify and revise inconsistent judgments [28].
Weight Calculation Methodology
The computational procedure for deriving weights from pairwise comparisons involves these steps:
Diagram 2: Weight calculation workflow from pairwise comparisons
Step-by-step computational protocol:
Construct the pairwise comparison matrix with the collected judgments [28].
Square the matrix by multiplying it by itself [1].
Calculate row totals for the squared matrix [1].
Normalize the priority vector by dividing each row total by the sum of all row totals [1] [28].
Iterate the process (repeat steps 2-4) using the resulting matrix until the weights stabilize to three or four decimal places [1].
Verify consistency using the formula:
[ CR = \frac{CI}{RI} = \frac{(\lambda_{max} - n)/(n-1)}{RI} ]
where RI is the random index value based on matrix size [28].
Worked Example for Ecosystem Service Weighting
Consider a simplified example with three ecosystem services: Carbon Sequestration (C), Water Purification (W), and Recreation (R). The pairwise comparison matrix based on expert judgments might be:
Table 2: Example Pairwise Comparison Matrix for Ecosystem Services
| Carbon Sequestration | Water Purification | Recreation | |
|---|---|---|---|
| Carbon Sequestration | 1 | 3 | 5 |
| Water Purification | 1/3 | 1 | 2 |
| Recreation | 1/5 | 1/2 | 1 |
The computational process yields:
Table 3: Weight Calculation Steps for the Example
| Step | Carbon Sequestration | Water Purification | Recreation | Description |
|---|---|---|---|---|
| Column Sums | 1.533 | 4.500 | 8.000 | Sum each column |
| Normalized Matrix | 0.652/0.652/0.652 | 0.222/0.667/0.111 | 0.625/0.250/0.125 | Divide each cell by its column sum |
| Row Averages | 0.637 | 0.258 | 0.105 | Average each row to get final weights |
The resulting weights would be: Carbon Sequestration (0.637), Water Purification (0.258), and Recreation (0.105), indicating carbon sequestration is considered the most important ecosystem service in this hypothetical scenario.
Preference elicitation methods (PEM) represent a class of research techniques designed to estimate the relative value of attributes to end users [29]. Within environmental decision-making, AHP serves as a powerful PEM by quantifying stakeholder preferences for various ecosystem services and conservation outcomes [5]. Similarly, in healthcare research, AHP has been successfully applied to integrate patient preferences into health technology assessment, demonstrating its utility for capturing quantitative dimensions of preferences for treatment endpoints [30].
The application of AHP for preference elicitation typically follows two approaches:
Direct Pairwise Comparison of Alternatives: Stakeholders compare alternatives two at a time with respect to an overarching goal [14].
Criteria-Based Evaluation: Alternatives are scored against weighted criteria, with the total score calculated through weighted summation [14].
Research Reagent Solutions for Preference Studies
Table 4: Essential Research Tools for Preference Elicitation Studies
| Research Tool | Function | Application Context |
|---|---|---|
| Structured Pairwise Comparison Questionnaire | Captures relative importance judgments using Saaty's scale | Field surveys, expert consultations, stakeholder workshops |
| AHP Software (e.g., TransparentChoice, 1000Minds) | Facilitates data collection, weight calculation, and consistency checking | Computer-based surveys, online stakeholder engagement |
| Consistency Ratio Calculator | Validates judgment consistency in pairwise comparisons | Quality control in data collection phases |
| Hierarchical Decision Model Template | Structures complex decisions into manageable components | Research design phase for ecosystem service valuation |
| Sensitivity Analysis Tools | Tests robustness of results to changes in judgments | Validation phase of preference studies |
Advanced Methodological Considerations
Managing Judgment Consistency
A critical aspect of AHP implementation is managing the consistency of pairwise comparisons. The consistency ratio (CR) measures how consistent the judgments are relative to large samples of random judgments [28]. When CR exceeds 0.1, it indicates potentially inconsistent judgments that should be reviewed [28]. Strategies to improve consistency include:
- Providing comprehensive training to respondents on the use of Saaty's scale
- Using facilitated group discussions to resolve extreme inconsistencies
- Implementing iterative data collection with feedback on consistency
- Utilizing software tools that highlight inconsistent judgments for revision [28]
Group Decision-Making Protocol
For ecosystem service weighting research, multiple stakeholders typically provide judgments. The AHP protocol for aggregating group decisions uses the geometric mean to combine individual judgments [14]:
[ a{ij(group)} = \sqrt[n]{a{ij(1)} \times a{ij(2)} \times \cdots \times a{ij(n)}} ]
This approach preserves the reciprocal property of the pairwise comparison matrix and minimizes the impact of extreme judgments [14]. The group decision-making process often involves structured workshops where stakeholders first provide individual judgments, then discuss discrepancies, and finally revise their judgments to reach consensus [5].
While AHP is a powerful preference elicitation method, researchers should consider its position within the broader landscape of preference elicitation methodologies. A systematic literature review identified 32 unique preference research methods, categorized into discrete-choice-based, indifference-, rating-, and ranking-methods [31]. Selection among these methods depends on the research question, context, and decision constraints [29] [31].
AHP is particularly advantageous when dealing with multiple criteria of different types (both quantitative and qualitative), when stakeholder engagement is crucial for decision acceptance, and when the decision structure can be clearly represented hierarchically [5]. For ecosystem service weighting, AHP provides a transparent, structured approach that effectively captures diverse stakeholder perspectives while providing a mathematically rigorous framework for combining these perspectives into coherent weight sets to inform environmental policy and management decisions.
The Analytic Hierarchy Process (AHP) is a multi-criteria decision analysis (MCDA) technique that enables decision-makers to evaluate and prioritize alternatives based on both qualitative and quantitative factors [2]. Central to the AHP methodology is the derivation of priority vectors, which quantify the relative importance or weight of criteria and alternatives within a defined hierarchy [32]. The eigenvalue method provides the mathematical foundation for calculating these priority vectors from pairwise comparison matrices, transforming subjective judgments into a reliable ratio scale [33] [2]. In ecosystem service research, where decision-makers must balance multiple, often conflicting objectives such as timber production, wildfire resistance, biodiversity conservation, and recreational value, the rigorous calculation of criterion weights ensures that final priorities accurately reflect stakeholder values and scientific understanding [34] [35].
The fundamental principle underlying the eigenvalue method is that a priority vector must satisfy the condition Aw = λw, where A is the pairwise comparison matrix, w is the priority vector (eigenvector), and λ is the eigenvalue [33]. This mathematical relationship ensures that the derived weights remain invariant under hierarchic composition, providing a consistent basis for complex decision-making in environmental management and ecosystem service valuation [34] [36].
Theoretical Foundation
Mathematical Principles of the Eigenvalue Method
In AHP, decision-makers construct reciprocal pairwise comparison matrices by comparing criteria in pairs with respect to their contribution to the overall goal [33]. For a set of n criteria, this results in an n×n matrix A where each element aij represents the relative importance of criterion i compared to criterion j. Ideally, if the decision-maker were perfectly consistent, this matrix would satisfy the condition aij = aik × akj for all i, j, k, and the matrix would have a rank of 1 [33].
For such a consistent matrix, the priority vector w can be derived by normalizing any column of the matrix, as all columns would be proportional to each other. However, in practice, human judgments are rarely perfectly consistent, and the eigenvalue method provides a robust solution for handling these inconsistencies [33]. The method solves the equation Aw = λmaxw, where λmax is the largest (principal) eigenvalue of A, and w is the corresponding principal eigenvector [33] [32]. The principal eigenvector represents the relative priorities of the criteria being compared and becomes the priority vector after normalization.
The need for the eigenvalue approach arises from the property that a priority vector should reproduce itself on a ratio scale when used in hierarchic composition [33]. As Thomas Saaty established, only the principal eigenvector satisfies this fundamental requirement for ratio scale measurement in AHP [2]. When the pairwise comparison matrix is inconsistent, the principal eigenvector provides the best approximation to the true priority vector by minimizing the inconsistency in the judgment matrix [33] [32].
Advantages Over Alternative Methods
While approximate methods such as the arithmetic mean of normalized columns (ANP) exist for calculating priority vectors, the eigenvalue method offers significant theoretical and practical advantages [32]. The eigenvalue method directly addresses the mathematical properties required for ratio scale measurement and properly handles the intransitivities that naturally occur in human judgment [33]. Research has demonstrated that the eigenvalue method remains stable under small perturbations of judgment, making it robust for practical decision-making applications [32].
In ecosystem service assessments, where stakeholders often exhibit inconsistent preferences when comparing multiple services such as water purification, carbon storage, habitat quality, and recreation [35], the eigenvalue method provides a mathematically sound approach for deriving meaningful weights from imperfect human judgments. This theoretical foundation ensures that the resulting priority vectors truly reflect the decision-makers' underlying value structure despite the presence of minor inconsistencies in direct pairwise comparisons.
Computational Protocols
Step-by-Step Calculation of Priority Vectors
The computational procedure for deriving priority vectors using the eigenvalue method follows a systematic protocol:
Step 1: Construct the Pairwise Comparison Matrix Decision-makers compare each pair of criteria using Saaty's fundamental scale of 1-9, where 1 indicates equal importance and 9 indicates extreme importance of one element over another [2]. For n criteria, this results in a reciprocal matrix A where aij > 0, aii = 1, and aji = 1/aij [33].
Step 2: Calculate the Principal Eigenvector The principal eigenvector can be approximated using the power method or normalized geometric means of rows [32]:
- Multiply the elements in each row of the matrix
- Take the nth root of each product (where n is the number of criteria)
- Normalize the resulting vector by dividing each value by the sum of all values
Step 3: Verify the Consistency of Judgments Calculate the consistency ratio (CR) to ensure that the pairwise comparisons are sufficiently consistent [2]:
- Compute the consistency index (CI) = (λmax - n)/(n - 1)
- Obtain the consistency ratio CR = CI/RI, where RI is the random index
- If CR ≤ 0.10, the consistency is acceptable; if CR > 0.10, revisions to judgments may be necessary [2]
Step 4: Normalize the Eigenvector to Obtain Priority Weights The final priority vector is obtained by normalizing the principal eigenvector so that the sum of its components equals 1 [32]. Each component of this normalized vector represents the relative weight of the corresponding criterion.
Table 1: Computational Steps for Priority Vector Derivation
| Step | Procedure | Mathematical Formulation | Output |
|---|---|---|---|
| 1 | Construct pairwise comparison matrix | aij = 1/aji, aii = 1 | Reciprocal matrix A |
| 2 | Approximate principal eigenvector | wi = (Πjaij)^(1/n)/Σk(Πjakj)^(1/n) | Unnormalized eigenvector |
| 3 | Check consistency | CI = (λmax - n)/(n - 1), CR = CI/RI | Consistency Ratio |
| 4 | Normalize eigenvector | w_normalized = w/Σwi | Priority vector |
Practical Example: Ecosystem Service Weighting
Consider a simplified ecosystem service assessment where a researcher compares three criteria: Water Purification (WP), Carbon Storage (CS), and Habitat Quality (HQ). The pairwise comparison matrix based on stakeholder judgments might be:
Table 2: Example Pairwise Comparison Matrix for Ecosystem Services
| Criterion | WP | CS | HQ |
|---|---|---|---|
| WP | 1 | 3 | 2 |
| CS | 1/3 | 1 | 1/2 |
| HQ | 1/2 | 2 | 1 |
Following the computational protocol:
- Multiply row elements: WP = 1×3×2 = 6; CS = (1/3)×1×(1/2) = 1/6; HQ = (1/2)×2×1 = 1
- Take the cubic root: WP = ∛6 ≈ 1.817; CS = ∛(1/6) ≈ 0.550; HQ = ∛1 = 1
- Sum these values: 1.817 + 0.550 + 1 = 3.367
- Normalize: WP = 1.817/3.367 ≈ 0.540; CS = 0.550/3.367 ≈ 0.163; HQ = 1/3.367 ≈ 0.297
The resulting priority vector indicates that Water Purification (54.0%) is the most important criterion, followed by Habitat Quality (29.7%) and Carbon Storage (16.3%). The consistency of this result should be verified through calculation of the consistency ratio [32].
Application in Ecosystem Service Research
Integration with Ecosystem Service Assessment Frameworks
The eigenvalue method for calculating criterion weights has been successfully integrated into various ecosystem service assessment frameworks across diverse geographical contexts. Researchers have combined AHP with geographic information systems (GIS) to map and evaluate ecosystem service provision capacity, using the derived weights to aggregate multiple indicators into comprehensive assessment indices [36] [35].
In Tuscany, Italy, a study employed AHP to weight five ecosystem services—food production, water regulation, soil conservation, carbon sequestration, and recreational value—for spatial planning applications [36]. The priority vectors derived through the eigenvalue method enabled the creation of ecosystem service bundles, identifying spatial patterns of synergies and trade-offs across the landscape. This approach provided a scientifically sound basis for targeted governance models and management strategies in different territorial contexts [36].
Similarly, in Portugal, the ASEBIO index (Assessment of Ecosystem Services and Biodiversity) integrated eight ecosystem service indicators using weights defined by stakeholders through AHP [35]. The eigenvalue method ensured that the resulting priority vectors accurately reflected stakeholders' perceptions of the relative importance of different services, including climate regulation, water purification, habitat quality, and erosion prevention. This integrated approach revealed significant spatial-temporal changes in ecosystem services from 1990 to 2018, informing sustainable land-use planning decisions [35].
Addressing Complex Trade-offs in Environmental Management
Ecosystem service management frequently involves navigating complex trade-offs between competing objectives, such as balancing agricultural production with conservation goals [16]. The eigenvalue method provides a structured approach to quantify the relative importance of these competing objectives, facilitating more transparent and defensible decision-making.
In the Loess Plateau of China, researchers applied AHP to evaluate trade-offs between provisioning ecosystem services (crop yields) and regulating/supporting services (water yield, soil conservation, carbon sequestration, biodiversity) under different land management scenarios [16]. The priority vectors derived through the eigenvalue method enabled a comprehensive assessment of how ecological restoration, sustainable intensification, and business-as-usual scenarios affected the balance between agricultural production and ecosystem conservation. The resulting weights helped identify management strategies that aligned with United Nations Sustainable Development Goals by simultaneously addressing food security and environmental sustainability [16].
Diagram 1: AHP Workflow for Ecosystem Service Assessment
Essential Research Reagents and Computational Tools
Software Solutions for AHP Implementation
While the eigenvalue method can be implemented manually for small matrices, ecosystem service research typically involves complex hierarchies with multiple criteria and alternatives, necessitating specialized software tools for efficient computation.
Table 3: Essential Research Tools for AHP Implementation
| Tool Name | Type | Primary Function | Application Context |
|---|---|---|---|
| Expert Choice | Commercial Software | Comprehensive AHP implementation with visualization | Full AHP process from hierarchy design to sensitivity analysis [37] [2] |
| R Statistical Language | Open-source Programming | Custom implementation of eigenvalue calculation | Research requiring reproducible analysis and integration with spatial models [16] |
| Python with NumPy/SciPy | Open-source Programming | Eigenvalue decomposition and matrix operations | Custom ecosystem service models integrating AHP with other analytical methods [35] |
| Google Sheets/Excel | Spreadsheet Software | Basic matrix operations and eigenvector approximation | Preliminary analysis and educational applications [32] |
| InVEST Model | Specialized Ecosystem Software | Integrated AHP for ecosystem service weighting | Spatial ecosystem service assessment combining biophysical models with stakeholder preferences [8] [16] |
Integration with Ecosystem Service Assessment Models
Modern ecosystem service assessments increasingly combine the AHP methodology with specialized biophysical models to create more comprehensive evaluation frameworks. The Natural Capital Project's InVEST (Integrated Valuation of Ecosystem Services and Tradeoffs) model exemplifies this integration, combining spatially explicit ecosystem service quantification with multi-criteria decision analysis [8] [16]. Similarly, researchers have coupled AHP with land use change models, biodiversity assessment tools, and economic valuation methods to address the complex, multi-dimensional nature of environmental management decisions [36] [35].
The eigenvalue method serves as a critical bridge between qualitative stakeholder preferences and quantitative ecosystem service metrics, enabling the integration of diverse data types into a coherent decision-making framework. This integration is particularly valuable in participatory planning processes, where the transparency and mathematical rigor of the eigenvalue method help build consensus among diverse stakeholders with potentially conflicting priorities [34] [35].
Diagram 2: Matrix Mathematics of Eigenvalue Method
The eigenvalue method for calculating criterion weights and priority vectors represents a mathematically rigorous approach for transforming subjective pairwise comparisons into ratio-scale priorities within the AHP framework. In ecosystem service research, this method provides a transparent and consistent foundation for integrating diverse stakeholder perspectives, scientific data, and management priorities into comprehensive decision-support systems. The computational protocol outlined in this application note—encompassing matrix construction, eigenvector calculation, consistency verification, and weight normalization—enables researchers to derive reliable priority vectors that accurately reflect the relative importance of multiple ecosystem services. As environmental management increasingly requires balancing complex, often competing objectives, the eigenvalue method offers a valuable tool for creating structured, defensible, and participatory decision-making processes that can effectively integrate both scientific evidence and human values.
Within the framework of a broader thesis on the application of the Analytic Hierarchy Process (AHP) for ecosystem service weighting research, establishing and verifying the consistency of expert judgments is a critical pillar of methodological rigor. The AHP, a multi-criteria decision-making (MCDM) method developed by Thomas Saaty in the 1970s, employs pairwise comparisons to derive ratio scales of relative importance for criteria and alternatives [2] [1]. For researchers and scientists quantifying the value of provisioning, regulating, and cultural services, the integrity of the resulting weights hinges directly on the logical coherence of these pairwise comparisons. Consistency, in this context, refers to the conformity of judgments with a fundamental axiom of the AHP: if Criterion A is deemed more important than Criterion B, and Criterion B is more important than Criterion C, then Criterion A must be more important than Criterion C [38]. A perfectly consistent pairwise comparison matrix satisfies the condition that aij × ajk = aik for all i, j, and k [38].
However, in practical research settings, especially when evaluating complex systems like ecosystems, human judgments are inherently prone to some degree of inconsistency. The Consistency Ratio (CR) is, therefore, not merely a statistical metric but a essential diagnostic tool. It serves as an indicator of the quality of the input data and the reliability of the derived priority weights [38]. For drug development professionals and environmental scientists alike, a high CR can signal potential errors in judgment, a misunderstanding of the criteria, or a cognitive overload that compromises the decision model's validity. This application note provides a detailed protocol for measuring, interpreting, and improving the Consistency Ratio, specifically tailored for the context of ecosystem service research.
Theoretical Foundations and Quantitative Measures
The Mathematical Pathway to the Consistency Ratio
The calculation of the Consistency Ratio is built upon a solid mathematical foundation, leveraging concepts from linear algebra. The process begins with the construction of a pairwise comparison matrix (A), where each element aij represents the relative importance of element i over element j, as judged by an expert using Saaty's established 1-9 scale [2] [38]. The principal right eigenvector (w) of this matrix is then computed, which represents the priority vector or the relative weights of the elements being compared. Simultaneously, the maximum eigenvalue (λmax) of the matrix is derived. For a perfectly consistent matrix of order n, λmax is exactly equal to n [39] [38].
Table 1: Key Mathematical Definitions in Consistency Measurement
| Term | Symbol | Definition | Role in AHP |
|---|---|---|---|
| Pairwise Comparison Matrix | A | A positive, reciprocal matrix where aij = 1/aji and aii = 1. | Captures the decision-maker's graded judgments between all pairs of elements [39]. |
| Maximum Eigenvalue | λmax | The largest eigenvalue of matrix A. | A scalar value used as the basis for measuring deviation from consistency [38]. |
| Eigenvector | w | The principal eigenvector of matrix A. | When normalized, provides the priority vector (weights) for the criteria or alternatives [39]. |
| Consistency Index | CI | CI = (λmax - n) / (n - 1) | Quantifies the degree of inconsistency in the single matrix [38]. |
| Random Index | RI | The average CI of a large number of randomly generated reciprocal matrices of order n. | Serves as a baseline or benchmark for comparison [38]. |
| Consistency Ratio | CR | CR = CI / RI | The final, normalized metric used to accept or reject the consistency of the judgments [38]. |
Deviations from perfect consistency are measured using the Consistency Index (CI), calculated as CI = (λmax - n) / (n - 1). A CI of zero indicates perfect consistency [38]. To contextualize this value, it is compared against the Random Index (RI), which is the average CI obtained from a large number of randomly generated matrices of the same order. The ratio of CI to RI yields the final Consistency Ratio (CR) [38].
Reference Values and Interpretation Thresholds
The value of the Random Index (RI) is dependent on the order of the matrix (n), as larger matrices have a higher probability of random inconsistency. The following table provides the generally accepted RI values for matrices of different sizes, which are critical for researchers to have on hand when performing their calculations.
Table 2: Random Index (RI) Values for Different Matrix Sizes
| Matrix Order (n) | Random Index (RI) |
|---|---|
| 1 | 0.00 |
| 2 | 0.00 |
| 3 | 0.58 |
| 4 | 0.90 |
| 5 | 1.12 |
| 6 | 1.24 |
| 7 | 1.32 |
| 8 | 1.41 |
| 9 | 1.45 |
| 10 | 1.49 |
The established rule of thumb, as defined by Saaty, is that a CR ≤ 0.10 or 10% is acceptable [38]. A CR within this threshold indicates that the pairwise comparisons are sufficiently consistent and that the derived weights can be considered reliable for decision-making. A CR exceeding 0.10 suggests a level of inconsistency that may produce misleading results. In such cases, the protocol dictates that the decision-maker should review and revise their judgments in the pairwise comparison matrix [38]. For matrices of order 3, a slightly higher threshold of 0.05 (5%) is sometimes applied, and for order 4, a threshold of 0.08 (8%) may be used, but the 0.10 standard is the most universally recognized [38].
Experimental Protocol for Consistency Verification
This section provides a step-by-step methodological protocol for calculating and verifying the Consistency Ratio within an ecosystem service weighting study.
Workflow for Consistency Assessment
The following diagram illustrates the end-to-end workflow for establishing consistency in an AHP study, from data collection to final validation.
Step-by-Step Calculation Methodology
Step 1: Construct the Pairwise Comparison Matrix After structuring the hierarchy for ecosystem service weighting (e.g., with criteria like "Carbon Sequestration," "Water Purification," "Biodiversity," and "Recreational Value"), the researcher fills in an n x n matrix. The matrix is reciprocal, meaning if the value for row i, column j is 3, the value for row j, column i must be 1/3 [1].
Step 2: Derive the Priority Vector and λmax
- Manual/Eigenvalue Method: The priority vector (w) is found by calculating the normalized principal eigenvector of the matrix. The maximum eigenvalue (λmax) is then calculated from the matrix and its eigenvector. Software like R, MATLAB, or specialized AHP tools (e.g., Expert Choice, TransparentChoice) perform this calculation automatically [2] [14].
- Approximation Method (For Protocol Illustration): A common approximation involves: a) squaring the matrix, b) summing each row, c) normalizing the row sums to get an initial priority vector, and d) iterating this process until the vector stabilizes. The λmax can be approximated by averaging the results of Aw / w for each criterion [1].
Step 3: Calculate the Consistency Index (CI) Using the formula CI = (λmax - n) / (n - 1), compute the CI. For example, for a 4x4 matrix (n=4) with a calculated λmax of 4.25, the CI would be (4.25 - 4) / (4 - 1) = 0.25 / 3 ≈ 0.0833.
Step 4: Determine the Consistency Ratio (CR) Look up the Random Index (RI) from Table 2 for n=4, which is 0.90. Then, CR = CI / RI = 0.0833 / 0.90 ≈ 0.0926. Since 0.0926 < 0.10, the consistency of the pairwise comparisons is deemed acceptable.
The Scientist's Toolkit: Essential Research Reagents and Solutions
For researchers implementing AHP in ecosystem service studies, the "reagents" are the conceptual and software tools that facilitate robust analysis.
Table 3: Key Research Reagent Solutions for AHP Consistency Analysis
| Tool Category | Example | Function in Consistency Analysis |
|---|---|---|
| Specialized AHP Software | Expert Choice [2], TransparentChoice [14] | Automates the calculation of eigenvectors, λmax, CI, and CR, providing immediate consistency feedback during data entry. |
| General Mathematical Software | R, MATLAB, Python (with NumPy/SciPy) | Offers libraries and functions for eigenvalue calculation, allowing for custom scripting and integration into larger analytical workflows. |
| Structured Data Collection Platforms | Online survey tools with pairwise comparison widgets (e.g., 1000minds [1]) | Presents pairwise comparison questions systematically to respondents and can be integrated with back-end calculation engines to check consistency in real-time or post-hoc. |
| The Random Index (RI) Table | Standard RI Table (See Table 2) | The essential benchmark without which the CR cannot be interpreted. Serves as the calibration standard for the consistency measurement instrument. |
| Consistency Improvement Protocols | Guided revision techniques [38] | Provide a systematic methodology (as opposed to arbitrary guessing) for identifying and correcting the most inconsistent judgments in a matrix. |
Advanced Application: A Worked Example and Improvement Techniques
Worked Example for a Three-Criteria System
Consider a simplified ecosystem service weighting problem with three criteria: C1: Food Provision, C2: Climate Regulation, and C3: Aesthetic Value. An expert provides the following pairwise comparison matrix:
Table 4: Example Pairwise Comparison Matrix and Calculations
| C1 | C2 | C3 | Priority Vector (w) | |
|---|---|---|---|---|
| C1 | 1 | 1/3 | 2 | 0.25 |
| C2 | 3 | 1 | 5 | 0.63 |
| C3 | 1/2 | 1/5 | 1 | 0.12 |
To find λmax:
- Multiply matrix A by the priority vector w:
- First row: (1)(0.25) + (1/3)(0.63) + (2)(0.12) = 0.25 + 0.21 + 0.24 = 0.70
- Second row: (3)(0.25) + (1)(0.63) + (5)(0.12) = 0.75 + 0.63 + 0.60 = 1.98
- Third row: (1/2)(0.25) + (1/5)(0.63) + (1)(0.12) = 0.125 + 0.126 + 0.12 = 0.371
- Divide the resulting vector by w:
- 0.70 / 0.25 = 2.80
- 1.98 / 0.63 = 3.14
- 0.371 / 0.12 = 3.09
- λmax is the average of these values: (2.80 + 3.14 + 3.09) / 3 ≈ 3.01
Now, calculate CI and CR (RI for n=3 is 0.58):
- CI = (3.01 - 3) / (3 - 1) = 0.01 / 2 = 0.005
- CR = 0.005 / 0.58 ≈ 0.009
Since CR ≈ 0.009 << 0.10, the judgments are highly consistent.
Protocol for Consistency Improvement
When the CR exceeds 0.10, a systematic review is necessary. The following steps are recommended [38]:
- Identify the Most Problematic Judgment: Software often highlights the comparison that, if changed, would most improve consistency. Alternatively, calculate the consistency of each triple of criteria (aij × ajk ≈ aik?) to locate the largest deviations.
- Re-evaluate the Highlighted Judgment: Revisit the specific pairwise comparison. Ask the expert to justify their rating. Often, the inconsistency arises from a momentary lapse in concentration or a misunderstanding of the scale.
- Make a Minimal Adjustment: Adjust the identified value (e.g., change a '5' to a '4' or a '6') and recalculate the CR. The goal is not to force consistency but to help the expert align their judgments more closely with their own underlying value structure.
- Iterate if Necessary: Repeat steps 1-3 until an acceptable CR is achieved. Document all changes made to ensure the transparency and auditability of the research process.
Managing forest landscapes requires balancing diverse, and often conflicting, ecological, economic, and social objectives. The Analytical Hierarchy Process (AHP) within a Multi-Criteria Decision Analysis (MCDA) framework provides a structured, transparent method to rank alternative management scenarios by integrating quantitative data with stakeholder preferences [34] [40]. This approach is particularly valuable for operationalizing high-level policy goals, such as Sweden's Forestry Act which gives "equal priority to production and environmental goals," into actionable management plans [41]. This case study details the application of a hybrid AHP-MCDA protocol to rank forest management scenarios in Vale do Sousa, Portugal, serving as a reference for researchers applying similar methods in ecosystem service weighting research.
Case Study Background and Experimental Setup
Study Area and Problem Definition
The study was conducted in the Vale do Sousa region, a collaborative forest management area (ZIF) in North-Western Portugal. A primary challenge in this area is integrating the diverse interests of multiple stakeholders—including private landowners, industry representatives, and environmental groups—into a coherent management strategy [40]. The goal was to define a landscape-level management plan that reconciled objectives such as timber production, wildfire risk reduction, and the provision of cultural ecosystem services.
Scenario Formulation using Optimization
Five distinct landscape-level management scenarios were developed as alternatives for evaluation. Each scenario was designed using Linear Programming (LP) optimization to maximize or minimize a single key ecosystem service [34]:
- Scenario A: Maximization of Timber Production
- Scenario B: Maximization of Carbon Sequestration
- Scenario C: Maximization of Wildfire Resistance
- Scenario D: Maximization of Biodiversity Promotion
- Scenario E: Minimization of Management Costs
Experimental Protocols and Methodological Workflow
The methodology combines optimization, stakeholder preference elicitation, and multi-criteria evaluation. The workflow is summarized in the diagram below.
Objective: To quantitatively determine the relative importance weights of selected ecosystem service criteria based on stakeholder values [40].
Step-by-Step Procedure:
- Criteria Identification and Hierarchy Construction:
- Engage stakeholders in a participatory workshop to identify relevant evaluation criteria and sub-criteria.
- Structure these into a decision hierarchy. The top goal is "Selecting the Best Forest Management Scenario." Primary criteria may include
Income,Risks,Biodiversity, andCultural Services[40].
Design of the AHP Survey:
- Develop a questionnaire presenting all possible pairwise comparisons between criteria at the same hierarchical level.
- Use the standard Saaty's 9-point preference scale (1 = equal importance, 9 = extreme importance) for respondents to indicate their preference [42].
Survey Administration and Data Collection:
- Distribute the survey to a representative group of stakeholders (e.g., 25 participants as in the case study [34]).
- Data collection can be performed online or in person.
Calculation of Priority Weights:
- For each respondent's pairwise comparison matrix, calculate the principal eigenvector to derive the local priority weights for each criterion.
- Check the Consistency Ratio (C.R.) to ensure logical judgments (C.R. < 0.10 is generally acceptable).
- Aggregate individual weights across the stakeholder group using a geometric mean to produce a single set of group priority weights [40].
Protocol 2: Multi-Criteria Scenario Evaluation and Ranking
Objective: To synthesize scenario performance data with stakeholder-derived weights to produce a final ranking of management scenarios [34].
Step-by-Step Procedure:
- Construction of the Performance Matrix:
- Create a matrix where rows represent the five management scenarios (A-E) and columns represent the evaluation criteria.
- Populate the matrix with quantitative data on the performance of each scenario for each criterion. This data is typically output from the Linear Programming models or simulation tools [41] [34].
Normalization of Criteria Performance:
- Normalize the performance values across scenarios to a common scale (e.g., 0-1) to allow for comparison between criteria measured in different units. Linear normalization methods are commonly used.
Calculation of Weighted Scores:
- Multiply the normalized performance matrix by the AHP-derived criteria weights to obtain a weighted score for each scenario on each criterion.
- Sum the weighted scores across all criteria for each scenario to compute a final overall priority score.
Scenario Ranking and Sensitivity Analysis:
- Rank the scenarios based on their final priority scores.
- Conduct a sensitivity analysis to test the robustness of the ranking. This involves varying the input weights to see if the top-ranked scenario changes under different preference assumptions [41].
Data Presentation and Results
Stakeholder-Defined Criteria Weights
The following table presents the criteria and the relative importance weights derived from the AHP survey of stakeholders in the Vale do Sousa case study [40].
Table 1: AHP-derived weights for ecosystem service criteria.
| Primary Criterion | Weight (%) | Sub-Criterion | Weight (%) |
|---|---|---|---|
| Income | 56.8 | Diversification of Income Sources | 100.0 |
| Risks | 21.6 | Wildfire Risk Reduction | 100.0 |
| Biodiversity | 13.5 | Habitat Quality | 50.0 |
| Structural Diversity | 50.0 | ||
| Cultural Services | 8.1 | Leisure & Recreation | 100.0 |
Scenario Performance and Final Ranking
The table below provides a simplified, illustrative example of the performance matrix and final ranking based on the synthesized methodology [34].
Table 2: Performance matrix and final ranking of management scenarios.
| Management Scenario | Timber Production (Normalized) | Wildfire Resistance (Normalized) | Carbon Sequestration (Normalized) | ... | Final Priority Score | Rank |
|---|---|---|---|---|---|---|
| A: Max Timber | 1.00 | 0.35 | 0.40 | ... | 0.75 | 1 |
| C: Max Wildfire Resistance | 0.55 | 1.00 | 0.65 | ... | 0.62 | 2 |
| B: Max Carbon | 0.45 | 0.70 | 1.00 | ... | 0.51 | 3 |
| D: Max Biodiversity | 0.30 | 0.80 | 0.90 | ... | 0.43 | 4 |
| E: Min Cost | 0.60 | 0.50 | 0.30 | ... | 0.38 | 5 |
The Scientist's Toolkit: Essential Research Reagents and Solutions
This table outlines key "research reagents"—the essential methodological components and tools required to implement this protocol.
Table 3: Key reagents and computational tools for AHP-MCDA analysis.
| Research Reagent | Function / Description | Example Solutions / Software |
|---|---|---|
| Stakeholder Panel | Provides the source of preference data via pairwise comparisons. | Representatives from forestry, conservation, industry, and community groups [40]. |
| AHP Survey Instrument | The tool for eliciting stakeholder judgments. | Structured questionnaire with pairwise comparison matrices [42]. |
| Decision Support Software | Computes priority weights from AHP matrices and performs MCDA. | Expert Choice, Criterium Decision Plus (CDP), R (ahp package), MATLAB (Re-AHP Tool) [43] [34]. |
| Forest Growth & Yield Simulator | Generates quantitative data on ecosystem service provision under different scenarios. | FORMES, Heureka, SIMO; or optimization-based frameworks using Linear Programming [34] [44]. |
| GIS Platform | Provides spatial data, analysis, and visualization capabilities. | ArcGIS, QGIS (for spatially explicit analyses and map production) [45] [44]. |
This application note demonstrates that combining the Analytical Hierarchy Process (AHP) with Multi-Criteria Decision Analysis (MCDA) creates a robust, transparent framework for ranking complex forest management scenarios. The Vale do Sousa case study proves that this hybrid method effectively integrates objective biophysical data with subjective social values, providing a clear audit trail for decision-making. The resulting ranking showed that a scenario maximizing timber production was preferred when stakeholder-defined weights were applied, whereas a scenario maximizing wildfire resistance ranked highest under equal weighting, underscoring the critical influence of value judgments in forest management outcomes [34]. This protocol offers researchers and land managers a replicable pathway to navigate trade-offs and support participatory, evidence-based landscape planning.
The Analytic Hierarchy Process (AHP) provides a structured framework for prioritizing ecosystem services (ES) in environmental decision-making. This multi-criteria decision analysis (MCDA) method, developed by Thomas Saaty, is particularly valuable for resolving complex trade-offs involving socio-political, environmental, and economic factors [46] [1]. Effective tree management strategies must account for significant differences in how ecosystem services are valued across geographic contexts. While global tree canopy cover diminishes due to urbanization and agricultural expansion, protection strategies require moving beyond simply increasing tree cover to consider specific benefits trees provide to local communities [46]. This case study applies the AHP methodology to examine how ecosystem service prioritization differs between urban and rural contexts, providing researchers with a protocol for conducting similar analyses in varied geographical settings.
Theoretical Framework and Key Concepts
The Analytic Hierarchy Process (AHP) in Environmental Decision-Making
The AHP method breaks down complex decision problems into hierarchical structures, enabling systematic evaluation of multiple criteria and alternatives. The process operates through five key steps: structuring the hierarchy, pairwise comparison of criteria, weight calculation, alternative evaluation, and final ranking [1]. In ecosystem services assessment, AHP helps objectify decision-making by incorporating both expert knowledge and stakeholder values, thereby addressing the "ambiguous selection and prioritization of criteria" that often complicates environmental management [46]. The method's capacity to handle numerous criteria of various types—both quantitative measurable data and qualitative subjective assessments—makes it particularly suitable for ecosystem service valuation [5].
Urban-Rural Differentiation in Ecosystem Service Perception
Significant differences exist between urban and rural areas in how ecosystem services are perceived and valued. Research indicates that societal perception of ES differs substantially based on geographic context [46]. For example, in the Hexi Corridor Region in China, farmland irrigation emerged as the most crucial ecosystem service for rural residents, while recreation ecosystem services (RES) held greater value for urban populations [46]. These distinctions arise from varying dependencies on natural resources, different lifestyle requirements, and disparate environmental challenges faced by urban versus rural communities. Understanding these differentiated priorities is essential for developing targeted policies that reflect local values and needs rather than applying uniform management strategies across diverse landscapes.
Methodology: AHP Protocol for Ecosystem Service Prioritization
Hierarchical Structure Development
The first protocol step involves organizing the decision problem into a hierarchical structure comprising three primary levels:
- Level 1: Over-arching goal (e.g., "Prioritize ecosystem services for urban tree management")
- Level 2: Criteria (ecosystem service categories: provisioning, regulating, habitat, cultural)
- Level 3: Alternatives (specific ecosystem services within each category) [1]
For comprehensive ecosystem service assessment, researchers should include representatives from all four ES classes: provisioning, regulating, habitat, and cultural services [46]. The hierarchy can be further refined with sub-criteria as needed to capture the complexity of ecosystem service interactions.
Pairwise Comparison Procedure
The pairwise comparison process requires decision-makers to evaluate criteria and alternatives against each other in pairs. This assessment uses a standardized nine-point preference scale ranging from 1 (equally important) to 9 (extremely more important) [1]. The process involves:
- Creating a pairwise comparison matrix with criteria listed across both axes
- Systematically comparing each criterion pair using the fundamental preference scale
- Ensuring reciprocal values for opposite comparisons (e.g., if A is 3× more important than B, then B is 1/3 as important as A) [1]
Table: AHP Preference Scale for Pairwise Comparisons
| Intensity of Importance | Definition | Explanation |
|---|---|---|
| 1 | Equal importance | Two activities contribute equally to the objective |
| 3 | Moderate importance | Experience and judgment slightly favor one activity over another |
| 5 | Strong importance | Experience and judgment strongly favor one activity over another |
| 7 | Very strong importance | An activity is strongly favored and its dominance demonstrated in practice |
| 9 | Extreme importance | The evidence favoring one activity over another is of the highest possible order of affirmation |
| 2,4,6,8 | Intermediate values | Used when compromise is needed |
For ecosystem service assessments, these comparisons should be conducted through expert surveys or focus group discussions with relevant stakeholders [46] [5]. Sample size should be sufficient to establish reliable priorities, with one study citing 48 experts across different stakeholder groups as adequate [5].
Weight Calculation and Consistency Assessment
Following pairwise comparisons, criterion weights are derived using mathematical procedures. The Approximate Eigen Vector method provides a valid approximation when the comparison matrix has low inconsistency [15]. This method involves:
- Normalizing the pairwise comparison matrix columns
- Calculating row averages to obtain priority vectors
- Checking consistency ratio to ensure judgment reliability [15]
The Geometric Mean method offers an alternative calculation approach, particularly useful for aggregating group decisions [15]. Researchers must compute the consistency ratio to identify potential judgment inconsistencies, with values below 0.10 generally indicating acceptable consistency [15].
AHP Workflow for ES Prioritization
Application Notes: Urban-Rural Case Study Implementation
Experimental Design and Sampling Strategy
Implementing the AHP protocol for urban-rural differentiation requires careful research design. The case study referenced in the search results employed expert knowledge through focus group discussions to compare rural and urban areas [46]. Researchers should consider stratified sampling across these key expert groups:
- Academic researchers in forestry, urban planning, or ecology
- Government officials responsible for environmental management
- Local community representatives from both urban and rural areas
- Environmental NGO professionals [5]
Sample size should be determined based on statistical power requirements, with one successful implementation engaging 48 experts across three stakeholder groups [5]. Data collection typically occurs through structured surveys administered during a defined period (e.g., 4 months) to ensure consistency [5].
Ecosystem Service Selection and Definition
Comprehensive assessment requires inclusion of diverse ecosystem services across four standard categories. The referenced study evaluated 17 ecosystem services representing provisioning, regulating, habitat, and cultural service classes [46]. Researchers should provide clear definitions and examples for each service to ensure consistent understanding among participants, particularly when comparing across different geographic contexts where terminology may vary.
Table: Ecosystem Service Categories and Examples for AHP Assessment
| ES Category | Specific Services | Urban Relevance | Rural Relevance |
|---|---|---|---|
| Provisioning | Wood, fruits, freshwater | Low to moderate | High |
| Regulating | Air purification, climate regulation, runoff retention | High | Moderate to high |
| Habitat | Biodiversity support, nurseries | Moderate (fragmented) | High (connected) |
| Cultural | Aesthetic value, recreation, mental health | High | Moderate |
Data Collection Instrument Design
Effective AHP implementation requires carefully designed data collection instruments. The survey should include:
- Background information explaining the study purpose and AHP methodology
- Clear instructions with completed examples of pairwise comparisons
- Brief explanations of each ecosystem service being evaluated
- Structured pairwise comparison matrices for all criteria and sub-criteria [5]
The questionnaire should present pairwise comparisons with the standard question: "With respect to improving sustainability performance [of trees], which of the two criteria on each row is more important and how much more important is it?" [5]. Online survey tools can facilitate data collection and reduce calculation errors.
Results and Interpretation: Urban-Rural Differentiation Findings
Comparative Priority Analysis
Research findings consistently demonstrate significant differences in ecosystem service prioritization between urban and rural contexts. The regulating services, particularly air purification and heat mitigation, typically receive higher rankings in urban areas due to concentration of pollution sources and urban heat island effects [46] [47]. In contrast, rural prioritization often emphasizes provisioning services (wood, fruits) and habitat services supporting biodiversity and agricultural systems [46].
These differences reflect varying dependencies on natural systems and disparate environmental challenges. Urban populations, distanced from direct production of resources, tend to value regulating and cultural services that enhance quality of life in densely populated environments. Rural communities, often more directly dependent on local natural resources for livelihoods, prioritize provisioning and supporting services [46].
Quantitative Weight Differentiation
The AHP methodology generates quantitative weights that clearly illustrate urban-rural priority differences. While the specific weight distributions vary by region, the pattern of differentiated preferences remains consistent across geographic contexts.
Table: Sample Urban-Rural Priority Weights for Ecosystem Service Categories
| Ecosystem Service Category | Urban Weight | Rural Weight | Differentiation Significance |
|---|---|---|---|
| Provisioning Services | 0.15 | 0.35 | High |
| Regulating Services | 0.40 | 0.25 | Medium |
| Habitat Services | 0.20 | 0.25 | Low |
| Cultural Services | 0.25 | 0.15 | Medium |
| Total | 1.00 | 1.00 |
These quantitative differences highlight where tailored policy approaches are most needed. The substantial gap in provisioning service valuation suggests rural tree management should emphasize sustainable harvesting and non-timber forest products, while urban forestry might focus more on pollution control and microclimate regulation.
The Scientist's Toolkit: Research Reagent Solutions
Analytical Tools and Software
Research Toolkit Integration
Table: Essential Research Tools for AHP Ecosystem Service Studies
| Tool Category | Specific Solutions | Application Function |
|---|---|---|
| AHP Software | SpiceLogic AHP, 1000minds | Facilitates pairwise comparisons, weight calculations, and consistency testing [1] [15] |
| Spatial Analysis | ArcGIS, QGIS, Remote Sensing Data | Maps ecosystem service provision, identifies urban-rural gradients, and visualizes results [46] |
| Ecosystem Service Models | i-Tree Eco, RHESSys | Quantifies specific ecosystem services (carbon sequestration, water retention) for input to AHP [46] [47] |
| Statistical Packages | R, SPSS, Python | Analyzes expert response patterns, tests for significant differences, and models uncertainty [48] |
| Survey Platforms | Online questionnaire tools | Administers pairwise comparison surveys to expert panels across geographic locations [5] |
Field Assessment Equipment
For studies incorporating primary ecosystem service measurements, additional field equipment is necessary:
- Dendrometers for measuring urban versus rural tree growth rates
- Portable gas exchange systems for quantifying transpiration and carbon sequestration
- Soil moisture sensors for monitoring water regulation services
- Air quality monitors for measuring pollution removal by trees [49] [47]
Recent research indicates that urban trees grow significantly faster than rural trees despite environmental stressors, highlighting the importance of direct measurement rather than assumption in ecosystem service assessments [49].
Advanced Protocol: Addressing Uncertainty and Trade-offs
Uncertainty Assessment in AHP Results
Ecosystem service assessments inherently contain uncertainties that researchers must acknowledge and address. Multiple sources of uncertainty include:
- Model structure uncertainty in how ecosystem services are represented
- Parameter uncertainty in quantitative service measurements
- Decision uncertainty in expert judgments during pairwise comparisons [48]
Protocols should incorporate sensitivity analysis to test how weight variations affect final priorities. The Consistency Ratio provided by AHP calculations offers one metric for evaluating judgment reliability, with values below 0.10 indicating acceptable consistency [15]. For more robust uncertainty handling, researchers can create ensemble predictions by combining multiple ecosystem service models, which has been shown to increase accuracy by 5-17% compared to individual models [50].
Analyzing Ecosystem Service Trade-offs
The AHP methodology naturally reveals trade-offs between different ecosystem services, which often vary between urban and rural contexts. Common trade-offs include:
- Water use versus heat mitigation: Irrigation maintains tree health and cooling services but conflicts with water conservation during drought [47]
- Carbon sequestration versus biodiversity: Single-species plantings may optimize carbon storage but reduce habitat value
- Aesthetic values versus provisioning services: Ornamental species versus fruit-producing trees
Researchers should explicitly document these trade-offs through trade-off matrices that show how emphasis on one service affects others across urban and rural settings. During drought conditions, for example, research shows that reducing irrigation by up to 25% has minimal effects on tree primary productivity while conserving water, indicating a non-linear relationship that can be optimized [47].
The application of AHP to ecosystem service prioritization reveals fundamental differences between urban and rural contexts that should inform differentiated tree management policies. Effective protection strategies must look beyond simply increasing general tree cover to consider specific benefits trees provide to local communities [46]. The structured AHP protocol provides a reproducible methodology for researchers to quantify these differentiated priorities across diverse geographic contexts.
Policy applications include:
- Differentiated urban forestry programs emphasizing regulating and cultural services
- Rural tree management strategies supporting provisioning and habitat services
- Tailored conservation incentives reflecting local community values
- Adaptive management approaches that acknowledge changing priorities along urban-rural gradients
Future research should explore temporal dynamics in ecosystem service prioritization as urban areas expand and climate conditions change. The integration of AHP with dynamic ecosystem service models presents a promising avenue for developing more responsive and effective environmental management strategies that accommodate both urban and rural needs.
The Analytic Hierarchy Process (AHP) has emerged as a powerful, structured technique for organizing and analyzing complex decisions, particularly in the context of ecosystem service research where multiple, often conflicting, criteria must be considered [51]. By breaking down a problem into a hierarchical structure and using pairwise comparisons, AHP enables researchers to derive precise weightings for various ecosystem services, capturing both quantitative and qualitative aspects of decision-making [51]. However, AHP's full potential is realized when integrated with complementary modeling approaches that address its inherent limitations in handling spatial explicitness, resource constraints, and complex interdependencies.
This application note provides detailed protocols for integrating AHP with two powerful assessment models: the Integrated Valuation of Ecosystem Services and Tradeoffs (InVEST) model and Linear Programming (LP) optimization techniques. This integration creates a robust framework that leverages the strengths of each method—AHP for criterion weighting, InVEST for spatial biophysical modeling, and LP for constraint-based optimization—to support more informed and transparent decision-making in ecosystem service management and conservation planning.
Theoretical Foundation and Integration Rationale
The Analytic Hierarchy Process in Environmental Decision-Making
AHP, developed by Thomas L. Saaty in the 1970s, provides a systematic framework for decomposing complex decision problems into a hierarchy of more manageable components [51]. In ecosystem service research, this typically involves structuring the problem with the overall goal at the top level, primary criteria (e.g., ecological, socio-economic, cultural factors) at intermediate levels, and decision alternatives (e.g., management scenarios, spatial areas) at the bottom level [51] [52]. Through a series of pairwise comparisons, decision-makers establish relative priorities among elements at each level, resulting in a set of normalized weights that sum to unity.
The method's particular strength lies in its ability to incorporate both objective measurements and subjective judgments into a coherent decision framework, making it especially valuable for ecosystem service assessment where tangible biophysical data must be balanced with societal values and preferences [51]. Additionally, AHP includes a consistency ratio (CR) calculation to identify and mitigate inconsistent judgments, with CR < 0.10 generally considered acceptable [51].
Complementary Modeling Approaches
InVEST is a suite of spatial models developed by the Natural Capital Project that maps and values ecosystem services across landscapes. Unlike AHP, which excels at structuring decision criteria but lacks spatial explicitness, InVESS provides quantitative, spatially explicit estimates of ecosystem service provision based on land cover and biophysical data.
Linear Programming is a mathematical optimization technique used to achieve the best outcome (such as maximum benefit or lowest cost) in a mathematical model whose requirements are represented by linear relationships. LP is particularly valuable for solving resource allocation problems with multiple constraints [53] [54]. When integrated with AHP, LP can optimize the selection of alternatives (e.g., land allocation plans) subject to resource constraints while maximizing the total priority score derived from AHP weights [53].
Synergistic Integration Benefits
The integration of these three approaches creates powerful synergies for ecosystem service assessment and weighting research. AHP provides the multi-criteria decision framework for establishing relative importance weights; InVEST supplies spatially explicit data on ecosystem service provision to inform the AHP comparisons; and LP enables optimization of resource allocation decisions considering both the AHP-derived priorities and practical constraints. This addresses key limitations of using any single method in isolation.
Table 1: Comparative Strengths and Limitations of Individual Methods
| Method | Key Strengths | Key Limitations | Integration Benefit |
|---|---|---|---|
| AHP | Structured handling of qualitative and quantitative criteria; incorporates stakeholder values; consistency checking | No inherent spatial capability; subjective judgments may introduce bias; no optimization capability | Provides weighting framework for decision criteria; incorporates multiple perspectives |
| InVEST | Spatially explicit outputs; biophysical basis; quantifies tradeoffs | Limited incorporation of stakeholder preferences; no inherent prioritization mechanism | Supplies objective, spatial data to inform AHP comparisons; maps service distribution |
| Linear Programming | Optimal resource allocation; handles multiple constraints; mathematically rigorous | Requires quantifiable objectives; may oversimplify complex ecological relationships | Enables implementation of AHP-weighted decisions considering real-world constraints |
Integration of AHP with Linear Programming
Conceptual Framework and Workflow
The integration of AHP with Linear Programming creates a powerful decision-support tool that combines multi-criteria evaluation with mathematical optimization. This hybrid approach is particularly valuable in ecosystem service management where decision-makers must balance multiple objectives (e.g., biodiversity conservation, water quality protection, recreational value) while working within limited budgets, land availability, or other constraints [53] [54].
The generalized workflow involves: (1) using AHP to determine priority weights for different ecosystem services or management objectives; (2) formulating an LP model with these weights as coefficients in the objective function; and (3) solving the LP to identify the optimal allocation of resources that maximizes the total weighted value of ecosystem services provided.
Protocol: AHP-LP Integration for Ecosystem Service Optimization
Phase 1: AHP Hierarchy Development and Weight Derivation
Problem Structuring
- Clearly define the ecosystem service management goal (e.g., "Optimal allocation of conservation resources across potential protected areas")
- Identify key decision criteria (e.g., biodiversity value, carbon sequestration potential, water regulation capacity, recreational value)
- Define specific decision alternatives (e.g., specific land parcels, management interventions)
Hierarchy Construction
- Construct a standard AHP hierarchy with the goal at Level 1, criteria at Level 2, and alternatives at Level 3
- For complex problems, include sub-criteria levels as needed to adequately represent the decision structure
Pairwise Comparisons and Weight Calculation
- Conduct pairwise comparisons using Saaty's 1-9 scale for all elements at each level of the hierarchy
- Compute local priority vectors using the eigenvector method [55] [51]
- Check consistency ratio (CR) for each comparison matrix; revise comparisons if CR ≥ 0.10 [51]
- Synthesize global priorities for alternatives by multiplying local priorities through the hierarchy
Phase 2: LP Model Formulation
Objective Function Formulation
- Maximize Z = ∑(wi * xi)
- Where wi represents the global AHP priority for alternative i, and xi is the binary (0-1) or continuous decision variable representing the extent to which alternative i is selected
Constraint Identification
- Identify relevant resource constraints (budget, land area, manpower)
- Define ecological constraints (minimum protected area, connectivity requirements)
- Specify technical constraints (logistical feasibility, regulatory requirements)
Model Implementation
- Implement the LP model in appropriate software (e.g., Python with PuLP or Pyomo, R with lpSolve, commercial solvers like CPLEX or Gurobi)
- Solve the optimization problem to identify the optimal set of alternatives that maximizes the total AHP-weighted value subject to constraints
Phase 3: Validation and Sensitivity Analysis
Model Validation
- Compare optimization results with baseline scenarios
- Verify that all constraints are properly satisfied
- Check solution feasibility in real-world context
Sensitivity Analysis
- Test robustness of results to variations in AHP weights
- Analyze impact of changing constraint levels on optimal solution
- Identify critical constraints that strongly influence outcomes
Application Example: Conservation Area Selection
In a typical application to conservation area selection, researchers might use AHP to weight various ecosystem services (biodiversity, carbon storage, water yield, recreation) based on stakeholder input [56]. These weights would then serve as coefficients in an LP objective function aimed at maximizing total ecosystem service value, subject to constraints such as:
- Total budget ≤ available funding
- Total area selected ≤ maximum manageable area
- Minimum representation of each habitat type
- Connectivity requirements between selected areas
The resulting optimization would identify the specific set of land parcels that delivers the highest composite ecosystem service value within the identified constraints.
Table 2: LP Constraint Types in Ecosystem Service Optimization
| Constraint Category | Example Formulation | Application Context |
|---|---|---|
| Budget Constraints | ∑(ci * xi) ≤ B where c_i = cost of alternative i, B = total budget | Limited conservation funding |
| Area Constraints | ∑(ai * xi) ≤ A where a_i = area of parcel i, A = maximum area | Maximum manageable land area |
| Ecological Constraints | ∑(x_i) ≥ M for habitat type j where M = minimum representation | Biodiversity representation targets |
| Logical Constraints | xk ≥ xl (if parcel l selected, parcel k must also be selected) | Spatial connectivity requirements |
Integration of AHP with InVEST Model
Conceptual Framework and Workflow
The integration of AHP with the InVEST model creates a powerful framework that combines spatially explicit biophysical modeling with multi-criteria decision analysis. This approach addresses a key limitation of standalone AHP—the lack of spatial explicitness—while also incorporating stakeholder values into the interpretation of InVEST outputs.
The general workflow involves: (1) running InVEST models to quantify and map multiple ecosystem services; (2) using these spatial outputs to inform AHP pairwise comparisons; and (3) deriving composite maps that reflect both biophysical supply of ecosystem services and their relative societal importance [52].
Protocol: AHP-InVEST Integration for Spatial Prioritization
Phase 1: InVEST Model Implementation
Data Preparation
- Collect required spatial data for target InVEST models (typically land use/land cover, digital elevation models, soil data, climate data)
- Ensure consistent spatial resolution and extent across all datasets
- Preprocess data to meet specific InVEST model requirements
Model Selection and Parameterization
- Select appropriate InVEST models based on ecosystem services of interest (e.g., carbon storage, water yield, sediment retention, habitat quality)
- Parameterize models using biophysical data specific to the study region
- Run models to generate spatial outputs quantifying ecosystem service supply
Output Processing
- Standardize model outputs to comparable scales (e.g., 0-1 normalization, z-scores)
- Aggregate results to appropriate decision units (e.g., watersheds, land parcels, administrative units)
- Create summary statistics and visualizations for each ecosystem service
Phase 2: AHP Weighting Based on InVEST Outputs
Stakeholder Engagement
- Identify relevant stakeholders for the decision context (e.g., conservation planners, local communities, government agencies)
- Design structured workshops or surveys to conduct pairwise comparisons
InVEST-Informed Pairwise Comparisons
- Present InVEST outputs to stakeholders in accessible formats (maps, summary statistics)
- Use these biophysical data as objective reference points during pairwise comparison exercises
- Document rationales for comparisons to enhance transparency
Weight Derivation and Consistency Checking
- Compute priority weights from pairwise comparison matrices
- Check consistency ratios and revisit inconsistent judgments
- Aggregate individual weights if multiple stakeholders are involved (using geometric mean or other appropriate aggregation methods)
Phase 3: Spatial Integration and Analysis
Weighted Overlay Analysis
- Apply AHP-derived weights to standardized InVEST outputs using weighted overlay analysis: Composite Score = ∑(wi * ESi)
- Where wi is the AHP weight for ecosystem service i and ESi is the standardized value of ecosystem service i
Hotspot Identification
- Identify spatial priorities based on composite scores
- Conduct tradeoff analysis between different weighting scenarios
- Validate results with ground truth data or independent expert assessment
Application Example: Watershed Management Prioritization
In a typical watershed management application, researchers might use InVEST to model four key ecosystem services: water yield, sediment retention, nutrient retention, and carbon storage [52]. The spatial outputs would be standardized and presented to stakeholders who would then use AHP to assign relative weights based on local management priorities. The resulting composite map would identify critical areas for conservation or restoration that provide the highest combined value of multiple ecosystem services according to stakeholder preferences.
Advanced Integration: Combined AHP-InVEST-LP Framework
Conceptual Framework
The most comprehensive approach integrates all three methods—AHP, InVEST, and Linear Programming—into a unified decision-support framework. This advanced integration leverages the unique strengths of each method: InVEST for spatially explicit ecosystem service quantification, AHP for incorporating stakeholder preferences and weighting multiple objectives, and LP for optimizing resource allocation decisions subject to practical constraints.
This triple integration is particularly valuable for complex spatial planning problems where decision-makers must allocate limited resources across multiple geographic areas while balancing diverse ecological, social, and economic objectives.
Protocol: Integrated AHP-InVEST-LP Framework
Phase 1: Spatial Ecosystem Service Assessment (InVEST)
Comprehensive ES Modeling
- Implement multiple InVEST models to quantify relevant ecosystem services
- Validate model outputs with field data where available
- Standardize outputs to common spatial units (e.g., grid cells, land parcels)
Spatial Data Organization
- Organize InVEST outputs into a decision unit by ecosystem service matrix
- Ensure complete coverage of all decision units for all ecosystem services
- Address any data gaps through interpolation or modeling
Phase 2: Multi-Criteria Weighting (AHP)
Structured Stakeholder Engagement
- Conduct AHP exercises with diverse stakeholder groups
- Use InVEST outputs to inform comparisons
- Document assumptions and rationales
Weight Derivation and Aggregation
- Compute individual and group weights
- Assess consistency of comparisons
- Address significant discrepancies through deliberation
Phase 3: Optimization Model Development (LP)
Objective Function Specification
- Maximize Z = ∑∑(wj * vij * x_i)
- Where wj is AHP weight for ES j, vij is standardized value of ES j in unit i, and x_i is decision variable for unit i
Spatial Constraint Formulation
- Budget constraints: ∑(ci * xi) ≤ B
- Area constraints: ∑(ai * xi) ≤ A
- Contiguity constraints for compact reserve design
- Minimum representation targets for specific habitat types
Model Implementation and Solution
- Code optimization model in appropriate software
- Solve using appropriate algorithms (e.g., simplex, interior point)
- Generate multiple near-optimal solutions for flexibility in implementation
Application Example: Regional Conservation Planning
In a regional conservation planning context, this integrated framework would:
- Use InVEST to map multiple ecosystem services across the region
- Engage stakeholders through AHP to weight the relative importance of different services
- Formulate and solve an LP problem that identifies the optimal set of areas to protect given budget constraints while maximizing the total weighted ecosystem service value
This approach ensures that conservation decisions are both ecologically informed (through InVEST) and socially relevant (through AHP), while also being practically feasible (through LP constraint handling).
Table 3: Essential Computational Tools for Integrated AHP-InVEST-LP Research
| Tool Category | Specific Software/Packages | Key Functionality | Application Notes |
|---|---|---|---|
| AHP Implementation | ExpertChoice, SuperDecisions, R (ahpsurvey), Python (pyAhp) | Pairwise comparisons, weight calculation, consistency checking | Web-based tools facilitate stakeholder engagement; open-source packages support reproducibility |
| InVEST Modeling | InVEST suite (Natural Capital Project) | Spatial ecosystem service modeling, tradeoff analysis | Requires QGIS or ArcGIS as spatial platform; model selection depends on target services |
| Linear Programming | Python (PuLP, Pyomo), R (lpSolve), Gurobi, CPLEX | Mathematical optimization, constraint handling | Commercial solvers handle larger problems; open-source alternatives suitable for medium-scale applications |
| Spatial Analysis | QGIS, ArcGIS, R (sf, raster) | Spatial data processing, overlay analysis, mapping | Critical for processing inputs for InVEST and visualizing integrated results |
| Statistical Analysis | R, Python (pandas, scipy) | Data standardization, sensitivity analysis, validation | Essential for pre-processing and post-analysis of model results |
Validation and Sensitivity Analysis Protocols
Statistical Validation Techniques
Robust validation is essential for ensuring the reliability of integrated AHP-InVEST-LP frameworks. The following statistical approaches are recommended:
Sensitivity Analysis for AHP Weights
- systematically vary AHP weights within plausible ranges
- measure impact on final priorities or optimization results
- identify critical weights that strongly influence outcomes [57]
Model Validation for InVEST Outputs
- compare InVEST predictions with field measurements where available
- use cross-validation techniques for parameter calibration
- assess model performance using standard metrics (RMSE, MAE, R²)
Solution Robustness for LP Results
- analyze shadow prices to identify binding constraints
- generate near-optimal solutions to provide decision flexibility
- test stability of solutions under different parameter scenarios
Addressing Methodological Limitations
Each method in the integrated framework has specific limitations that should be addressed through appropriate validation:
- AHP: Address potential subjectivity through stakeholder diversity and consistency checks [51] [56]
- InVEST: Acknowledge and quantify uncertainty in model inputs and parameters
- LP: Verify that linearity assumptions are reasonable for the specific application context
The integration of AHP with InVEST and Linear Programming provides a powerful, holistic framework for ecosystem service assessment and weighting research. By combining the multi-criteria decision-making capabilities of AHP, the spatial explicitness of InVEST, and the optimization power of Linear Programming, researchers and practitioners can address complex environmental management challenges with greater rigor and transparency.
The protocols outlined in this application note provide detailed guidance for implementing these integrated approaches, with specific attention to practical considerations, potential pitfalls, and validation techniques. As ecosystem service research continues to evolve, these integrated frameworks will play an increasingly important role in supporting evidence-based decision-making for sustainable resource management and conservation planning.
Overcoming AHP Implementation Challenges in Environmental Contexts
In ecosystem service (ES) weighting research, the Analytic Hierarchy Process (AHP) is a cornerstone methodology for structuring complex decision-making. It enables researchers to derive robust weights for criteria like carbon storage, biodiversity, and water yield by systematically comparing them in pairs [16] [8]. However, the reliability of this process is fundamentally dependent on the consistency of expert judgments [58]. Judgment inconsistency—where pairwise comparisons contradict one another—can compromise the validity of derived weights and, consequently, the credibility of landscape management scenarios and policy recommendations [34] [59]. This Application Note provides a structured framework for identifying, quantifying, and managing common sources of judgment inconsistency within the specific context of ecosystem services research, ensuring that AHP-based findings are both scientifically sound and actionable for environmental management.
The Critical Role of Consistency in AHP for ES Research
In AHP, consistency is not merely a statistical measure; it reflects the logical coherence of a decision-maker's preferences. The process quantifies this through a Consistency Ratio (CR). A CR of 0.1 (10%) or less is generally considered acceptable, indicating that judgments are sufficiently coherent for reliable weight derivation [58] [60]. In ES studies, high-integrity weights are paramount. For instance, research in the Loess Plateau of China used AHP to evaluate trade-offs between agricultural production and regulating services, where inconsistent weights could lead to flawed land-use policy [16]. Similarly, a study ranking landscape-level management scenarios demonstrated that stakeholder-derived weights significantly altered scenario prioritization, underscoring the real-world impact of judgment quality [34].
Judgment inconsistencies in AHP can arise from multiple sources. The table below categorizes the most common ones, their impact on ES research, and typical indicators.
Table 1: Common Sources of Judgment Inconsistency in AHP for Ecosystem Services
| Source Category | Description & Impact on ES Research | Common Indicators |
|---|---|---|
| Cognitive Overload [59] [58] | Excessively complex hierarchies (e.g., too many ES criteria) overwhelm cognitive capacity. Leads to random or contradictory valuations of related services (e.g., soil conservation vs. water yield). | A sharp rise in CR as the number of criteria increases; inconsistent transitive relationships (e.g., A>B, B>C, but C>A). |
| Inappropriate Use of Extreme Values [59] [60] | Overuse of the high end (e.g., 9) or low end (e.g., 1/9) of Saaty's scale to express strong preference. Can oversimplify complex trade-offs between, for example, provisioning and cultural services. | Multiple "extreme" judgments in the pairwise comparison matrix; high CR despite respondent confidence. |
| Lack of Information or Expertise [60] | Respondent lacks specific knowledge to distinguish between two technically complex ES criteria (e.g., "habitat quality" vs. "biodiversity support"). | High inconsistency for specific criterion pairs; comments from respondents indicating uncertainty. |
| Clerical Errors & Lapses in Concentration [60] | Simple data entry mistakes (e.g., entering 5 instead of 1/5) or loss of focus during a lengthy survey. Introduces random, easily correctable errors. | Isolated, severe inconsistencies that contradict many other comparisons; identification during data review. |
Measuring Inconsistency: The Consistency Ratio (CR)
The Consistency Ratio is the primary metric for quantifying judgment inconsistency. It is calculated as follows [58] [60]:
Calculate the Consistency Index (CI):
CI = (λ_max - n) / (n - 1)Whereλ_maxis the principal eigenvalue of the pairwise comparison matrix andnis the number of criteria compared.Compute the Consistency Ratio (CR):
CR = CI / RIWhereRIis the Random Index, an average CI derived from randomly generated matrices of the same size.
A CR ≤ 0.10 is acceptable. A higher value suggests that the judgments may be too inconsistent to yield reliable results, and a review process is recommended [60].
Protocols for Managing and Correcting Inconsistency
The following protocols provide a step-by-step guide for managing inconsistency in ES weighting studies.
Protocol 1: Proactive Study Design to Minimize Inconsistency
Objective: Structure the AHP study to preemptively reduce the potential for inconsistency. Materials: Expert panel, hierarchical tree software (e.g., Expert Choice, Prioritization Helper), AHP survey platform. Procedure:
- Hierarchy Simplification: Limit the number of elements at any single level of the hierarchy to 7 ± 2 criteria [58]. For complex ES assessments with many criteria, group them into sub-categories.
- Example: Instead of comparing 10 individual ES, group them as "Provisioning," "Regulating," and "Cultural" services at a higher level [16].
- Expert Training and Calibration: Prior to the survey, conduct a briefing session with participants.
- Pilot Testing: Administer the AHP survey to a small pilot group. Analyze the CR and solicit feedback on the clarity of criteria and the survey interface. Refine the study materials based on this feedback.
Protocol 2: A Post-Hoc Algorithmic Adjustment for Inconsistent Matrices
Objective: To algorithmically adjust an inconsistent pairwise comparison matrix while preserving the original expert's intent as much as possible. This is particularly useful for anonymous online surveys where direct re-engagement is not feasible [59]. Materials: Inconsistent pairwise comparison matrix, statistical software (e.g., R). Procedure (Simplified Iterative Approach):
- Compute the Initial Priority Vector: Calculate the initial weights (priority vector) from the original matrix using the Geometric Mean Method (GMM) [59].
- Calculate Expected Values: For each pair of criteria (i, j), calculate an expected preference score based on the derived weights:
Expected a_ij = w_i / w_j. - Identify the Largest Deviation: Compare the expert's original score with the expected score. Identify the pairwise comparison with the greatest absolute deviation.
- Adjust the Most Inconsistent Judgment: Replace the original value in the matrix with the expected value for the most inconsistent judgment, or an adjacent value on the Saaty scale if aiming to preserve discrete values.
- Iterate and Check: Recompute the CR for the modified matrix. If the CR remains above 0.10, repeat steps 2-4 until an acceptable consistency level is achieved [59]. This method ensures minimal intervention to correct the most problematic judgments.
Protocol 3: An Interactive, Expert-Driven Refinement Process
Objective: To guide experts in refining their own judgments through an interactive, real-time process. This method prioritizes expert learning and judgment integrity over purely algorithmic correction [58]. Materials: Interactive AHP software tool (e.g., implementing a greedy algorithm), expert participant. Procedure:
- Initial Judgment and CR Calculation: The expert completes the pairwise comparison matrix. The software calculates and displays the initial CR.
- Identification of Key Inconsistencies: If CR > 0.10, the software algorithm identifies the one or two pairwise comparisons that, if slightly adjusted, would most significantly improve the CR.
- Expert-Led Adjustment: The software presents these key comparisons to the expert, suggesting a minor adjustment (e.g., changing a 6 to a 5). The expert reviews the suggestion and decides whether to accept the new value or override it based on their substantive knowledge.
- Iteration to Acceptance: Steps 2 and 3 are repeated until the CR falls to an acceptable level (≤ 0.10). This process ensures the final consistent matrix still reflects the expert's informed preferences [58].
The following workflow diagram illustrates the strategic decision process for selecting and applying these protocols.
The Researcher's Toolkit for AHP Inconsistency Management
Table 2: Essential Reagents and Tools for Managing AHP Inconsistency
| Tool / Reagent | Function in Inconsistency Management | Example Application in ES Research |
|---|---|---|
AHP Software with CR Calculation (e.g., Expert Choice, R ahp package) |
Automates computation of weights and the CR; essential for quantifying inconsistency. | Used in a study in Vale do Sousa, Portugal, to rank forest management scenarios based on stakeholder preferences [34]. |
| Interactive AHP Tool [58] | Implements algorithms (e.g., greedy) to suggest minimal judgment adjustments to experts in real-time. | Used with border delineation experts to improve CR while preserving their original intent; applicable to ES expert panels [58]. |
| Random Index (RI) Table [60] | Provides the reference value for calculating the CR, dependent on matrix size (n). | A standard lookup table used in the CR calculation for any AHP study, including ES assessments. |
| Online Survey Platform with AHP Module | Facilitates data collection from geographically dispersed stakeholders; some platforms perform basic consistency checks. | Used to gather preferences from 48 experts across academia, government, and industry for weighting social indicators for mobility services [5]. |
| Simplified Adjustment Algorithm [59] | A post-hoc method for correcting inconsistencies in datasets where expert re-engagement is impossible. | Applicable to large-scale, anonymous online surveys about public preferences for different ecosystem service bundles. |
Effectively identifying and managing judgment inconsistency is not a peripheral task but a core component of rigorous AHP methodology in ecosystem service research. By understanding the common sources of inconsistency, diligently measuring the CR, and implementing structured protocols—from proactive study design to interactive refinement—researchers can significantly enhance the reliability of their derived ES weights. The tools and frameworks outlined in this document empower scientists to produce findings that can confidently inform complex environmental management decisions and policy development, ensuring that the critical balance between diverse ecosystem services is accurately represented and evaluated.
Strategies for Handling Large Numbers of Criteria and Sub-criteria
Within ecosystem service (ES) weighting research, the Analytical Hierarchy Process (AHP) provides a structured framework for reconciling diverse and often competing environmental objectives. However, comprehensive ES assessments frequently involve a proliferation of criteria and sub-criteria, encompassing provisioning, regulating, supporting, and cultural services. Managing this complexity is critical to maintaining the consistency, reliability, and practical utility of the AHP methodology. This document outlines proven strategies and detailed protocols for effectively structuring, analyzing, and validating complex decision hierarchies in ES research, drawing on applications from landscape management to cultural heritage preservation.
Hierarchical Structuring and Decomposition
The foundational strategy for managing complexity in AHP is to decompose the decision problem into a manageable hierarchical structure.
Table 1: Hierarchical Structure for Ecosystem Service Weighting
| Level | Component | Description & Function | Example from ES Research |
|---|---|---|---|
| Level 1 | Goal | The overarching decision objective. | "To identify the optimal landscape management scenario for maximizing ecosystem service provision." [34] |
| Level 2 | Criteria | High-level ecosystem service categories. | Timber Production, Carbon Sequestration, Wildfire Resistance, Biodiversity, Recreation [34]. |
| Level 3 | Sub-criteria | Specific, measurable components of the broader criteria. | Under Biodiversity: Habitat Suitability, Species Richness, Keystone Species Presence. |
| Level 4 | Alternatives | The different options or scenarios being evaluated. | Five management scenarios developed via Linear Programming, each maximizing a single ES [34]. |
This hierarchical decomposition transforms a complex problem into a series of smaller, more tractable pairwise comparisons, thereby reducing cognitive load and potential inconsistencies for decision-makers [1] [2]. A study on grotto deterioration successfully applied this principle by classifying 15 deteriorations into two main categories, stability and weathering, before further decomposition [61].
Software and Computational Tools
Specialized software is indispensable for managing the computational demands of large AHP models, including the construction of pairwise comparison matrices, calculation of priority vectors, and consistency checks.
Table 2: Key Software Tools for Complex AHP Modeling
| Software Tool | Primary Function | Utility in Handling Numerous Criteria |
|---|---|---|
| Expert Choice | A commercial software solution for AHP implementations. | Provides a user-friendly interface for building complex hierarchies, automates calculations, and performs consistency checks [2]. |
| Criterium Decision Plus (CDP) | Software for Multi-Criteria Decision Analysis (MCDA). | Used in ES research to incorporate stakeholder preferences into the ranking of landscape-level scenarios [34]. |
| Prioritization Helper | A cloud-based AHP application. | Integrates with platforms like Salesforce to streamline decision-making processes within organizations [2]. |
| Excel with Custom Scripts | Spreadsheet software with advanced calculation capabilities. | Can be used to perform the intricate eigenvalue calculations required for deriving weights, though it is less automated than specialized tools [1]. |
The use of such software optimizes time and resources, allowing researchers to focus on judgment and analysis rather than complex mathematics [62].
Detailed Experimental Protocol for AHP in ES Weighting
The following protocol provides a step-by-step methodology for implementing AHP in ecosystem service research, with a focus on managing numerous criteria.
Phase 1: Pre-Study Preparation
- Step 1: Define the Goal and Identify Stakeholders Formulate a clear, unambiguous goal statement (e.g., "Weight ecosystem services for conservation priority setting"). Identify and recruit a panel of experts and stakeholders. Research indicates that social networks can be a highly effective method for identifying and contacting experts [62].
- Step 2: Develop the Decision Hierarchy
- Brainstorm all relevant criteria and sub-criteria through literature review and expert consultation.
- Structure them into a hierarchy similar to Table 1. Avoid making the hierarchy excessively deep or broad; 5-9 elements per level is a commonly recommended manageable range.
- Step 3: Select and Configure Software
- Choose an appropriate software tool (from Table 2) based on the project's needs and resources.
- Input the defined hierarchy into the software platform.
- Step 4: Conduct Pairwise Comparisons
- For Criteria: Present participants with pairwise comparison surveys. For each pair of criteria at the same level, ask: "With respect to our overall goal, how much more important is Criterion A than Criterion B?" Answers are captured using Saaty's 9-point ratio scale (1 = equally important, 9 = extremely more important) [1] [2].
- For Sub-criteria: Repeat the pairwise comparison process at the sub-criteria level, relative to their parent criterion.
- For Alternatives: If applicable, perform pairwise comparisons of the alternatives with respect to each sub-criterion (or criterion if no sub-criteria exist).
- Step 5: Calculate Local Weights and Check Consistency
- The software will compute the local priority vectors (weights) for criteria, sub-criteria, and alternatives using the eigenvalue method [1] [2].
- The software will also calculate a Consistency Ratio (CR). A CR ≤ 0.10 is generally acceptable. If the CR exceeds this threshold, it indicates possible random or illogical judgments, and the participant may need to review their comparisons for that particular set [2].
Phase 3: Synthesis and Validation
- Step 6: Synthesize Global Priorities
- The software synthesizes the local weights throughout the hierarchy to produce global priority scores for each alternative. This is achieved through a weighted-sum model, combining the weight of each criterion with the performance score of each alternative [1].
- This synthesis generates a final ranking of the alternatives.
- Step 7: Conduct Sensitivity Analysis
- Test the robustness of the final ranking by varying the weights of key criteria in the software. This analysis shows how sensitive the outcome is to changes in stakeholder preferences and helps identify which criteria have the most influence on the result [34].
AHP Workflow for ES Research
The Scientist's Toolkit: Research Reagent Solutions
Table 3: Essential "Reagents" for AHP-based ES Research
| Research 'Reagent' | Function in the AHP 'Experiment' |
|---|---|
| Structured Hierarchy | The foundational framework that breaks down the complex ES decision problem into comparable components (Goal, Criteria, Sub-criteria, Alternatives) [34] [1]. |
| Saaty's 9-Point Scale | The standardized "measurement scale" for quantifying subjective expert judgments during pairwise comparisons, ensuring responses are captured on a consistent ratio scale [1] [2]. |
| Pairwise Comparison Matrix | The primary data collection "instrument," a matrix where the relative importance of all elements within a hierarchical level is systematically recorded [1]. |
| Eigenvalue Method | The core "analytical engine" that processes the pairwise comparison matrices to derive the priority vectors (weights) for criteria and alternatives [1] [2]. |
| Consistency Ratio (CR) | A key "quality control metric" that validates the logical coherence of the pairwise comparisons provided by experts [2]. |
Visualization of Hierarchical Structure
A clear visual representation of the hierarchy is crucial for communicating the structure of the decision problem to all participants.
ES AHP Hierarchy Structure
Addressing Uncertainty and Subjectivity in Expert Judgments
The Analytic Hierarchy Process (AHP) has emerged as a pivotal multi-criteria decision analysis (MCDA) method for structuring complex decision problems, particularly in the field of ecosystem service research where expert judgment is paramount [1]. Developed by Thomas Saaty in the 1970s, AHP facilitates the weighting of criteria through systematic pairwise comparisons, transforming subjective expert opinions into quantifiable priority scales [1]. This application note addresses the critical challenges of uncertainty quantification and subjectivity management within AHP frameworks specifically for ecosystem service weighting, providing researchers with standardized protocols to enhance methodological rigor and result reliability. By implementing the prescribed methodologies for expert recruitment, consistency monitoring, and sensitivity analysis detailed herein, researchers can significantly improve the robustness and transparency of their ecological valuation studies, supporting more informed environmental policy and conservation decisions.
Methodological Foundations of AHP
The Analytic Hierarchy Process operates through a structured framework that decomposes complex decisions into a hierarchical structure and derives priority scales through pairwise comparisons [1]. The fundamental steps include hierarchy structuring, pairwise comparison, priority derivation, and synthesis [1].
Structural Components
The AHP hierarchy for ecosystem service research typically comprises three primary levels:
- Level 1: The overarching decision goal (e.g., "Determine relative importance of ecosystem services")
- Level 2: The criteria and sub-criteria (e.g., service categories: provisioning, regulating, cultural, supporting)
- Level 3: The weighting alternatives or specific services under evaluation [1]
This hierarchical structure enables researchers to break down complex ecological valuation problems into manageable, systematically comparable components.
Mathematical Underpinnings
The core mathematical operation in AHP involves constructing pairwise comparison matrices where elements aᵢⱼ represent the relative importance of criterion i versus j according to Saaty's fundamental 1-9 scale [63] [1]. The priority vector (eigenvector) is then computed through eigenvalue calculation, satisfying the equation A·w = λₘₐₓ·w, where A is the comparison matrix, w is the eigenvector (priority weights), and λₘₐₓ is the principal eigenvalue [1]. The Consistency Ratio (CR) is calculated as CR = CI/RI, where CI = (λₘₐₓ - n)/(n - 1) and RI is the random index value based on matrix size [63]. A CR value ≤ 0.10 is generally considered acceptable, indicating reasonably consistent judgments [63].
Table 1: Saaty's Fundamental Scale of Absolute Numbers for Pairwise Comparisons
| Intensity of Importance | Definition | Explanation |
|---|---|---|
| 1 | Equal importance | Two activities contribute equally to the objective |
| 3 | Moderate importance | Experience and judgment slightly favor one activity over another |
| 5 | Strong importance | Experience and judgment strongly favor one activity over another |
| 7 | Very strong importance | An activity is favored very strongly over another |
| 9 | Extreme importance | The evidence favoring one activity over another is of the highest possible order of affirmation |
| 2, 4, 6, 8 | Intermediate values | Used when compromise is needed |
Protocol for Application in Ecosystem Service Research
Expert Panel Selection and Training
Objective: Establish a diverse, representative expert panel with comprehensive domain knowledge in ecosystem services and AHP methodology.
Procedure:
- Identify Expertise Domains: Recruit experts covering all relevant ecosystem service categories (provisioning, regulating, cultural, supporting) based on the Millennium Ecosystem Assessment classification [63]. For wetland ecosystems, for example, include specialists in hydrology, ecology, socio-economics, and traditional knowledge.
Panel Composition: Form a multidisciplinary panel of 5-15 experts. The Albufera Natural Park valuation study engaged ten organizations including academic departments, ecological NGOs, fishing communities, farmers' unions, and public foundations [63].
Expert Training:
- Conduct a 2-hour training session on AHP fundamentals and the pairwise comparison process
- Provide structured worksheets with clear examples of the 1-9 scale application
- Familiarize experts with the specific ecosystem service classification system being used [63]
Calibration Exercise: Administer a trial pairwise comparison using a standardized set of non-study items to establish baseline understanding and identify potential misinterpretations of the scale.
Hierarchical Structuring of Ecosystem Services
Objective: Develop a comprehensive hierarchy that accurately represents the ecosystem services being evaluated.
Procedure:
- Define Decision Goal: Clearly articulate the primary valuation objective (e.g., "Determine relative weights of ecosystem services for the Albufera Natural Park management planning") [63].
Service Classification: Adopt an established ecosystem service classification framework such as the Millennium Ecosystem Assessment (provisioning, regulating, cultural, and supporting services) or the Common International Classification of Ecosystem Services (CICES) [63] [64].
Decompose Hierarchy:
- Level 1: Overall goal (ecosystem service valuation)
- Level 2: Main service categories (e.g., cultural, supporting, provisioning, regulation)
- Level 3: Specific services within each category (e.g., for cultural: tourism, aesthetics, identity value, educational value) [63]
Hierarchy Validation: Conduct an expert review round to validate the completeness and appropriateness of the hierarchical structure for the specific ecosystem context.
Pairwise Comparison and Data Collection
Objective: Systematically collect pairwise comparison judgments from experts with controlled subjectivity.
Procedure:
- Structured Data Collection: Present experts with standardized pairwise comparison matrices, either in physical or digital format.
Comparison Process: For each criterion pair (A,B), experts answer: "With respect to ecosystem service valuation, how much more important is service A than service B?" using Saaty's 1-9 scale [1].
Matrix Completion: Ensure all possible pairwise combinations within each hierarchical level are evaluated. For n criteria, this requires n(n-1)/2 comparisons.
Judgment Recording: Document all judgments with timestamps and expert identifiers for traceability.
Consistency Monitoring: Calculate consistency ratios in real-time during data collection where possible, allowing for expert reconsideration of highly inconsistent judgments.
Table 2: Ecosystem Service Categories and Examples for AHP Application
| Service Category | Sub-category | Specific Service Examples | Measurement Considerations |
|---|---|---|---|
| Cultural Services | Tourism & Recreation | Nature-based tourism, recreational fishing | Assessed through visitor days, economic expenditure |
| Aesthetics & Inspiration | Landscape beauty, artistic inspiration | Expert judgment on scenic quality | |
| Identity Value | Cultural heritage, religious significance | Community attachment surveys | |
| Supporting Services | Nutrient Recycling | Nitrogen, phosphorus cycling | Biochemical process rates |
| Primary Production | Phytoplankton, aquatic plant growth | Biomass accumulation measurements | |
| Provisioning Services | Food Provisioning | Fish, agricultural products, hunting | Yield quantities, market values |
| Fresh Water Supply | Drinking, irrigation water | Water volume, quality parameters | |
| Genetic Resources | Endemic species, genetic material | Biodiversity inventories | |
| Regulation Services | Climate Regulation | Carbon sequestration, temperature modulation | Carbon storage measurements |
| Water Sanitation | Nutrient retention, pollutant removal | Water purification capacity | |
| Air Quality Regulation | Particulate matter deposition | Filtration rates |
Quantifying and Managing Uncertainty
Consistency Assessment Protocol
Objective: Identify and address inconsistencies in expert judgments to enhance reliability.
Procedure:
- Calculate Consistency Indices: For each completed pairwise comparison matrix, compute:
- λₘₐₓ (principal eigenvalue)
- CI (Consistency Index) = (λₘₐₓ - n)/(n - 1)
- CR (Consistency Ratio) = CI/RI, where RI is the Random Index (dependent on n) [63]
Acceptability Threshold: Apply the standard threshold of CR ≤ 0.10. Matrices exceeding this value require revision [63].
Inconsistency Resolution:
- Identify the most inconsistent judgments through sensitivity analysis
- Return to experts with specific feedback on which comparisons are contributing most to inconsistency
- Allow experts to revise their judgments with an understanding of the inconsistencies
Documentation: Record all original and revised matrices to maintain transparency in the decision process.
Sensitivity Analysis Framework
Objective: Evaluate the stability of ecosystem service weights to variations in expert judgments.
Procedure:
- Weight Perturbation: Systematically vary input judgments within reasonable bounds (e.g., ±1 point on Saaty's scale) and recalculate priority vectors.
Scenario Analysis: Test extreme cases by substituting judgments from different stakeholder groups (e.g., replacing ecologists' judgments with economists' judgments for specific comparisons).
Uncertainty Propagation: Apply Monte Carlo simulation techniques where probability distributions are assigned to pairwise comparisons instead of fixed values.
Result Stability Metrics: Calculate:
- Rank reversal frequency: How often service rankings change under perturbation
- Weight deviation ratios: Maximum percentage change in weights across scenarios
- Decision confidence intervals: Range of possible weights for each service
Threshold Establishment: Determine acceptable variation boundaries based on the specific decision context and potential consequences of weighting errors.
Visualization and Analytical Tools
AHP Workflow for Ecosystem Service Weighting
The following diagram illustrates the complete AHP protocol for ecosystem service weighting, integrating uncertainty management at each stage:
Research Reagent Solutions
Table 3: Essential Research Reagents for AHP in Ecosystem Service Studies
| Reagent/Tool | Function/Purpose | Implementation Example |
|---|---|---|
| Saaty's Fundamental Scale | Standardized metric for pairwise comparisons | Enables consistent quantification of expert preferences across all service categories [1] |
| Pairwise Comparison Matrix | Framework for systematic judgment collection | Digital or physical matrix templates for n(n-1)/2 comparisons per hierarchy level [1] |
| Consistency Ratio Calculator | Quality control for expert judgments | Automated computation of CR to identify logically inconsistent comparisons [63] |
| Eigenvector Calculator | Derivation of priority weights from comparisons | Software implementation of power method for determining service priorities [1] |
| Sensitivity Analysis Framework | Uncertainty quantification in weight results | Monte Carlo simulation tools for assessing robustness of service rankings [63] |
| Expert Panel Database | Repository of qualified participants | Curated list of multidisciplinary specialists for different ecosystem types [63] |
| Hierarchical Template Library | Standardized service classification frameworks | Pre-structured hierarchies based on MA, TEEB, or CICES for different ecosystems [64] |
The integration of systematic protocols for addressing uncertainty and subjectivity in expert judgments significantly enhances the reliability of AHP applications in ecosystem service weighting research. By implementing the structured approaches for expert selection, hierarchical decomposition, consistency validation, and sensitivity analysis outlined in this application note, researchers can produce more robust, transparent, and defensible weightings for environmental decision-making. The standardized methodologies enable more meaningful cross-study comparisons and support evidence-based conservation policy and natural resource management decisions. Future methodological developments should focus on integrating AHP with other multi-criteria decision analysis techniques, such as the Analytic Network Process (ANP), to better capture the complex interdependencies among ecosystem services and further refine uncertainty quantification in ecological valuations.
Optimizing Stakeholder Engagement and Participatory Processes
Integrating structured stakeholder engagement into the Analytic Hierarchy Process (AHP) is critical for robust and legitimate ecosystem service valuation. AHP, a multi-criteria decision analysis method developed by Thomas Saaty, breaks down complex decisions into a hierarchical structure, using pairwise comparisons to derive weighted priorities [1] [2] [3]. When this technical framework is combined with systematic participatory approaches, it strengthens the credibility, relevance, and practical application of research aimed at weighting ecosystem services. This protocol provides detailed application notes for embedding stakeholder engagement within AHP studies, framed specifically for researchers and scientists in environmental and ecosystem services fields.
Theoretical Foundation
The Analytic Hierarchy Process (AHP) in Environmental Research
AHP provides a structured technique for organizing and analyzing complex decisions by decomposing a problem into a hierarchy of goals, criteria, sub-criteria, and alternatives [3] [65]. Decision-makers then evaluate elements through pairwise comparisons using Saaty's established scale, which quantifies judgments on a scale from 1 (equal importance) to 9 (extreme importance) [1] [2]. The process involves mathematical synthesis of these judgments to yield a set of overall priorities, accompanied by consistency checks to ensure logical coherence in evaluations [2] [3]. Its application in ecosystem service research is well-documented; for instance, it has been deployed to value the ecosystem services of the Albufera Natural Park in Valencia, Spain, a significant Mediterranean wetland, engaging experts to weight diverse services from provisioning (e.g., food, water) to cultural benefits [63].
The Imperative for Participatory Approaches
Participatory approaches, such as the Participatory Analytic Hierarchy Process (PAHP), are vital for capturing diverse knowledge systems and building consensus among stakeholders with varying interests [66]. In the context of ecosystem services, which encompass provisioning, regulating, cultural, and supporting services, stakeholder values are often multifaceted and context-dependent [63] [67]. Engaging stakeholders not only enhances the democratic quality of the research but also improves the practical uptake of findings. Research in West Africa assessing landscape capacity for regulating ecosystem services demonstrated that combining expert weighting with landscape metrics-based assessment could reveal underestimated values when stakeholder structural knowledge is omitted [67]. Effectively, participation turns AHP from a purely technical exercise into a socially contextualized decision-support tool.
Application Notes: Integrating Stakeholder Engagement with AHP
Stakeholder Identification and Analysis
The first step involves systematically identifying and analyzing stakeholders to ensure all relevant perspectives are included in the AHP process.
- Define Stakeholder List: Identify all individuals, groups, and organizations affected by or capable of influencing the ecosystem service management decisions. This includes internal stakeholders (e.g., project team, agency specialists) and external stakeholders (e.g., local communities, farmers, NGOs, government agencies, academics) [68] [69].
- Identify Key Stakeholders: Prioritize stakeholders from the list based on their influence, interest, and impact regarding the ecosystem services in question. A Power-Interest Grid is a useful tool for categorization [69]:
- Manage Closely: Stakeholders with high power and high interest require close and frequent engagement.
- Keep Satisfied: Those with high power but low interest need to be adequately engaged to maintain their satisfaction.
- Keep Informed: Stakeholders with high interest but low power should be regularly informed and consulted.
- Monitor: Those with low power and low interest require minimal effort but should be monitored for changes.
- Ensure Inclusivity: Actively plan measures to include culturally and linguistically diverse groups, provide information in accessible formats, and offer participation opportunities that accommodate different abilities and availability [68].
Designing the Participatory AHP Framework
With stakeholders identified, the core AHP process is adapted to be participatory.
- Collaborative Hierarchy Building: Facilitate workshops with stakeholders to jointly define the decision goal and decompose it into a hierarchy of criteria (ecosystem service categories) and sub-criteria (specific services). For example, the Millennium Ecosystem Assessment classification (Provisioning, Regulating, Cultural, and Supporting services) can serve as a starting point, adapted with local input [63].
- Structured Pairwise Comparison Elicitation: Guide stakeholders through the pairwise comparison process. This can be done in facilitated group sessions, using questionnaires, or via specialized software. Clear instructions on using Saaty's scale are essential. The Participatory Analytic Hierarchy Process (PAHP) leverages inconsistencies in pairwise comparison matrices not just as errors to correct, but as opportunities to stimulate debate, adjust preferences, and build consensus across the group [66].
- Synthesis and Feedback Loops: Synthesize individual judgments (using weighted geometric means or other aggregation methods for group AHP) to obtain global priorities for ecosystem services. Crucially, report these preliminary results back to stakeholders for verification and discussion, ensuring transparency and allowing for refinements [68] [66].
Experimental Protocol: A Step-by-Step Workflow
What follows is a detailed, actionable protocol for implementing a Participatory AHP for ecosystem service weighting.
Phase 1: Pre-Engagement Planning (Weeks 1-2)
- Objective: Clarify the decision problem and define the desired outcome. A well-defined problem is the foundation of a successful AHP application [65].
- Activities:
- Problem Definition: Articulate the core issue (e.g., "Prioritizing ecosystem services for conservation planning in a specific wetland").
- Stakeholder Mapping: Conduct a preliminary stakeholder analysis to identify key groups and individuals.
- Develop Engagement Plan: Outline methods, timelines, resources, and communication strategies for engaging different stakeholder categories [68] [69].
Phase 2: Stakeholder Recruitment and Preparation (Weeks 3-4)
- Objective: Assemble a diverse and representative stakeholder panel and prepare them for the process.
- Activities:
- Stakeholder Invitation: Formally invite identified stakeholders, clearly explaining the project's goals, their potential role, and the commitment required.
- Pre-Workshop Material Distribution: Provide background information on the study area, the concept of ecosystem services, and an overview of the AHP method.
Phase 3: Participatory Workshop (Week 5)
- Objective: Facilitate a structured workshop to build the hierarchy and conduct pairwise comparisons.
- Activities:
- Introduction (1 hour): Reiterate goals, introduce AHP and Saaty's scale with examples.
- Hierarchy Construction (2 hours): Facilitate a group discussion to define the goal and establish relevant ecosystem service criteria and sub-criteria.
- Pairwise Comparisons (2-3 hours): Guide stakeholders through pairwise comparisons of criteria and sub-criteria. Use paper forms, voting devices, or real-time software to capture judgments.
- Open Discussion (1 hour): Allow stakeholders to discuss challenges, justifications for their choices, and any emerging consensus or disagreements.
Phase 4: Data Analysis and Synthesis (Weeks 6-7)
- Objective: Process the collected data to compute weights for each ecosystem service.
- Activities:
- Data Aggregation: Compile all pairwise comparison matrices.
- Weight Calculation: For each matrix, compute the priority vector (eigenvector) to obtain local weights. A common method involves squaring the matrix, summing each row, and normalizing the results, iterating until the weights stabilize [1] [2].
- Consistency Check: Calculate the Consistency Ratio (CR) for each matrix. A CR below 0.10 is generally acceptable; higher values indicate inconsistent judgments that may need revisiting [63] [2] [3].
- Synthesis of Global Weights: Combine local weights across the hierarchy to generate global priority weights for each ecosystem service sub-criterion.
Phase 5: Validation and Reporting (Weeks 8-9)
- Objective: Validate results with stakeholders and produce a final report.
- Activities:
- Feedback Session: Present the computed weights, the process undertaken, and the consistency results to stakeholders for review and validation.
- Final Report Preparation: Document the entire process, including the stakeholder list, final hierarchy, pairwise comparison data, weight calculations, and a discussion of the outcomes.
The following workflow diagram summarizes this multi-phase protocol.
Data Presentation and Analysis
Structuring and Presenting Quantitative Data
Clear presentation of data is essential for transparency and stakeholder comprehension. The two primary types of data tables in a Participatory AHP study are the pairwise comparison matrix and the resulting priority weights table.
Table 1: Example Pairwise Comparison Matrix for Ecosystem Service Criteria Stakeholder evaluation of main criteria using Saaty's scale for the goal: "Prioritize ecosystem services for management in Area X."
| Provisioning | Regulating | Cultural | Supporting | |
|---|---|---|---|---|
| Provisioning | 1 | 1/3 | 2 | 4 |
| Regulating | 3 | 1 | 4 | 5 |
| Cultural | 1/2 | 1/4 | 1 | 3 |
| Supporting | 1/4 | 1/5 | 1/3 | 1 |
Table 2: Computed Priority Weights and Consistency Check Local weights for main criteria and consistency ratio from the matrix in Table 1.
| Criterion | Local Weight | Consistency Ratio (CR) |
|---|---|---|
| Provisioning | 0.233 | 0.08 (Acceptable) |
| Regulating | 0.505 | |
| Cultural | 0.141 | |
| Supporting | 0.121 |
Reagent and Research Solutions
The "research reagents" for a Participatory AHP study are the essential methodological tools and software that enable the process.
Table 3: Research Reagent Solutions for Participatory AHP
| Item Category | Specific Examples & Functions |
|---|---|
| Stakeholder Engagement Tools | Power-Interest Grid [69]: A visual tool for categorizing and planning engagement with stakeholders based on their level of power and interest. RACI Matrix [69]: Clarifies roles and responsibilities in stakeholder engagement (Responsible, Accountable, Consulted, Informed). |
| Pairwise Comparison Elicitation | Saaty's 1-9 Scale [1] [2]: The fundamental ratio scale used to translate subjective judgments into numerical values for pairwise comparisons. Paper Questionnaires/Forms: Low-tech, accessible tools for capturing comparisons in group settings. |
| AHP Analysis Software | Expert Choice [2] [3]: Industry-leading commercial software designed specifically for AHP implementations. Prioritization Helper [2]: A cloud-based AHP application that integrates with platforms like Salesforce. R or Python packages (e.g., ahp in R): Open-source programming libraries for performing AHP calculations and consistency checks. |
| Consistency Assessment | Consistency Ratio (CR) [63] [2] [3]: A key metric to evaluate the coherence of the pairwise comparisons made by decision-makers. Inconsistency Index [2]: A related measure based on the maximum eigenvalue of the comparison matrix to quantify inconsistency. |
Case Study: Application in Agricultural Development
A compelling application of PAHP is documented in agricultural development projects in the Democratic Republic of Congo [66]. Researchers employed a modified PAHP for resource allocation in the Dioceses of Goma. The process actively engaged a diverse range of stakeholders to build consensus on criteria for sustainable agricultural development. The methodology turned common inconsistencies in pairwise comparisons from a problem into an opportunity, using them to stimulate productive debate and adjust local preferences. Operationally, this approach was successful not only in identifying a shared resource allocation pattern—which prioritized technical training (35%) and improved seeds (23%)—but also in training the project team, thereby building local capacity. This case underscores the utility of PAHP in reconciling diverse viewpoints and achieving actionable, consensus-based priorities in complex, real-world development contexts.
Software Solutions for Streamlining AHP Calculations and Analysis
The Analytic Hierarchy Process (AHP), developed by Thomas Saaty in the 1970s, is a multi-criteria decision analysis (MCDA) technique that empowers decision-makers to evaluate and prioritize alternatives based on both qualitative and quantitative factors [2]. For researchers in ecosystem service weighting, AHP provides a structured framework to decompose complex problems into a hierarchical structure, facilitating a systematic comparison of competing objectives such as biodiversity conservation, water purification, carbon sequestration, and recreational value [2] [70]. The method's capacity to incorporate both objective data and subjective expert judgments makes it particularly valuable in environmental decision-making contexts where multiple stakeholder perspectives must be synthesized [5] [61].
AHP employs pairwise comparisons to convert subjective judgments into numerical values on a scale from 1 to 9, where 1 indicates equal importance and 9 represents extreme importance of one element over another [5] [2]. This systematic approach allows researchers to quantify the relative importance of various ecosystem services, even when dealing with intangible benefits that lack market values. The mathematical foundation of AHP lies in eigenvector calculation, which transforms pairwise comparison matrices into numerical weights or priorities for each criterion and alternative [2]. The final step involves a weighted-sum model that combines the relative importance of each criterion with the performance scores of alternatives, resulting in an overall ranking [2].
Available Software Solutions for AHP
Implementing AHP manually for complex ecosystem service assessments can be computationally intensive. Fortunately, several specialized software solutions have been developed to streamline the process, enhance accuracy, and facilitate collaborative decision-making.
Table 1: Key AHP Software Solutions and Their Features
| Software Tool | Primary Application Context | Key Features | Stakeholder Collaboration Support |
|---|---|---|---|
| Expert Choice | General decision-making, project portfolio selection [70] | User-friendly interface, automated calculations, consistency checks, sensitivity analysis, resource alignment [70] | Comprehensive team tools for collaborative decision-making [70] |
| Prioritization Helper | Salesforce-integrated business applications [2] | Cloud-based, integrates with Salesforce platform, real-time calculations [2] | Designed for organizational decision-making within Salesforce environment [2] |
| PAPRIKA Method | Cognitive simplicity-focused applications [2] | Ordinal comparisons, choice-based questions, more natural decision-making process [2] | Not explicitly detailed in sources |
The selection of appropriate software depends on research requirements. Expert Choice stands out for comprehensive ecosystem service research due to its robust analytical capabilities, sensitivity analysis tools, and support for group decision-making processes [70]. For research teams already working within the Salesforce environment, Prioritization Helper offers seamless integration and real-time collaboration features [2]. The PAPRIKA method presents an alternative for studies prioritizing cognitive simplicity, though it may lack the mathematical rigor of traditional AHP for complex ecosystem service hierarchies [2].
Experimental Protocols for AHP Implementation in Ecosystem Service Research
Protocol 1: Hierarchical Structuring of Ecosystem Services
Objective: To create a structured hierarchy that decomposes the complex problem of ecosystem service valuation into manageable components.
Materials: AHP software (Expert Choice or web-based alternatives), expert panel, literature review on ecosystem services.
Procedure:
- Define Overall Goal: Clearly articulate the primary objective (e.g., "Weighting Ecosystem Services for Conservation Priority Setting").
- Identify Criteria (Stakeholder Groups): Based on the UNEP/SETAC guidelines, establish relevant stakeholder groups such as Local Community, Regional Society, Future Generations, and Biodiversity [5].
- Specify Sub-criteria (Ecosystem Services): Under each stakeholder group, list specific ecosystem services (e.g., under Local Community: provisioning services, cultural services).
- Identify Alternatives: Define the decision alternatives (e.g., different land management scenarios, conservation areas).
Validation: Review the hierarchy with domain experts to ensure completeness and relevance to the decision context.
Protocol 2: Pairwise Comparison and Weight Derivation
Objective: To systematically compare elements and derive priority weights for ecosystem services.
Materials: Structured hierarchy, AHP software, expert panel (minimum 3-5 experts per stakeholder group).
Procedure:
- Conduct Pairwise Comparisons: For each set of elements at the same hierarchical level, compare all possible pairs using Saaty's 1-9 scale [5].
- Input Judgments: Enter comparisons into AHP software, either through matrix input or sequential pairwise questions.
- Calculate Priorities: Software automatically computes local priorities using eigenvector method [2].
- Check Consistency: Software calculates consistency ratio (CR); values below 0.1 indicate acceptable consistency [2].
- Synthesize Results: Software aggregates local priorities across the hierarchy to generate global priorities for alternatives.
Validation: Conduct sensitivity analysis to test how changes in weights affect overall priorities [70].
Protocol 3: Group Decision-Making for Ecosystem Service Valuation
Objective: To aggregate individual judgments or priorities from multiple experts into a collective group decision.
Materials: AHP software with group decision support, expert panel representing diverse perspectives.
Procedure:
- Select Aggregation Method: Choose between aggregating individual judgments (AIJ) or aggregating individual priorities (AIP).
- Define Weighting: Determine if all experts have equal weight or if differential weighting based on expertise is required.
- Input Individual Assessments: Each expert completes their own pairwise comparison matrices.
- Calculate Group Priorities: Software mathematically synthesizes individual inputs according to selected aggregation method.
- Analyze Consensus: Use software features to measure consensus level among experts and identify areas of disagreement.
Validation: Conduct follow-up discussions with experts to resolve significant discrepancies and refine judgments.
Visualization of AHP Workflows
AHP Implementation Workflow
Ecosystem Service Hierarchy
The Scientist's Toolkit: Essential Research Reagents for AHP Studies
Table 2: Essential Research Reagents for AHP in Ecosystem Service Research
| Research Reagent | Function in AHP Analysis | Application Context in Ecosystem Services |
|---|---|---|
| Expert Panel | Provides subjective judgments through pairwise comparisons; represents diverse stakeholder perspectives [5] | Essential for valuing intangible ecosystem services where market data is unavailable |
| Structured Questionnaire | Collects pairwise comparison data systematically; ensures consistency across respondents [5] | Used in surveys to compare relative importance of different ecosystem services |
| Consistency Ratio (CR) | Measures logical coherence of pairwise comparisons; values <0.1 indicate acceptable consistency [2] | Quality control measure for expert judgments in ecosystem service valuation |
| Sensitivity Analysis | Tests robustness of results to changes in weights; identifies critical criteria influencing outcomes [70] | Determines how changes in ecosystem service weights affect conservation priorities |
| AHP Software Platform | Automates matrix calculations, eigenvector derivation, and priority synthesis [70] | Handles complex hierarchies with multiple ecosystem services and stakeholder groups |
The successful application of AHP in ecosystem service weighting research depends on appropriate software selection and rigorous implementation of methodological protocols. Software solutions like Expert Choice provide the computational infrastructure needed to manage complex hierarchies, facilitate stakeholder participation, and maintain mathematical rigor throughout the decision-making process. By following structured experimental protocols and utilizing the essential research reagents outlined in this article, researchers can generate transparent, defensible weightings for ecosystem services that support informed environmental policy and conservation planning. The integration of systematic AHP methodologies with specialized software tools represents a robust approach to addressing the inherent complexities of ecosystem service valuation in research and practice.
Environmental impact assessment (EIA) is a complex process of identifying, predicting, evaluating, and mitigating the biophysical, social, and other relevant effects of development proposals prior to major decisions being taken. Decision-making in environmental problems proves particularly challenging due to inherent trade-offs between sociopolitical, environmental, ecological, and economic factors, often involving multiple stakeholders with different priorities and objectives [71]. The inherent subjectivity and vagueness in human judgments about environmental impacts necessitate methodologies that can systematically handle uncertainty and ambiguity.
The integration of fuzzy set theory with the Analytical Hierarchy Process (AHP) creates a powerful hybrid methodology that effectively addresses these challenges. While traditional AHP has been widely applied in multi-criteria decision-making (MCDM) for environmental issues, it operates with crisp numbers that may not adequately represent the imprecision in human judgments [72]. Fuzzy AHP (FAHP) resolves this limitation by incorporating linguistic variables and fuzzy numbers, enabling decision-makers to express comparative judgments in more natural, approximate terms that better reflect the real-world ambiguity in environmental assessment processes [71] [73].
Key Applications in Environmental Assessment
Urban and Industrial Planning
The FAHP methodology has demonstrated significant utility in urban and industrial planning contexts. In a notable application for Istanbul's metropolitan planning, researchers developed an integrated fuzzy AHP–ELECTRE approach to assess environmental impacts generated by six different industrial districts [71]. The study employed a structured set of criteria including:
- Economic disturbance: Investment, employment, and income generation factors
- Environmental pollution: Air, water, and soil contamination risks
- Ecological destruction: Impacts on fauna, flora, and natural resources
- Social effect: Population density, cultural heritage, and public acceptance
- Technical feasibility: Infrastructure suitability and implementation considerations
This approach enabled the ranking of alternative industrial development schemes from the most to least environmentally risky, providing a systematic basis for urban industrial rehabilitation strategies [71].
Ecosystem Service-Based Spatial Planning
Recent research has integrated FAHP into ecosystem service-based spatial planning, as demonstrated in the Shenyang metropolitan area of China [74]. This application highlights FAHP's capacity to incorporate both quantitative and qualitative factors in spatial decision-making, where conventional approaches struggle with the complex, multi-dimensional nature of ecosystem services. The methodology facilitated the prioritization of spatial planning alternatives based on their contributions to critical ecosystem services while explicitly addressing the uncertainty inherent in such assessments.
Urban Park Management and Assessment
FAHP has proven valuable in urban green space management, as evidenced by its application to park quality assessment in Novi Sad City, Serbia [75]. Researchers utilized the fuzzy extent model to prioritize five city parks based on their present quality and projected importance, employing eight carefully selected criteria that incorporated aesthetic, ecological, and social perspectives. The evaluation explicitly accounted for uncertainties (fuzziness), the expert's risk tolerance, and different levels of optimism and pessimism, providing city planners with strategic guidance for the allocation of financial, organizational, and human resources for parks [75].
Table 1: Environmental Assessment Applications of Fuzzy AHP
| Application Domain | Key Assessment Criteria | Geographical Context | Reference |
|---|---|---|---|
| Urban Industrial Planning | Economic disturbance, Environmental pollution, Ecological destruction, Social effect, Technical feasibility | Istanbul, Turkey | [71] |
| Ecosystem Service-Based Spatial Planning | Ecosystem services, Spatial connectivity, Land use compatibility | Shenyang Metropolitan Area, China | [74] |
| Urban Park Quality Assessment | Aesthetic value, Ecological function, Social benefits, Maintenance requirements | Novi Sad City, Serbia | [75] |
| Urban Park Site Selection | Carbon storage, NDVI, Heat-island effect, Air pollution, Accessibility | Nanjing, China | [76] |
| Land Conflict Risk Assessment | Feasibility index, Controllability index, Social impact, Economic impact | Not specified | [72] |
Comparative Methodological Framework
Fundamental Fuzzy AHP Approaches
Several FAHP approaches have been developed, each with distinct characteristics and advantages for environmental applications:
Fuzzy Extent Analysis: This method, utilized in the Novi Sad urban park assessment, employs principles of fuzzy set theory to aggregate fuzzy sets with weights of decision elements at every hierarchy level, synthesizing fuzzified priorities following standard AHP principles [75]. Defuzzification of fuzzy weights to crisp values can be performed through multiple approaches, offering options for modeling decision makers' preferences and risk tolerance.
Logarithmic Fuzzy Preference Programming (LFPP): Developed to address limitations in earlier FAHP methods, LFPP formulates the priorities of a fuzzy pairwise comparison matrix as a logarithmic nonlinear programming problem and derives crisp priorities from fuzzy pairwise comparison matrices [77]. This approach provides a valid yet practical priority method for fuzzy AHP, minimizing potential inconsistencies in traditional methods.
q-Rung Orthopair Fuzzy AHP: As a more recent development, this approach employs triangular q-rung orthopair fuzzy numbers to handle uncertainty in decision-making processes [73]. This method allows for the sum of the qth power of satisfactory and non-satisfactory grades, constrained within the range of 1, providing a comprehensive framework for describing uncertain and vague data.
Integrated FAHP-GIS Approaches
The combination of FAHP with Geographic Information Systems (GIS) represents a particularly powerful methodology for spatial environmental assessments. In the Nanjing urban park site selection study, researchers applied fuzzy theory to both the weighting and standard classification processes, minimizing limitations caused by uncertainty in indicator data and inaccurate classification [76]. This integrated approach incorporated environmental factors such as normalized difference vegetation index (NDVI), heat-island effect, air pollution, and carbon storage as urban park site selection criteria, addressing sustainability concerns often overlooked in conventional site selection processes.
Table 2: Fuzzy AHP Methodological Variations in Environmental Applications
| Methodological Approach | Key Characteristics | Advantages | Environmental Application Examples |
|---|---|---|---|
| Fuzzy Extent Analysis | Uses geometric mean method to derive fuzzy weights and performance scores | Guarantees unique solution to reciprocal comparison matrix | Urban park quality assessment [75] |
| Logarithmic Fuzzy Preference Programming (LFPP) | Formulates priorities as logarithmic nonlinear programming | Addresses inconsistencies in earlier FAHP methods | Methodological improvement for environmental weighting [77] |
| Triangular q-Rung Orthopair Fuzzy AHP | Employs triangular q-rung orthopair fuzzy numbers | Enhanced capacity to handle uncertainty and minimize information loss | Consumer preference analysis for sustainable products [73] |
| Integrated FAHP-GIS | Combines fuzzy weighting with spatial analysis | Addresses both data uncertainty and inaccurate spatial classification | Urban park site selection [76] |
| FAHP-ELECTRE Integration | Combines fuzzy weighting with outranking relations | Handles both fuzziness and complex preference structures | Environmental impact assessment [71] |
Experimental Protocol: Implementing Fuzzy AHP for Environmental Assessments
Stage 1: Problem Structuring and Criteria Definition
Step 1: Establish Decision Hierarchy
- Define the overall goal of the environmental assessment
- Identify main criteria and sub-criteria relevant to the environmental decision context
- Structure these elements into a hierarchical model with the goal at the top, followed by criteria, sub-criteria, and alternatives at subsequent levels
Step 2: Expert Selection and Panel Formation
- Convene a multidisciplinary panel of experts with knowledge in relevant environmental domains
- Ensure representation of diverse perspectives (e.g., ecological, social, economic)
- For the Novi Sad park assessment, a single expert with strong academic and professional background in greenery studies was engaged, though group decision-making is possible with more experts and stakeholder representatives [75]
Stage 2: Fuzzy Pairwise Comparison
Step 3: Conduct Pairwise Comparisons Using Fuzzy Linguistic Scales
- Employ triangular fuzzy numbers (TFNs) to represent comparative judgments
- A triangular fuzzy number is typically denoted as à = (l, m, u), where l, m, and u represent the lower, modal, and upper values, respectively [75] [72]
- Convert linguistic terms (e.g., "equally important," "moderately more important," "strongly more important") to corresponding TFNs
- Construct fuzzy pairwise comparison matrices for each level of the hierarchy
Step 4: Calculate Fuzzy Weights
- Apply fuzzy extent analysis method: For a fuzzy pairwise comparison matrix Ã, compute the value of fuzzy synthetic extent with respect to the i-th object as: Si = ∑{j=1}^m M{gi}^j ⊗ [∑{i=1}^n ∑{j=1}^m M{gi}^j]^{-1}
- Where M{gi}^j (j = 1, 2, ..., m) are triangular fuzzy numbers
- Utilize Buckley's geometric mean method: calculate the geometric mean of each row in the pairwise comparison matrix, then compute the fuzzy weights by normalizing these geometric means [71]
Stage 3: Consistency Verification and Defuzzification
Step 5: Check Consistency of Judgments
- Defuzzify the fuzzy comparison matrices temporarily to check consistency ratios
- Maintain consistency ratio (CR) below 0.10 for acceptable consistency
- If CR exceeds threshold, review and revise pairwise comparisons
Step 6: Defuzzify Fuzzy Weights
- Convert fuzzy weights to crisp values using an appropriate defuzzification method
- Common approaches include the centroid method, mean of maxima, or the center of area method
- The centroid method for a triangular fuzzy number (l, m, u) is calculated as: Crisp value = (l + m + u) / 3
Stage 4: Synthesis and Sensitivity Analysis
Step 7: Synthesize Results Across Hierarchy
- Multiply the local weights through the hierarchy to obtain global weights for alternatives
- Rank alternatives based on their final priority scores
Step 8: Conduct Sensitivity Analysis
- Systematically vary input parameters or weights to assess the stability of results
- Examine how changes in criteria weights affect the final ranking of alternatives
- Present findings with appropriate visualizations to communicate robustness of results to decision-makers
Research Reagent Solutions: Essential Methodological Components
Table 3: Essential Methodological Components for Fuzzy AHP Implementation
| Component Category | Specific Elements | Function in FAHP Process | Implementation Considerations |
|---|---|---|---|
| Fuzzy Number Systems | Triangular Fuzzy Numbers (TFNs) | Represent imprecise comparative judgments | Typically use scale of (l, m, u) with m representing modal value |
| Trapezoidal Fuzzy Numbers | Alternative fuzzy representation for judgments | Provides additional flexibility in capturing uncertainty | |
| q-Rung Orthopair Fuzzy Sets | Handle both satisfactory and non-satisfactory grades | Enhanced capacity for modeling complex uncertainty [73] | |
| Linguistic Scales | Nine-point fundamental scale | Convert verbal judgments to fuzzy numbers | Adapt from Saaty's traditional scale with fuzzy extensions |
| Custom domain-specific scales | Capture expert knowledge in environmental contexts | Tailor to specific environmental assessment context | |
| Defuzzification Methods | Centroid (Center of Gravity) | Convert fuzzy numbers to crisp values | Most widely used approach |
| Weighted Average Method | Alternative defuzzification approach | Suitable for certain types of fuzzy numbers | |
| Mean of Maxima | Simple defuzzification approach | Less computationally intensive | |
| Software Tools | MATLAB, Python, R | Implement FAHP algorithms | Custom coding required |
| Specialized MCDM software | Pre-implemented FAHP modules | Limited availability for advanced FAHP variations | |
| GIS integration tools | Spatial implementation of FAHP | Essential for environmental spatial decisions [76] |
Workflow and Signaling Pathways
The following diagram illustrates the systematic workflow for implementing Fuzzy AHP in environmental assessments:
Fuzzy AHP Implementation Workflow for Environmental Assessments
The methodology proceeds through three main phases: (1) problem structuring and expert engagement; (2) fuzzy evaluation including pairwise comparisons, weight calculation, and consistency verification; and (3) results synthesis with sensitivity analysis to support final environmental decisions. The iterative consistency check ensures that expert judgments maintain logical coherence throughout the process.
Fuzzy AHP represents a sophisticated methodology for addressing the inherent uncertainties and ambiguities in environmental assessment processes. By integrating fuzzy set theory with the structured decision-making framework of AHP, this approach provides a robust mechanism for incorporating both quantitative and qualitative factors in environmental decisions. The versatility of Fuzzy AHP is demonstrated through its successful application across diverse environmental contexts including urban planning, ecosystem service assessment, park management, and spatial planning.
The continued refinement of Fuzzy AHP methodologies, including developments such as q-rung orthopair fuzzy sets and integrated FAHP-GIS approaches, promises enhanced capacity for handling complex environmental decisions under uncertainty. For researchers engaged in ecosystem service weighting and environmental assessment, Fuzzy AHP offers a mathematically rigorous yet practical framework for reconciling diverse perspectives and managing the inherent ambiguities in environmental valuation and decision-making processes.
Validating AHP Results and Comparative Analysis with Alternative Methods
Methods for Validating AHP Outcomes in Ecosystem Service Assessments
The Analytic Hierarchy Process (AHP) has emerged as a pivotal multi-criteria decision-making (MCDM) tool in ecosystem service assessments, enabling researchers to systematically evaluate complex environmental trade-offs. As ecosystem service research increasingly informs critical policy and conservation decisions, establishing robust validation protocols for AHP outcomes becomes paramount. This protocol details comprehensive methods for validating AHP results, focusing on consistency measurement, sensitivity analysis, and collaborative verification to ensure scientifically defensible outcomes in environmental decision-making contexts. The validation framework addresses both mathematical robustness and contextual appropriateness for ecosystem service applications, where criteria often encompass diverse ecological, social, and economic dimensions [5] [78].
Fundamental Validation Metrics
Consistency Ratio Assessment
The consistency ratio (CR) is the primary statistical metric for validating the logical coherence of pairwise comparison judgments in AHP. According to Saaty's established standard, a CR value ≤ 0.10 indicates acceptable consistency, while values exceeding this threshold suggest potentially problematic inconsistencies that may compromise results [79] [80].
Table 1: Random Consistency Index (RI) Values for Different Matrix Sizes
| Number of Criteria (n) | Random Index (RI) |
|---|---|
| 1 | 0.00 |
| 2 | 0.00 |
| 3 | 0.58 |
| 4 | 0.90 |
| 5 | 1.12 |
| 6 | 1.24 |
| 7 | 1.32 |
| 8 | 1.41 |
| 9 | 1.45 |
| 10 | 1.49 |
The calculation involves a four-step process:
- Compute Principal Eigenvalue (λmax): Derived from the pairwise comparison matrix and priority vector [79].
- Calculate Consistency Index (CI): Using the formula CI = (λmax - n)/(n - 1), where n represents the number of criteria being compared [80] [78].
- Determine Random Index (RI): Reference values established through random matrix generation (Table 1) [80].
- Compute Consistency Ratio: CR = CI/RI [79] [80].
For a hypothetical ecosystem service assessment with n=3 criteria and λmax=3.0857:
- CI = (3.0857 - 3)/2 = 0.04285
- CR = 0.04285/0.58 = 0.0739 → Acceptable consistency [79]
Transitivity Rule Application
The transitivity rule provides an alternative approach to ensure consistency by enforcing logical relationships between criteria. If Criterion A is preferred twice as much as B, and B three times as much as C, then A must be preferred six times as much as C. This method significantly reduces the number of required pairwise comparisons from ½n(n-1) to (n-1), while guaranteeing perfect consistency (CR=0) [79]. However, this approach may oversimplify human judgment in complex ecosystem service evaluations where perfect transitivity may not reflect nuanced expert perspectives.
Advanced Validation Protocols
Sensitivity Analysis Framework
Sensitivity analysis determines how vulnerable final rankings are to changes in criterion weights, testing the stability of AHP outcomes under uncertainty. This is particularly valuable in ecosystem service assessments where stakeholder values may shift or data uncertainty exists.
Table 2: Sensitivity Analysis Methods for AHP Validation
| Method | Application Protocol | Interpretation Guidance |
|---|---|---|
| Weight Perturbation | Systematically vary individual criterion weights by ±5-10% while renormalizing others | Outcome stability indicates robust results; high sensitivity suggests need for refinement |
| Scenario Testing | Model different stakeholder perspectives by applying weight sets from different expert groups | Identifies criteria most susceptible to divergent perspectives [5] |
| Threshold Analysis | Determine the minimum change in weights that would alter alternative rankings | Quantifies decision space robustness and margin of error in conclusions |
Participatory Consistency Improvement
When facing high CR values (>0.10), these participatory methods can improve consistency without compromising expert judgment:
- Identify Most Inconsistent Judgments: Software tools can highlight the 3-5 most inconsistent pairwise comparisons for re-evaluation [81].
- Iterative Feedback Process: Present experts with their original judgments alongside the logically consistent values, allowing deliberate refinement [78].
- Scale Adjustment: Transition from the standard AHP scale to a balanced scale, which has demonstrated median CR improvement from 16% to 6% in practical applications [81].
Experimental Protocol for AHP Validation
Pre-Validation Setup
Criteria Selection Optimization
- Limit criteria to 5-7 whenever possible, adhering to the "magical number seven, plus or minus two" principle of human information processing capacity [81].
- For complex ecosystem service assessments requiring more criteria, implement hierarchical clustering with 5-9 criteria per cluster [5] [78].
- Clearly define each ecosystem service criterion with operational definitions to minimize interpretation variance among experts [5].
Expert Panel Recruitment
- Engage 15-30 experts with diverse specializations relevant to the assessed ecosystem services [78].
- Include representation from academia, government agencies, community stakeholders, and relevant NGOs to capture multifaceted perspectives [5] [78].
- Provide comprehensive training on the AHP process and the specific ecosystem service context before commencing evaluations.
Implementation and Data Collection
Structured Data Collection Protocol
- Utilize specialized AHP software platforms that provide real-time consistency feedback during pairwise comparison entry [79] [81].
- Present criteria in randomized order to mitigate sequence effects in expert judgments.
- Implement transitive consistency checks where the system automatically informs participants of logical implications from their previous judgments [78].
- Allow experts to revisit and revise previous comparisons throughout the process to enable self-correction.
Data Quality Control
- Monitor CR values in real-time during data collection.
- Establish a protocol for discussing and resolving consistently high CR values (>0.20) with participants [81].
- Document all expert comments and concerns regarding specific comparisons for contextual interpretation of results.
Post-Hoc Validation Analysis
Consistency Threshold Application
- Apply the standard CR ≤ 0.10 threshold for studies requiring high mathematical rigor [79] [80].
- Consider context-dependent flexibility for complex ecosystem service assessments, where CR values up to 0.20 may be acceptable depending on the decision stakes and number of criteria [81].
- Document and justify any deviations from standard consistency thresholds in methodology reporting.
Comparative Analysis
- Conduct separate AHP weighting exercises with different expert subgroups (e.g., ecologists vs. economists) to identify systematic perspective differences [5].
- Compare AHP-derived weights with those from objective weighting methods (e.g., entropy weight) where data availability permits, examining convergence and divergence patterns [82].
Visualization of AHP Validation Workflow
Research Reagent Solutions
Table 3: Essential Tools for AHP Validation in Ecosystem Service Research
| Tool Category | Specific Solutions | Application in Validation |
|---|---|---|
| AHP Software Platforms | SpiceLogic AHP Software [79] | Real-time CR calculation and inconsistency highlighting |
| BPMSG AHP Online System [81] | Balanced scale implementation and sensitivity testing | |
| Statistical Analysis | R with 'ahpsurvey' package | Advanced consistency analysis and subgroup comparison |
| Python with NumPy/SciPy [78] | Custom CI/CR calculation and matrix analysis | |
| Data Collection Tools | Online survey platforms with transitive logic [78] | Automated consistency checks during expert evaluation |
| Reference Materials | Random Index (RI) lookup tables [80] | Benchmarking calculated CR against established standards |
Validating AHP outcomes in ecosystem service assessments requires a multi-faceted approach that addresses both mathematical consistency and contextual appropriateness. By implementing the comprehensive validation protocol outlined above—incorporating rigorous CR assessment, systematic sensitivity analysis, and structured participatory processes—researchers can significantly enhance the credibility and utility of their findings. These validation methods are particularly crucial in ecosystem service applications where decisions often involve significant ecological and social consequences, limited data availability, and diverse stakeholder perspectives. Properly validated AHP outcomes provide a scientifically defensible foundation for environmental decision-making, policy development, and sustainable ecosystem management.
Within ecosystem service research, effectively weighting multiple, often competing criteria is a fundamental challenge. The selection of a weighting method directly influences the outcomes of assessments, priority settings, and subsequent resource allocation decisions [22]. This application note provides a comparative analysis of three established Multi-Criteria Decision-Making (MCDM) weighting techniques—the Analytic Hierarchy Process (AHP), the Budget Allocation (BA) method, and Factor Analysis (FA)—framed within the context of ecosystem service research. We detail their methodologies, present a quantitative comparison, and provide explicit experimental protocols for their application, enabling researchers to select and implement the most appropriate technique for their specific scientific questions.
Core Principles of Each Weighting Method
Analytic Hierarchy Process (AHP): AHP is a structured technique for organizing and analyzing complex decisions, based on mathematics and psychology [3]. It decomposes a problem into a hierarchy of criteria and sub-criteria, and uses pairwise comparisons to derive a ratio scale of relative importance [14] [2]. A key feature is its built-in consistency check (Consistency Ratio) to validate the coherence of expert judgments [2].
Budget Allocation (BA) Method: A direct weighting method where experts are given a fixed "budget" of points (e.g., 100) to distribute among criteria or indicators, reflecting their perceived relative importance [22]. The BA method is valued for its simplicity and intuitive nature, making it accessible to participants without a deep background in decision theory.
Factor Analysis (FA): A statistical, data-driven approach used to identify the underlying structure in a dataset. It explains the variability among observed, correlated variables in terms of a potentially lower number of unobserved, independent factors [22] [83]. In weighting, the factor loadings (λ) can be used to derive weights, grounding them in the empirical structure of the data itself rather than subjective preference [83].
The table below synthesizes the key characteristics of the three methods for easy comparison.
Table 1: Comparative Analysis of AHP, Budget Allocation, and Factor Analysis for Ecosystem Service Weighting
| Feature | Analytic Hierarchy Process (AHP) | Budget Allocation (BA) | Factor Analysis (FA) |
|---|---|---|---|
| Nature of Approach | Subjective, based on expert judgment | Subjective, based on expert judgment | Objective, data-driven, statistical |
| Theoretical Basis | Mathematical psychology; eigenvector calculation [2] | Simple point allocation; arithmetic mean [22] | Multivariate statistics; variance extraction [83] |
| Core Process | Pairwise comparisons using Saaty's 1-9 scale [14] | Direct allocation of a fixed point budget [22] | Analysis of variable correlations to derive latent factors [83] |
| Consistency Check | Yes (Consistency Ratio) [2] | No | Yes (Model fit statistics, e.g., KMO, Bartlett's test) |
| Handling of Complexity | Excellent via hierarchical structuring [3] [5] | Good for a limited number of criteria | Excellent for reducing data dimensionality [83] |
| Key Output | Priority weights (eigenvector) | Average allocated points | Factor loadings (λ), Communalities |
| Primary Application Context | Complex decisions with multiple tangible and intangible criteria [3] | Straightforward weighting problems with limited criteria | Identifying latent constructs and deriving weights from dataset structure [22] |
Experimental Protocols for Ecosystem Service Weighting
Protocol 1: Implementing the Analytic Hierarchy Process (AHP)
Application Context: Determining the relative importance of ecosystem service indicators (e.g., Water Conservation, Soil Conservation, Carbon Storage, NPP) for a composite index [84].
Workflow Diagram: AHP Implementation Workflow
Detailed Procedure:
Structure the Decision Hierarchy:
- Define the overall goal at the top (e.g., "Assess Overall Ecosystem Service Value").
- Identify the main criteria or pillars (e.g., "Regulating Services," "Provisioning Services").
- Decompose these into measurable indicators at the bottom level (e.g., "Water Conservation," "Carbon Storage," "NPP") [5].
Construct Pairwise Comparison Matrices:
- For each level of the hierarchy, create a matrix where each indicator is compared to every other indicator concerning their contribution to the element above.
- Use Saaty's 1-9 scale for comparisons, where 1 indicates equal importance and 9 indicates extreme importance of one over another [2].
Elicit Expert Judgments:
- Engage a panel of experts (e.g., ecologists, policy makers, geographers). A sample size of 10-15 is often sufficient, though more may be needed for diverse stakeholder groups [5].
- Experts complete the pairwise comparison matrices. This can be done via specialized software (e.g., Expert Choice, TransparentChoice) or custom surveys [22] [14].
Calculate Priority Weights:
- For each comparison matrix, compute the principal eigenvector. This vector represents the relative priorities (weights) of the indicators.
- The mathematical foundation involves solving the equation:
(A – λ_max I)w = 0, whereAis the comparison matrix,λ_maxis the principal eigenvalue, andwis the eigenvector (priority vector) [5] [2]. - Aggregate individual expert judgments using the geometric mean to form a group priority vector [14].
Check Consistency:
- Calculate the Consistency Index (CI) and Consistency Ratio (CR).
CR = CI / RI, where RI is the Random Index. - A CR ≤ 0.10 (or 10%) is considered acceptable. A higher value suggests judgments may be random and should be reviewed [2].
- Calculate the Consistency Index (CI) and Consistency Ratio (CR).
Protocol 2: Implementing the Budget Allocation (BA) Method
Application Context: Rapid assessment and initial weighting of a moderate number of ecosystem service indicators.
Detailed Procedure:
Define the Set of Indicators:
- Present experts with the final list of indicators to be weighted (e.g., the 14 indicators across three pillars as seen in transformative knowledge potential studies) [22].
Allocate the Budget:
- Provide each expert with a fixed budget of 100 points.
- In a one-step process, ask experts to distribute all 100 points among the indicators directly, assigning more points to more important indicators.
- In a two-step process (for hierarchical structures), first allocate points among the top-level pillars, then distribute each pillar's points among its constituent indicators [22].
Calculate Final Weights:
- For each indicator, calculate the average number of points assigned across all experts.
- Normalize the average points so that the final weights for all indicators sum to 1.0 (or 100%).
Protocol 3: Implementing Factor Analysis for Weighting
Application Context: Deriving data-driven weights for ecosystem service indicators based on observed spatial or temporal datasets, and identifying latent constructs.
Workflow Diagram: Factor Analysis Workflow for Weighting
Detailed Procedure:
Data Collection and Preparation:
- Compile a dataset where rows represent spatial units (e.g., pixels, counties) or time periods, and columns represent the different ecosystem service indicators (e.g., Water Conservation, NPP, Carbon Storage values) [84].
- Ensure data is standardized (e.g., z-scores) to make variables comparable.
Assess Suitability for Factor Analysis:
- Perform the Kaiser-Meyer-Olkin (KMO) test to measure sampling adequacy (values > 0.7 are good).
- Perform Bartlett's test of sphericity (a significant p-value < 0.05 indicates that correlations between variables are sufficient for FA) [83].
Extract Initial Factors:
- Use a method like Principal Component Analysis (PCA) to determine the number of factors to retain.
- Retain factors with eigenvalues greater than 1 (Kaiser's criterion) or based on a scree plot.
Rotate the Factor Matrix:
- Apply an orthogonal rotation method (e.g., Varimax) to simplify the factor structure, making it easier to interpret. This maximizes high loadings and minimizes low ones for each variable [83].
Interpret Factors and Derive Weights:
- Interpret the latent construct that each rotated factor represents based on the variables that load highly on it.
- Calculate weights for each original indicator. A common approach is to use the communality (h²), which represents the proportion of each variable's variance explained by the retained factors. Alternatively, the sum of squared factor loadings for a variable can be used. Weights are then derived by normalizing these values across all indicators.
The Scientist's Toolkit: Essential Research Reagents & Materials
Table 2: Key Software and Analytical Tools for Weighting Methods
| Tool Name / Category | Primary Function | Application in Weighting Research |
|---|---|---|
| Expert Choice | Dedicated AHP Software | Facilitates hierarchy building, pairwise comparisons, eigenvector calculation, and consistency checking in AHP [2]. |
| TransparentChoice | Cloud-Based AHP Platform | Enables collaborative AHP modeling and decision-making, suitable for distributed expert panels [14]. |
| Statistical Software (R, Python, SPSS) | General Statistical Analysis | Essential for conducting Factor Analysis (EFA, CFA, PCA), calculating suitability tests, and deriving factor-based weights [83]. |
| Google Earth Engine (GEE) | Geospatial Data Processing & Analysis | Provides a platform for processing large-scale remote sensing data to calculate ecosystem service indicators (e.g., NPP, Water Conservation) [84]. |
| Survey Platforms (Qualtrics, LimeSurvey) | Questionnaire Administration | Customized to deploy pairwise comparison surveys for AHP or budget allocation tasks to expert groups [22] [5]. |
| Geodetector | Spatial Variance Analysis | Used in ecosystem service studies to identify driving factors and their interactions affecting the spatial distribution of services [84]. |
Assessing Sensitivity to Small Changes in Input Judgments
In ecosystem service weighting research, the Analytic Hierarchy Process (AHP) provides a structured framework for integrating diverse expert judgments and stakeholder values. However, the subjective nature of pairwise comparison judgments introduces potential instability in final weights and rankings. Sensitivity analysis addresses this critical uncertainty by quantifying how small variations in input judgments affect model outcomes, establishing confidence in the resulting ecosystem service priorities [25]. For environmental decision-making where resources must be allocated to protect vital services like water purification, climate regulation, and biodiversity, establishing robust weightings is both scientifically essential and ethically necessary.
This protocol provides detailed methodologies for implementing sensitivity analysis within AHP frameworks specific to ecosystem service research. We present experimental procedures adapted from established practices in ecological modeling [85] and supply chain management [57], validated through case studies from recent environmental research [25] [86].
Theoretical Framework
The Role of Sensitivity Analysis in AHP
Sensitivity analysis systematically examines how uncertainty in AHP's input parameters—the pairwise comparison judgments—propagates through the model to affect the output priorities and rankings. In ecosystem service research, this is particularly crucial because:
- Expert judgments vary based on disciplinary backgrounds and experiences
- Stakeholder values reflect diverse cultural and socioeconomic perspectives
- Spatial and temporal complexities create inherent uncertainties in ecological systems
- Policy consequences of weighting decisions necessitate robust validation
The integration of statistical validation techniques, including sensitivity analysis, into AHP frameworks enhances robustness and addresses potential subjectivity, as demonstrated in recent sustainable supplier selection research [57]. This approach is equally vital for ecosystem service weighting to ensure results remain stable under reasonable variations in input judgments.
Foundational Concepts
Sensitivity analysis in normative economic models provides a theoretical framework for understanding how decision support systems respond to parameter variations [85]. The DPSIRM (Driving force-Pressure-State-Impact-Response-Management) framework, recently applied in ecological sensitivity studies [86], offers a complementary approach for structuring ecosystem service assessments within which AHP weighting occurs.
Experimental Protocols
Core Sensitivity Analysis Methodology
Protocol: One-Way Sensitivity Analysis
Purpose: To examine how variation in a single pairwise comparison judgment affects ecosystem service priority weights.
Materials:
- Completed AHP pairwise comparison matrix for ecosystem services
- Calculation of normalized priority weights
- Statistical software (R, Python) or specialized MCDA tools
Procedure:
- Identify Critical Judgment: Select the pairwise comparison element (a_{ij}) representing the judgment between ecosystem service (i) and (j)
- Define Variation Range: Systematically vary (a_{ij}) across a plausible range (e.g., ±1, ±2 on the Saaty scale) while maintaining reciprocal values
- Recalculate Weights: For each variation, compute new priority vectors using standard AHP eigenvector methods
- Measure Output Changes: Track resulting changes in:
- Individual criterion weights
- Overall ranking of ecosystem services
- Weight distribution patterns
Interpretation: Note the threshold values where ranking changes occur and identify which ecosystem services are most sensitive to specific judgment variations [57].
Protocol: Monte Carlo Simulation for Probabilistic Analysis
Purpose: To assess combined effects of multiple judgment variations simultaneously using probability distributions.
Procedure:
- Define Probability Distributions: Assign distributions to each pairwise comparison judgment (triangular distributions centered on original values are commonly used)
- Generate Random Samples: Create numerous (1,000-10,000) random AHP matrices based on defined distributions
- Compute Priority Distributions: Calculate priority weights for each random matrix
- Analyze Results:
- Compute confidence intervals for each ecosystem service weight
- Calculate probability of each possible ranking order
- Identify stable vs. uncertain portions of the ranking
Application Note: This method is particularly valuable when stakeholder judgments show significant divergence, as commonly occurs in multidisciplinary ecosystem service assessments [85].
Advanced Implementation: AHP-OWA Integration
Recent ecological sensitivity research has demonstrated the enhanced robustness of integrating AHP with Ordered Weighted Averaging (OWA) operators [86]. This approach enables scenario-based sensitivity testing under different decision-maker attitudes:
Protocol Extension:
- Implement AHP-OWA Framework: Combine AHP-derived weights with OWA weighting vectors representing optimistic, pessimistic, and neutral scenarios
- Calculate Scenario-Specific Priorities: Compute ecosystem service weights under each decision attitude
- Compare Scenario Outcomes: Identify which ecosystem service priorities remain stable across scenarios and which are scenario-dependent
This integrated approach proved effective in the Chengdu-Chongqing Urban Agglomeration study, revealing how ecological sensitivity rankings shifted under different decision-making perspectives [86].
Data Presentation and Analysis
Quantitative Measures of Sensitivity
The following metrics provide standardized approaches for quantifying sensitivity in AHP-based ecosystem service weighting:
Table 1: Sensitivity Metrics for AHP-based Ecosystem Service Weighting
| Metric | Calculation | Interpretation | Threshold Guidelines |
|---|---|---|---|
| Rank Reversal Frequency | Percentage of simulations where service ranking changes | Measures ranking stability | <5%: Highly stable5-15%: Moderately stable>15%: Unstable ranking |
| Weight Coefficient of Variation | (Standard deviation of weight) / (Mean weight) | Measures weight precision | <0.1: Low variability0.1-0.25: Moderate variability>0.25: High variability |
| Critical Judgment Impact | Maximum weight change when varying single judgment | Identifies most influential comparisons | >20% change: Highly critical judgment |
| Confidence Interval Width | 95% CI upper bound - lower bound | Quantifies uncertainty in weight estimation | <0.05: High precision0.05-0.1: Moderate precision>0.1: Low precision |
Case Study: Sanitation Priority Index Development
A recent study developing a Sanitation Priority Index (SPI) using fuzzy AHP demonstrates practical sensitivity analysis implementation [25]. The research quantified criterion influences through comprehensive sensitivity testing:
Table 2: Criterion Weight Sensitivity from Sanitation Priority Case Study
| Ecosystem Service Criterion | Base Weight (%) | Sensitivity Range (±%) | Stability Rating |
|---|---|---|---|
| Demographic factors | 20.38 | 1.2 | High |
| Water consumption patterns | 16.76 | 2.1 | High |
| Wastewater reuse potential | 15.40 | 3.8 | Medium |
| Environmental risks | 12.40 | 4.5 | Medium |
| Utilities' competency | 11.50 | 1.7 | High |
| Industrial waste risks | 8.72 | 5.2 | Low |
| Socioeconomic context | 5.10 | 6.8 | Low |
| License constraints | 4.80 | 2.3 | High |
| Geographical constraints | 4.51 | 1.9 | High |
The sensitivity analysis revealed "almost complete stability in prioritizing communities" despite variations in input judgments, validating the model's robustness for decision-making [25]. This level of stability provides high confidence for policy implementation based on the resulting priority rankings.
Implementation Tools
Research Reagent Solutions
Table 3: Essential Tools for Sensitivity Analysis Implementation
| Tool Category | Specific Solutions | Application Function | Field-Specific Utility |
|---|---|---|---|
| Specialized Software | Expert Choice, Super Decisions, MMSS | Automated sensitivity analysis | Pre-packaged algorithms for rapid implementation |
| Statistical Packages | R (decisionSupport package), Python (PyDecision) | Custom sensitivity modeling | Flexibility for ecosystem-specific adaptations |
| Visualization Tools | R (ggplot2), Python (Matplotlib) | Results communication | Create intuitive graphs for stakeholder engagement |
| AHP Extensions | Fuzzy AHP [25], AHP-OWA [86] | Advanced uncertainty handling | Manage linguistic judgment ambiguity in expert elicitation |
Experimental Workflow Visualization
Validation and Interpretation Framework
Statistical Validation Techniques
Recent research demonstrates that integrating statistical validation with AHP significantly enhances result credibility [57]. For ecosystem service applications, we recommend:
Pearson Correlation Analysis:
- Calculate correlation coefficients between criterion weights across sensitivity iterations
- High correlations (>0.8) indicate structural stability in weight relationships
- Low correlations (<0.5) suggest fundamental ranking instability
Confidence Interval Estimation:
- Compute 95% confidence intervals for ecosystem service weights
- Use bootstrap methods if probability distributions are unknown
- Report intervals alongside point estimates in final results
Decision Rules for Robustness Assessment
Establish clear thresholds for determining acceptable sensitivity levels:
- Ranking Stability: No rank reversals for top-tier ecosystem services in >95% of simulations
- Weight Stability: Coefficient of variation <0.2 for critical ecosystem service weights
- Judgment Confidence: Critical judgments (impact >20%) should have high expert consensus
Implementing comprehensive sensitivity analysis is not merely a technical validation step but an essential component of rigorous ecosystem service research using AHP. The protocols presented here, drawn from recent advancements in environmental and supply chain applications [25] [86] [57], provide researchers with structured methodologies for quantifying and reporting the robustness of their weighting results.
By systematically assessing sensitivity to small changes in input judgments, the ecosystem service research community can enhance methodological transparency, improve decision confidence, and ultimately deliver more scientifically-defensible prioritizations for environmental management and policy development.
The sustainable management of agricultural landscapes necessitates a careful balance between the provisioning service of food production and the regulating services provided by ecosystems, such as water purification, climate regulation, and erosion control [87]. Understanding the trade-offs between these services is critical for informing land-use policy and agricultural practice [16]. The Analytic Hierarchy Process (AHP) offers a structured, multi-criteria decision-making framework that allows researchers to integrate quantitative biophysical data with stakeholder preferences to systematically weight and evaluate these competing ecosystem services [36] [88]. This application note details the protocols for applying AHP to analyze trade-offs between agricultural production and regulating services, using the Loess Plateau of China as a primary case study [16].
Methodological Protocols
Integrated Assessment Framework for Trade-Off Analysis
The study on the Loess Plateau employed an integrated assessment framework combining biophysical modeling, economic valuation, and trade-off analysis to evaluate three distinct land management scenarios [16]:
- Business-as-Usual (BAU): Represents the continuation of current land management practices.
- Ecological Restoration: Prioritizes enhancing regulating and supporting services, often through programs like 'Grain for Green' [16].
- Sustainable Intensification: Aims to increase agricultural output while maintaining a moderate level of other ecosystem services [16].
The core methodology can be broken down into four interconnected stages, as illustrated below.
Quantitative Data and Scenario Outcomes from the Loess Plateau
The application of this framework on the Loess Plateau yielded clear, quantifiable trade-offs. The table below summarizes the key findings, demonstrating how different management priorities lead to distinct outcomes in service provision [16].
Table 1: Trade-offs between agricultural production and regulating services under different land management scenarios in the Loess Plateau [16]
| Ecosystem Service Indicator | Business-as-Usual Scenario | Ecological Restoration Scenario | Sustainable Intensification Scenario |
|---|---|---|---|
| Provisioning Services | |||
| Agricultural Production | Baseline (0% change) | -15% | +15% |
| Regulating & Supporting Services | |||
| Water Yield | Baseline | Maximized | Moderate |
| Soil Conservation | Baseline | Maximized | Moderate |
| Carbon Sequestration | Baseline | Maximized | Moderate |
| Biodiversity | Baseline | Maximized | Moderate |
AHP-Based Weighting Protocol for Ecosystem Services
The AHP is central to synthesizing complex, multi-dimensional data into a structured decision-making process. The following protocol outlines the key steps for implementing AHP in ecosystem service trade-off analysis.
Construct the Hierarchy Model:
- Goal: Identify the optimal land management strategy for balancing agricultural production and regulating services [16].
- Criteria: Major ecosystem service categories (e.g., Provisioning, Regulating, Supporting) [16] [36].
- Sub-criteria: Specific ES indicators (e.g., Crop Yield, Water Yield, Soil Conservation, Carbon Sequestration, Biodiversity) as detailed in Table 1 [16].
Elicit Stakeholder Preferences:
- Stakeholder Identification: Engage a representative range of stakeholders (e.g., farmers, government policymakers, conservationists, local communities) to capture diverse perspectives and values [89] [90].
- Preference Elicitation: Conduct surveys or interviews using pairwise comparison matrices. Stakeholders are asked to compare the relative importance of two criteria at a time (e.g., "How much more important is Crop Yield compared to Water Yield?") using a standardized scale (e.g., 1-9) [88].
Compute Priority Weights:
- Matrix Construction: Compile the pairwise comparisons into a reciprocal matrix for each stakeholder or stakeholder group.
- Eigenvector Calculation: Compute the normalized principal eigenvector of the matrix to derive the priority weights for each ecosystem service. This step quantifies the relative importance of each service [36] [88].
- Consistency Check: Calculate the Consistency Ratio (CR) to ensure that the pairwise judgments are logically coherent. A CR value of less than 0.10 is generally acceptable [88].
Develop and Evaluate Scenarios:
- Apply the derived AHP weights to the quantified ES indicators (e.g., from Table 1) under different land management scenarios.
- Use a weighted linear combination or other Multi-Criteria Decision Analysis (MCDA) technique to calculate an overall performance score for each scenario [16] [36]. The scenario with the highest score best aligns with the stakeholder-derived priorities.
The Scientist's Toolkit: Research Reagent Solutions
Successful implementation of the AHP protocol relies on a suite of analytical tools and models. The following table describes the essential "research reagents" for this field.
Table 2: Key Reagents and Tools for Ecosystem Service Trade-off Analysis
| Tool / Reagent | Type | Primary Function | Application Example |
|---|---|---|---|
| InVEST Model Suite | Software Model | Spatially explicit mapping and valuation of ecosystem services. | Quantifying water yield, soil conservation, and carbon sequestration [16]. |
| AHP Software (e.g., R, Expert Choice) | Analytical Tool | Structuring and computing pairwise comparisons to derive priority weights. | Calculating stakeholder-driven weights for ES indicators [36] [88]. |
| LULC Maps & Remote Sensing Data | Spatial Data | Providing base data on land cover, a key proxy for ecosystem service potential. | Land-use classification and change analysis over time [16] [36]. |
| RUSLE Model | Empirical Model | Predicting average annual soil loss caused by rainfall and associated runoff. | Estimating the soil conservation service [16]. |
| CASA Model | Process Model | Estimating Net Primary Productivity (NPP) from remote sensing data. | Modeling carbon sequestration and ecosystem productivity [16]. |
Applications and Strategic Insights
The AHP framework's primary application is to move beyond singular objectives and inform multifunctional landscape planning. By quantifying trade-offs, it helps identify management strategies that can balance competing demands. For instance, in the Loess Plateau, the "Sustainable Intensification" scenario presented a viable pathway to increase food production without completely sacrificing environmental integrity [16].
A critical insight from this methodology is the importance of participatory planning. Integrating diverse stakeholders through AHP ensures that management strategies are not only scientifically sound but also socially legitimate and responsive to local values [89] [90]. This is vital for the long-term success of any land-use initiative. Furthermore, the framework supports spatial targeting of interventions, such as agri-environmental schemes, by identifying areas with the highest potential for ecosystem service improvement through management changes [91]. Finally, bundling ecosystem services, as demonstrated in Tuscan landscapes, allows planners to manage for synergies and avoid unintended trade-offs, thereby enhancing overall landscape resilience [36].
Evaluating AHP Performance in Group Decision-Making Contexts
Application Notes
Theoretical Foundation in Ecosystem Service Research
The Analytic Hierarchy Process (AHP) provides a structured technique for organizing and analyzing complex decisions based on mathematics and psychology, making it particularly valuable for ecosystem service weighting where multiple stakeholders and competing criteria must be balanced [3]. In group decision-making contexts, AHP enables the decomposition of complex ecological valuation problems into hierarchical structures, facilitating collaborative problem-solving among researchers, policymakers, and community stakeholders. The method's capacity to integrate both tangible and intangible factors aligns perfectly with the multidimensional nature of ecosystem services, which often include economic, ecological, and social values that are difficult to compare directly [92].
AHP operates on three fundamental principles: decomposition of complex problems into hierarchical structures, comparative judgments through pairwise comparisons, and synthesis of priorities [93]. This structured approach is particularly beneficial for ecosystem service research where diverse perspectives from ecological experts, economists, and community representatives must be integrated into a coherent decision-making framework. The mathematical rigor of AHP, based on matrix algebra and eigenvector calculations, provides a solid foundation for deriving weights that reflect the collective priorities of diverse stakeholders involved in environmental management decisions [14].
Performance Metrics for Group Decision-Making
The effectiveness of AHP in group settings for ecosystem service weighting can be evaluated through several quantitative metrics, with the Consistency Ratio (CR) serving as a primary indicator of judgment reliability. As shown in Table 1, different CR thresholds determine the acceptability of pairwise comparison matrices, ensuring that stakeholder judgments maintain logical coherence throughout the evaluation process [14].
Table 1: AHP Performance Metrics for Group Decision-Making
| Metric | Target Value | Purpose | Interpretation in Ecosystem Context |
|---|---|---|---|
| Consistency Ratio (CR) | ≤ 0.10 | Measures logical coherence of judgments | Values >0.10 indicate inconsistent stakeholder preferences regarding ecosystem trade-offs |
| Geometric Mean Index | N/A (Higher is better) | Aggregates individual judgments | Ensures no single stakeholder dominates the weighting of ecosystem services |
| Inter-group Concordance | ≥ 0.70 | Measures agreement between different stakeholder groups | Low values suggest conflicting priorities between ecological, economic, and social perspectives |
| Priority Stability Index | ≥ 0.85 | Tests robustness of results to small judgment changes | Ensures ecosystem service rankings remain stable despite minor preference variations |
| Time to Consensus (minutes) | Varies by group size | Efficiency metric for group decision process | Larger, multi-stakeholder groups typically require more facilitated discussion time |
Additional performance indicators include the Inter-group Concordance Coefficient, which quantifies the degree of agreement between different stakeholder groups (e.g., environmental scientists versus economic stakeholders), and the Priority Stability Index, which measures the robustness of ecosystem service weights to minor changes in individual judgments [94] [92]. These metrics are particularly important in environmental decision-making where long-term policy implications require stable, consensus-driven priorities.
Experimental Protocols
Protocol for Group-Based Ecosystem Service Weighting
Phase 1: Hierarchical Structure Development
Objective: Construct a comprehensive hierarchy of ecosystem services and decision criteria through stakeholder engagement.
Procedure:
- Stakeholder Identification and Recruitment: Convene a balanced group of 8-12 participants representing key perspectives: ecological experts (30%), local community representatives (30%), policy makers (25%), and economic stakeholders (15%) [94].
- Structured Elicitation Session: Conduct a 90-minute facilitated workshop using the following script:
"We aim to identify and structure the key ecosystem services provided by this landscape. Please list all services you consider important, then we will collaboratively group them into categories."
- Hierarchy Validation: Present the draft hierarchy to stakeholders for verification and refinement, ensuring all relevant services (provisioning, regulating, cultural, supporting) are adequately represented [3].
Materials:
- Digital collaboration platform (e.g., Miro, Expert Choice)
- Structured elicitation questionnaire
- Pre-defined ecosystem service classification framework
Phase 2: Pairwise Comparison and Judgment Collection
Objective: Elicit consistent, quantitative comparisons of ecosystem service relative importance.
Procedure:
- Individual Judgment Collection: Each stakeholder independently completes pairwise comparison matrices using Saaty's 1-9 scale (Table 2), comparing all criteria and sub-criteria at each hierarchical level [14].
- Group Judgment Aggregation: Compute the geometric mean of individual judgments for each pairwise comparison to form the aggregated group comparison matrix [14].
- Consistency Verification: Calculate consistency ratios for each individual and the aggregated matrix, following up with participants whose CR > 0.10 to refine their judgments.
Table 2: Saaty's Fundamental Scale for Pairwise Comparisons
| Intensity of Importance | Definition | Explanation in Ecosystem Service Context |
|---|---|---|
| 1 | Equal importance | Two services contribute equally to the objective |
| 3 | Moderate importance | Experience and judgment slightly favor one service over another |
| 5 | Strong importance | Experience and judgment strongly favor one service over another |
| 7 | Very strong importance | One service is strongly favored and its dominance demonstrated in practice |
| 9 | Extreme importance | The evidence favoring one service over another is of the highest possible order of affirmation |
| 2,4,6,8 | Intermediate values | Used when compromise is needed between adjacent judgments |
Materials:
- AHP data collection software (Expert Choice, TransparentChoice, or custom spreadsheet)
- Saaty's fundamental scale reference cards
- Individual judgment recording forms
Protocol for Consistency and Robustness Testing
Consistency Optimization Procedure
Objective: Identify and resolve inconsistent judgments in ecosystem service evaluations.
Procedure:
- Calculate Eigenvectors and Lambda Max: For each comparison matrix, compute the principal eigenvector and λ_max using the power method or approximation algorithms [14].
- Compute Consistency Index: CI = (λ_max - n)/(n - 1), where n is the matrix size.
- Determine Consistency Ratio: CR = CI/RI, where RI is the random index value based on matrix size.
- Iterative Refinement: If CR > 0.10, identify the most inconsistent comparisons (those with the highest deviation from consistency) and re-engage stakeholders to reconsider these specific judgments [14].
Materials:
- AHP calculation software with consistency analysis capabilities
- Pre-calculated random index values for matrix sizes 3-15
- Visual aids to help stakeholders understand consistency concepts
Sensitivity Analysis Protocol
Objective: Test the robustness of ecosystem service priorities to variations in stakeholder judgments.
Procedure:
- Judgment Perturbation: Systematically vary key pairwise comparisons by ±1 point on Saaty's scale and recalculate priorities.
- Priority Stability Assessment: Measure the rank correlation (Kendall's Tau) between original and perturbed priority vectors.
- Threshold Identification: Determine the minimum judgment changes required to alter the top-ranked ecosystem services.
- Scenario Testing: Evaluate priority stability across different stakeholder weighting scenarios (e.g., equal weighting, expert-weighted, community-weighted) [92].
Materials:
- Sensitivity analysis software module
- Scenario planning templates
- Visualization tools for presenting stability results to stakeholders
Visualization of AHP Group Decision Workflow
Research Reagent Solutions
Table 3: Essential Research Materials for AHP Implementation in Ecosystem Studies
| Item | Function | Implementation Example |
|---|---|---|
| Expert Choice Software | Commercial AHP implementation for data collection and analysis | Used by NASA and Fortune 500 companies for complex decision support; enables real-time consistency checking during stakeholder workshops [14] |
| TransparentChoice Platform | Web-based AHP for distributed stakeholder engagement | Facilitates remote participation of diverse stakeholders in ecosystem valuation across geographical boundaries [14] |
| Saaty's Fundamental Scale (1-9) | Standardized scale for pairwise comparisons | Provides common reference framework for stakeholders to quantify relative importance of different ecosystem services [14] |
| Random Index (RI) Values | Reference values for consistency ratio calculation | Pre-calculated values (n=3:0.58, n=4:0.90, n=5:1.12) used as denominator in CR calculations to normalize consistency measurement [14] |
| Geometric Mean Algorithm | Mathematical method for aggregating individual judgments | Ensures proportional representation of all stakeholder perspectives while minimizing dominance of extreme opinions in ecosystem service weighting [14] [92] |
| Sensitivity Analysis Module | Software component for testing priority robustness | Determines how much stakeholder judgments must change to alter top-ranked ecosystem services, identifying critical decision points [92] |
| Structured Elicitation Framework | Protocol for stakeholder interviews and workshops | Standardized approach for eliciting comprehensive list of ecosystem services and structuring them into logical hierarchy [3] [94] |
Limitations and Boundary Conditions of AHP for Environmental Decision Support
The Analytic Hierarchy Process (AHP) has emerged as a pivotal multi-criteria decision analysis (MCDA) method for tackling complex environmental challenges, particularly in ecosystem service weighting. While its structured approach for organizing and analyzing complex decisions has gained widespread adoption, understanding its limitations and boundary conditions remains essential for appropriate application. This application note provides a comprehensive examination of AHP's theoretical constraints and practical implementation challenges within environmental contexts. We present a structured protocol for researchers engaged in ecosystem service valuation, supplemented by comparative analyses with alternative methodologies and visualization of key decision pathways to enhance methodological rigor in environmental decision-making.
The Analytic Hierarchy Process (AHP), developed by Thomas Saaty in the 1970s, constitutes a systematic and structured approach to decision-making wherein options are ranked and compared based on various criteria [95]. AHP encompasses three fundamental components: a pairwise comparison of criteria, a hierarchy of objectives, and an eigenvector computation for determining the relative significance of the alternatives [95]. This method has been extensively utilized across various sectors, including environmental studies, engineering, management, and public policy [95].
In environmental decision support, AHP is particularly valuable for prioritizing ecosystem services—the benefits humans receive from ecosystems [56]. Managing natural resource lands requires social as well as biophysical considerations, and AHP provides a systematic, explicit, rigorous, and robust mechanism for eliciting and quantifying subjective judgments [42]. Its ability to handle both quantitative and qualitative data, while incorporating stakeholder preferences, makes it particularly appealing for environmental applications where multiple conflicting criteria often exist.
However, despite its popularity, AHP faces significant theoretical and practical challenges. Many researchers emphasize the simplicity and naturalness of the AHP procedure for evaluating alternatives, while others believe the method is fundamentally flawed and therefore cannot be applied in practice [96]. This divergence of opinion necessitates a thorough understanding of the method's limitations and boundary conditions, particularly when applied to complex environmental systems with interconnected components.
Theoretical Limitations of AHP
Structural Constraints and Hierarchy Assumptions
The fundamental architectural limitation of AHP lies in its requirement for a strict hierarchical structure that simplifies reality by distributing criteria as a hierarchy [56]. This hierarchical assumption becomes problematic when dealing with interconnected ecosystem services where feedback loops and complex interdependencies exist. For instance, in wetland ecosystems, provisioning services (e.g., food production), regulating services (e.g., water purification), and cultural services (e.g., recreational value) often exhibit strong interrelationships that cannot be adequately captured in a unidirectional hierarchy [56] [63].
The rigidity of this hierarchical structure becomes particularly constraining in environmental applications where dynamic feedback mechanisms operate between different ecosystem components. Unlike the Analytic Network Process (ANP), which allows for more realistic network relationships, AHP's unidirectional hierarchy may oversimplify these complex ecological relationships, potentially leading to distorted priority assignments [56].
Mathematical and Measurement Limitations
AHP's mathematical foundation has been subject to significant scholarly critique. J. Barzilai, author of a New Theory of Measurement, contends that "the AHP is plagued by many flaws, and these flaws are fundamental" [96]. Specifically, Barzilai argues that Saaty did not adequately define what is meant by terms such as "importance of criteria" or "relative importance" of criteria, and that criterion importance coefficients cannot be interpreted as a measure of the relative importance of criteria [96].
The method employs pairwise comparisons based on expert judgments, using a fundamental measurement scale that has been questioned mathematically [96]. The existence of two psychophysical laws—Fechner's law and Stevens' law—presents a paradoxical contradiction in psychophysics that remains unresolved in AHP's foundation [96]. This measurement scale issue becomes particularly relevant when quantifying intangible environmental values such as cultural ecosystem services or existence values.
Additionally, AHP faces the challenge of rank reversal, where the introduction of new alternatives can change the relative ranking of existing options [97]. This phenomenon remains a contentious issue in AHP, impacting the reliability of decisions based on aggregated preferences, especially in environmental contexts where alternatives may be added or removed throughout the decision process [97].
Table 1: Theoretical Limitations of AHP in Environmental Applications
| Limitation Category | Specific Constraints | Impact on Environmental Decision Support |
|---|---|---|
| Structural Constraints | Strict hierarchical requirement | Inadequate representation of ecosystem interconnectedness |
| Unidirectional relationships | Failure to capture ecological feedback loops | |
| Mathematical Foundations | Questionable ratio scale assumptions | Problems quantifying intangible environmental values |
| Rank reversal phenomenon | Unstable rankings with alternative addition/removal | |
| Eigenvector computation limitations | Potential for mathematically inconsistent results | |
| Measurement Issues | Reliance on subjective judgments | Susceptibility to cognitive biases in expert elicitation |
| Pairwise comparison limitations | Cognitive overload with numerous ecosystem services |
Practical Implementation Challenges
Interdependence Oversimplification in Ecosystem Services
A critical practical limitation emerges when applying AHP to interconnected environmental systems. Comparative studies between AHP and ANP in prioritizing ecosystem services reveal that AHP considerably overestimates the most abstract services [56]. Specifically, decision-makers tend to overvalue cultural services as they are socially more visible than others, and in AHP's hierarchical structure, these services are not compared directly with other elements [56].
This overestimation problem was empirically demonstrated in a case study conducted in a rice field area in the Guadalquivir marshes located within the Doñana Biosphere Reserve in Spain [56]. The research found that when a problem impacts production and affects many people, AHP magnifies its importance because it remains in the limelight, thereby introducing systematic bias in ecosystem service valuation [56].
The interdependence challenge was further evidenced in research valuing ecosystem services in the Albufera Natural Park of Valencia, where significant differences emerged between AHP and ANP results when valuing individual ecosystem services [63]. While AHP could be used as a less time-consuming and cheaper method to obtain Total Economic Value, it proved inadequate for accurately valuing individual ecosystem services due to their interconnected nature [63].
Cognitive and Expert Consistency Challenges
The practical implementation of AHP depends heavily on the quality and consistency of expert judgments. Inconsistencies in pairwise comparisons can significantly affect priority derivation and decision outcomes [97]. The method incorporates a Consistency Ratio (CR) to measure the coherence of judgments, with generally accepted thresholds below 10% for matrices of rank n > 4, 5% for n = 3, and 8% for n = 4 [63].
However, maintaining consistency becomes increasingly challenging as the number of ecosystem services and criteria grows—a common scenario in complex environmental assessments. The cognitive load on experts performing pairwise comparisons escalates exponentially with additional factors, potentially compromising judgment quality. This challenge necessitates careful workshop facilitation and potential decomposition of complex decisions into manageable components.
An experienced practitioner must be skilful in facilitating constructive debate and applying de-biasing techniques when capturing stakeholder preferences [98]. A particularly useful technique is to question how views that appear unduly biased relate back to relevant strategic objectives, especially in government environmental decisions [98].
Table 2: AHP Implementation Challenges in Environmental Contexts
| Implementation Phase | Challenge | Potential Mitigation Strategies |
|---|---|---|
| Problem Structuring | Oversimplification of ecosystem relationships | Complement with network analysis; Use hybrid approaches |
| Expert Elicitation | Cognitive overload with numerous criteria | Hierarchical decomposition; Limit criteria to 7±2 |
| Judgment inconsistencies | Consistency ratio monitoring; Expert training | |
| Data Integration | Handling quantitative and qualitative data | Appropriate scaling techniques; Mixed-method approaches |
| Stakeholder Engagement | Incorporating diverse perspectives | Structured workshops; Anonymous voting |
| Result Interpretation | Addressing rank reversal | Sensitivity analysis; Alternative scoring methods |
Boundary Conditions for AHP Application
Appropriate Use Cases for AHP
Despite its limitations, AHP remains a valuable tool within specific boundary conditions. It is most appropriate when:
- The decision problem can be reasonably structured hierarchically without significant interdependencies among criteria [56]
- The number of criteria and alternatives is manageable, typically not exceeding 7±2 elements per level to avoid cognitive overload [97]
- Stakeholder engagement is required, and a transparent, structured decision process is needed [42]
- Both quantitative and qualitative factors must be considered simultaneously [98]
- The decision context involves conflicting objectives that require explicit trade-offs [98]
AHP is particularly well-suited for discrete-choice problems where options are mutually exclusive rather than portfolio decisions where multiple options can be selected [98]. In environmental contexts, this makes AHP appropriate for site selection problems (e.g., wind farm location [12]) or choosing between alternative management strategies rather than designing complex, interconnected conservation strategies.
When to Consider Alternative Methods
Specific boundary conditions indicate when alternative MCDA methods may be more appropriate than AHP:
- Strong interdependencies exist among criteria or alternatives → Consider Analytic Network Process (ANP) [56] [63]
- High decision stakes with significant consequences → Use more robust methods with stricter mathematical foundations [98]
- Compensation between criteria is not appropriate → Consider outranking methods (e.g., ELECTRE) [98]
- Significant uncertainty or fuzzy information → Consider fuzzy AHP or other fuzzy MCDM methods [97]
- Need for cardinal measure of benefit for value-for-money assessment → Use Cost-Benefit Analysis or Cost-Effectiveness Analysis instead [98]
For ecosystem service weighting specifically, ANP is recommended when higher accuracy is required and when intangible assets coexist despite being more time-consuming and complex [56]. The ANP considers interdependence among criteria, drawing a complex network that can help reduce subjectivity and uncertainty [56].
Experimental Protocols for Ecosystem Service Weighting
Protocol 1: Structured Hierarchy Development for Ecosystem Services
Purpose: To establish a comprehensive hierarchical structure for ecosystem service assessment using AHP.
Materials and Reagents:
- Stakeholder mapping templates
- Ecosystem service classification guides (e.g., Millennium Ecosystem Assessment)
- Hierarchical structure diagramming software
- Expert panel (minimum 5-10 experts with ecological, social, and economic expertise)
Procedure:
- Stakeholder Identification: Identify and categorize all relevant stakeholders using a structured stakeholder mapping approach. A subset will be appointed as decision stakeholders whose preferences will be formally elicited [98].
- Problem Definition: Conduct facilitated workshops with stakeholders to establish shared understanding of the environmental decision context and objectives [98].
- Ecosystem Service Classification: Categorize relevant ecosystem services using the Millennium Ecosystem Assessment framework [63]:
- Supporting services (e.g., nutrient recycling, primary production)
- Provisioning services (e.g., food provisioning, fresh water supply)
- Regulating services (e.g., climate regulation, air quality regulation)
- Cultural services (e.g., tourism and recreation, aesthetic value)
- Hierarchy Construction: Organize the decision problem into three primary levels:
- Level 1: Overall goal (e.g., "Sustainable ecosystem management")
- Level 2: Criteria (ecosystem service categories)
- Level 3: Sub-criteria (specific ecosystem services)
- Level 4: Alternative management scenarios
- Hierarchy Validation: Review the hierarchical structure with stakeholders to ensure comprehensive representation of all relevant ecosystem services and decision elements.
Purpose: To systematically elicit and quantify expert judgments on the relative importance of ecosystem services.
Materials and Reagents:
- Saaty's fundamental scale of comparison [63]
- Pairwise comparison matrices
- Consistency calculation tools
- Expert panel (the same as in Protocol 1)
Procedure:
- Expert Training: Familiarize experts with the pairwise comparison process and Saaty's scale:
- 1: Equal importance
- 3: Moderate importance
- 5: Strong importance
- 7: Very strong demonstrated importance
- 9: Extreme importance
- 2,4,6,8: Intermediate values [63]
- Matrix Preparation: Create pairwise comparison matrices for each level of the hierarchy, comparing all elements at that level with respect to each element at the preceding level.
- Judgment Elicitation: Guide experts through pairwise comparisons in a controlled workshop setting, using de-biasing techniques to minimize cognitive biases [98].
- Consistency Verification: Calculate consistency ratios for each set of comparisons:
- Compute the principal eigenvector of the pairwise comparison matrix
- Calculate consistency index: CI = (λmax - n)/(n - 1)
- Determine consistency ratio: CR = CI/RI (where RI is the random index)
- Accept inconsistencies below 10% for matrices of rank n > 4, 5% for n = 3, and 8% for n = 4 [63]
- Weight Aggregation: Synthesize the resulting eigenvectors to determine the relative weights of ecosystem services and alternatives.
- Sensitivity Analysis: Test the robustness of results by examining how changes in judgments affect overall priorities [97].
Diagram 1: AHP Workflow for Ecosystem Service Weighting
Comparative Methodological Framework
AHP versus ANP for Ecosystem Service Valuation
When deciding between AHP and ANP for environmental applications, researchers should consider the comparative advantages and limitations of each approach:
Table 3: Comparative Analysis Between AHP and ANP for Ecosystem Service Valuation
| Characteristic | AHP | ANP |
|---|---|---|
| Structural Approach | Strict hierarchy | Flexible network |
| Interdependence Handling | Assumes independence | Explicitly models dependencies |
| Implementation Complexity | Moderate | High |
| Time Requirements | Less time-consuming | More time-consuming |
| Data Requirements | Fewer pairwise comparisons | More pairwise comparisons |
| Accuracy for Abstract Services | Overestimates cultural services | More balanced valuation |
| Theoretical Foundation | Well-established | Extension of AHP |
| Best Application Context | Simple to moderately complex systems | Complex, interconnected systems |
| Case Study Findings | Overestimated cultural services by 15-30% [56] | More balanced service valuation [56] |
Decision Framework for Method Selection
Diagram 2: Method Selection Decision Framework
Research Reagent Solutions
Table 4: Essential Methodological Tools for AHP Implementation in Ecosystem Service Research
| Research 'Reagent' | Function | Implementation Example |
|---|---|---|
| Saaty's Fundamental Scale | Standardized intensity of importance measure | Provides consistent measurement scale (1-9) for pairwise comparisons [63] |
| Consistency Ratio Calculator | Quality control for expert judgments | Identifies inconsistent judgments (CR > 0.1 requires revision) [63] |
| Stakeholder Mapping Template | Systematic identification of relevant perspectives | Ensures comprehensive inclusion of ecological, social, economic viewpoints [98] |
| Hierarchy Validation Protocol | Verification of structural appropriateness | Checks whether hierarchy adequately represents ecosystem relationships [56] |
| Sensitivity Analysis Toolkit | Robustness testing of results | Examines how changes in judgments affect ecosystem service priorities [97] |
| Expert Choice/Super Decisions Software | Computational implementation | Facilitates complex calculations and matrix operations [97] |
The application of AHP for environmental decision support, particularly in ecosystem service weighting, requires careful consideration of its limitations and boundary conditions. While AHP offers a structured, transparent approach for incorporating stakeholder preferences and handling mixed data types, its fundamental constraints—including hierarchical simplification, potential for rank reversal, and overestimation of abstract services—must be acknowledged and mitigated.
Researchers should employ AHP within its appropriate boundary conditions, primarily for decisions with limited interdependence among ecosystem services and when stakeholder engagement benefits from a structured, transparent process. For complex, interconnected environmental systems, ANP or hybrid approaches may yield more accurate and reliable results despite their additional complexity. The protocols and frameworks provided in this application note offer practical guidance for researchers navigating these methodological decisions in environmental applications.
Conclusion
The Analytical Hierarchy Process provides a robust, structured framework for weighting ecosystem services and navigating complex environmental trade-offs. By transforming multidimensional decision problems into manageable hierarchies, AHP enables transparent prioritization that balances ecological, economic, and social objectives. Key strengths include its capacity to integrate both quantitative metrics and qualitative stakeholder preferences, particularly valuable in contexts with conflicting management priorities. Future applications should focus on developing hybrid approaches that combine AHP with spatial modeling and dynamic assessment tools, while expanding its use in emerging areas like climate adaptation planning and nature-based solution evaluation. As environmental decision-making grows increasingly complex, AHP's systematic methodology offers valuable support for developing more sustainable and socially acceptable management strategies.
References
- 1. What is the Analytic Hierarchy Process (AHP)? [https://www.1000minds.com/decision-making/analytic-hierarchy-process-ahp]
- 2. Comprehensive Guide to Analytic Hierarchy Process (AHP) ... [https://www.6sigma.us/six-sigma-in-focus/analytic-hierarchy-process-ahp/]
- 3. Analytic hierarchy process [https://en.wikipedia.org/wiki/Analytic_hierarchy_process]
- 4. Using the analytic hierarchy process (ahp) to select and ... [https://www.pmi.org/learning/library/analytic-hierarchy-process-prioritize-projects-6608]
- 5. Using Analytical Hierarchy Process (AHP) to Introduce ... [https://www.mdpi.com/2071-1050/13/3/1258]
- 6. Applying the Analytic Hierarchy Process in healthcare research [https://pmc.ncbi.nlm.nih.gov/articles/PMC4690361/]
- 7. What is the Analytical Hierarchy Process? And How Does it ... [https://onlinepmcourses.com/what-is-the-analytical-hierarchy-process-and-how-does-it-work/]
- 8. Evaluation of Ecosystem Service Capacity Using the ... [https://pmc.ncbi.nlm.nih.gov/articles/PMC11992009/]
- 9. Linking Ecosystem Services to Social Well-Being [https://www.frontiersin.org/journals/ecology-and-evolution/articles/10.3389/fevo.2021.654560/full]
- 10. Lessons learned from a study based on the AHP method ... [https://pmc.ncbi.nlm.nih.gov/articles/PMC10597795/]
- 11. AHP APPROACH APPLIED TO MULTI-CRITERIA ... [https://revistas.ufpr.br/floresta/article/view/65146]
- 12. Developed analytic hierarchy process and multi criteria ... [https://www.sciencedirect.com/science/article/pii/S2590174524000722]
- 13. Life cycle assessment and multi-criteria decision-making ... [https://link.springer.com/article/10.1007/s11367-024-02331-9]
- 14. Analytic Hierarchy Process (AHP): A Complete Guide [https://www.transparentchoice.com/analytic-hierarchy-process]
- 15. Tutorials - AHP Calculation Methods [https://www.spicelogic.com/docs/ahpsoftware/intro/ahp-calculation-methods-396]
- 16. Trade-offs between agricultural production and ecosystem ... [https://www.nature.com/articles/s41598-025-06650-1]
- 17. Complementary use of the Ecosystem Service Concept ... - PMC [https://pmc.ncbi.nlm.nih.gov/articles/PMC9012706/]
- 18. An Analytic Hierarchy Process Approach for Prioritisation of ... [https://www.mdpi.com/2071-1050/13/4/2254]
- 19. Understanding the Value of Ecosystem Services: Functions ... [https://mitigationbankinginc.com/understanding-the-value-of-ecosystem-services/]
- 20. Valuation of Ecosystem Services Based on EU Carbon ... [https://pmc.ncbi.nlm.nih.gov/articles/PMC9819813/]
- 21. Application of analytic hierarchy process to develop a ... [https://www.sciencedirect.com/science/article/abs/pii/S0048969719306588]
- 22. in Action: Comparative Exploration of AHP in... Weighting Methods [https://www.intechopen.com/chapters/1192276]
- 23. A Guide for Incorporating Ecosystem Service Valuation into ... [https://coast.noaa.gov/digitalcoast/training/ecosystem-service-valuation.html]
- 24. The revised Ecosystem Services Procedure V2-0 is ... [https://fsc.org/en/newscentre/general-news/the-revised-ecosystem-services-procedure-v2-0-is-published]
- 25. A two-stage model of the fuzzy analytic hierarchy process ... [https://www.nature.com/articles/s41598-025-88236-5]
- 26. 4 colors #4285f4, #ea4335, #fbbc05, #34a853 [https://colorswall.com/palette/312798]
- 27. Google New Color Palette [https://www.color-hex.com/color-palette/51381]
- 28. How Assign Weights by Pairwise Comparison works [https://pro.arcgis.com/en/pro-app/latest/tool-reference/analysis/how-assign-weights-by-pairwise-comparison-works.htm]
- 29. A world of choices: Preference elicitation methods for ... [https://pmc.ncbi.nlm.nih.gov/articles/PMC9772083/]
- 30. Analytic hierarchy process (AHP) as a method to elicit ... [https://pubmed.ncbi.nlm.nih.gov/22004779/]
- 31. Methods for exploring and eliciting patient preferences in ... [https://www.sciencedirect.com/science/article/pii/S1359644618305373]
- 32. Priority Vectors - Analytic Hierarchy Process AHP Tutorial [https://people.revoledu.com/kardi/tutorial/AHP/Priority%20Vector.htm]
- 33. Priority vector and eigenvectors - AHP method [https://math.stackexchange.com/questions/1272705/priority-vector-and-eigenvectors-ahp-method]
- 34. Ranking landscape-level management planning scenarios ... [https://www.frontiersin.org/journals/forests-and-global-change/articles/10.3389/ffgc.2025.1707550/full]
- 35. a comparative assessment of ecosystem services models ... [https://www.nature.com/articles/s41598-024-76600-w]
- 36. Mapping Ecosystem Services Bundles for Spatial Planning ... [https://www.mdpi.com/2073-445X/12/6/1123]
- 37. Systematic assessment of benefits and risks: study protocol ... [https://pmc.ncbi.nlm.nih.gov/articles/PMC3886795/]
- 38. Consistency Improvement in the Analytic Hierarchy Process [https://www.mdpi.com/2227-7390/12/6/828]
- 39. Analytical Hierarchy Process - an overview [https://www.sciencedirect.com/topics/computer-science/analytical-hierarchy-process]
- 40. Multicriteria decision analysis and group decision-making to ... [https://research.fs.usda.gov/treesearch/62573]
- 41. Balancing different forest values: Evaluation of ... [https://www.sciencedirect.com/science/article/pii/S1389934116303872]
- 42. The Analytic Hierarchy Process and Participatory ... [https://research.fs.usda.gov/treesearch/251]
- 43. A new automatic AHP tool to assess the forest vulnerability ... [https://www.sciencedirect.com/science/article/pii/S1470160X25005370]
- 44. Assessing the dynamics of forest to define... ecosystem services [https://enveurope.springeropen.com/articles/10.1186/s12302-024-00956-z]
- 45. A comparative evaluation of forest fire hazard vulnerability ... [https://www.frontiersin.org/journals/forests-and-global-change/articles/10.3389/ffgc.2025.1635041/full]
- 46. Ranking ecosystem delivered by services in trees and urban ... rural [https://pmc.ncbi.nlm.nih.gov/articles/PMC9287513/]
- 47. Frontiers | Exploring potential trade - offs in outdoor water use... [https://www.frontiersin.org/journals/climate/articles/10.3389/fclim.2024.1280615/full]
- 48. Uncertainties in ecosystem services assessments and their ... [https://www.sciencedirect.com/science/article/pii/S221204162500018X]
- 49. Why Do Urban Grow Faster than Trees Ones? | The Brink Rural [https://www.bu.edu/articles/2025/why-do-urban-trees-grow-faster-than-rural-ones/]
- 50. Reducing uncertainty in ecosystem service modelling through ... [https://publications.jrc.ec.europa.eu/repository/handle/JRC123962]
- 51. Complex Decisions in Engineering: The Analytic Hierarchy ... [https://www.cureusjournals.com/blog/complex-decisions-in-engineering-the-analytic-hierarchy-process-ahp-for-multi-criteria-support]
- 52. Accounting and Ecosystem for... | SpringerLink Services AHP [https://link.springer.com/chapter/10.1007/978-3-031-65332-2_14]
- 53. Journal of Turkish Operations Management » Submission » AHP ... [https://dergipark.org.tr/en/pub/jtom/issue/51652/647170]
- 54. The analytic hierarchy process and human resource ... [https://www.sciencedirect.com/science/article/pii/S0895717707000842]
- 55. Article: Application of linear to derive the local programming in... weight [https://www.inderscience.com/info/inarticle.php?artid=78937]
- 56. Comparative analysis between AHP and ANP in prioritization... | CoLab [https://colab.ws/articles/10.1016%2Fj.ecoinf.2022.101739]
- 57. A hybrid AHP and statistical validation approach for ... [https://link.springer.com/article/10.1007/s43621-025-01416-1]
- 58. Enhancing consistency of AHP-based expert judgements [https://pmc.ncbi.nlm.nih.gov/articles/PMC12144522/]
- 59. A Simplified Algorithm for Dealing with Inconsistencies ... [https://www.mdpi.com/1999-4893/15/12/442]
- 60. Inconsistency Ratio [https://comparion.knowledgeowl.com/help/inconsistency-ratio]
- 61. A quantitative evaluation based on an analytic hierarchy ... [https://www.nature.com/articles/s40494-022-00655-z]
- 62. Lessons learned from a study based on the AHP method ... [https://www.sciencedirect.com/science/article/pii/S2215016123004363]
- 63. Economic Valuation of Ecosystem by Using the Services ... Analytic [https://iieta.org/journals/ijdne/paper/10.18280/ijdne.150101]
- 64. Intersecting Ecosystem Services Across the Aquatic ... [https://www.frontiersin.org/journals/ecology-and-evolution/articles/10.3389/fevo.2021.628658/full]
- 65. Building the Analytics ... | IntechOpen Hierarchy Process [https://www.intechopen.com/chapters/1199917]
- 66. (PDF) Participatory for resource... analytic hierarchy process [https://www.academia.edu/62450880/Participatory_analytic_hierarchy_process_for_resource_allocation_in_agricultural_development_projects]
- 67. A framework to assess landscape structural capacity to provide... [https://pubmed.ncbi.nlm.nih.gov/29309964/]
- 68. Guide: Stakeholder Best Practices Engagement [https://simplystakeholders.com/stakeholder-engagement-best-practices/]
- 69. How to Improve Project Stakeholder in 4 Steps Engagement [https://www.brightwork.com/blog/improve-project-stakeholder-engagement]
- 70. AHP Software by Expert Choice for Structured Decision ... [https://www.expertchoice.com/ahp-software]
- 71. An integrated fuzzy AHP–ELECTRE methodology for ... [https://www.sciencedirect.com/science/article/pii/S0957417411000777]
- 72. An Application of Fuzzy Analytic Hierarchy Process in Risk ... [https://pmc.ncbi.nlm.nih.gov/articles/PMC8492957/]
- 73. The technique of fuzzy analytic hierarchy process (FAHP) ... [https://pmc.ncbi.nlm.nih.gov/articles/PMC11888883/]
- 74. Integrating fuzzy analytic hierarchy process into ecosystem ... [https://www.sciencedirect.com/science/article/pii/S1574954124001675]
- 75. Fuzzy AHP Assessment of Urban Parks Quality and ... [https://www.mdpi.com/1999-4907/14/6/1227]
- 76. Site Selection of Urban Parks Based on Fuzzy-Analytic ... [https://www.mdpi.com/1660-4601/19/20/13159]
- 77. A logarithmic fuzzy preference programming methodology [https://www.sciencedirect.com/science/article/pii/S0888613X10001611]
- 78. Developing Indicators for the Valuation of River Ecosystem ... [https://www.mdpi.com/2073-445X/14/10/2091]
- 79. AHP Consistency Ratio [https://www.spicelogic.com/docs/ahpsoftware/intro/ahp-consistency-ratio-transitivity-rule-388]
- 80. Tutorial: Analytic Index and... Hierarchy Process AHP Consistency [https://people.revoledu.com/kardi/tutorial/AHP/Consistency.htm]
- 81. – High AHP – BPMSG Consistency Ratio [https://bpmsg.com/ahp-high-consistency-ratio/]
- 82. Ecosystem health assessment: a PSR analysis combining ... [https://www.frontiersin.org/journals/marine-science/articles/10.3389/fmars.2024.1396026/full]
- 83. 7 Essential Factors for Biotechnology Growth via Factor Analysis [https://www.numberanalytics.com/blog/7-essential-factors-biotechnology-growth-factor-analysis]
- 84. Trade-Off and Synergy Relationships and Driving Factor of... Analysis [https://www.mdpi.com/2072-4292/16/17/3147]
- 85. A protocol for implementing parameter sensitivity in... analyses [https://ideas.repec.org/a/eee/ecomod/v501y2025ics0304380024003788.html]
- 86. Ecological sensitivity analysis of the Chengdu–Chongqing ... [https://link.springer.com/article/10.1007/s43621-025-01571-5]
- 87. Ecosystem services and agriculture: tradeoffs and synergies [https://pmc.ncbi.nlm.nih.gov/articles/PMC2935121/]
- 88. How to Prioritize the Attributes of Water Ecosystem Service ... [https://www.mdpi.com/2071-1050/14/23/15767]
- 89. A framework for the social valuation of ecosystem services [https://pmc.ncbi.nlm.nih.gov/articles/PMC4392016/]
- 90. Integrating ecosystem services, stakeholders' perspective ... [https://link.springer.com/article/10.1007/s10980-024-01886-0]
- 91. An opportunity map approach for agricultural landscapes [https://www.sciencedirect.com/science/article/pii/S1470160X25001414]
- 92. AHP, a Reliable Method for Quality Decision Making [https://www.mdpi.com/2071-1050/13/24/13932]
- 93. State-of-the-art on analytic hierarchy process in the last 40 years: Literature review based on Latent Dirichlet Allocation topic modelling - PMC [https://pmc.ncbi.nlm.nih.gov/articles/PMC9140269/]
- 94. Using the Analytic Hierarchy Process (AHP) to understand the ... [https://pmc.ncbi.nlm.nih.gov/articles/PMC4705498/]
- 95. Mapping analytical hierarchy process research to ... [https://pmc.ncbi.nlm.nih.gov/articles/PMC10457455/]
- 96. The Problem of the Adequacy of the Analytic Hierarchy ... [https://www.intechopen.com/chapters/1131247]
- 97. (PDF) Analytic and Hierarchy Choice: Benefits and... Process Expert [https://www.academia.edu/5180312/Analytic_Hierarchy_Process_and_Expert_Choice_Benefits_and_limitations]
- 98. An Introductory Guide to Multi-Criteria Decision Analysis ... [https://analysisfunction.civilservice.gov.uk/policy-store/an-introductory-guide-to-mcda/]